Estimated zip code population in 2022: 14,303 Zip code population in 2010: 14,945 Zip code population in 2000: 13,321
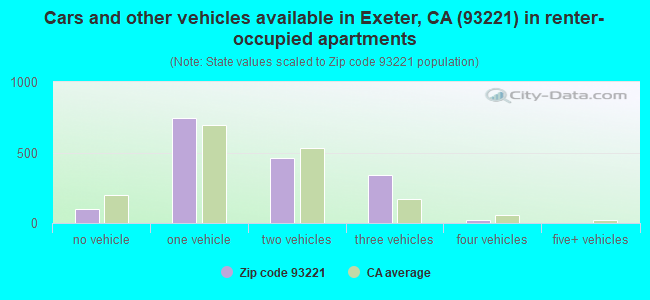
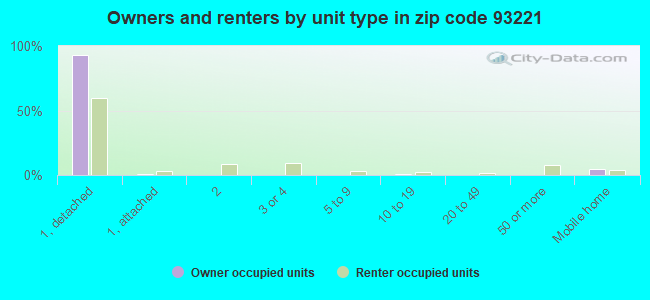
Houses and condos: 5,091 Renter-occupied apartments: 1,664
% of renters here:
35%
State:
44%
March 2022 cost of living index in zip code 93221: 88.2 (less than average, U.S. average is 100)
Land area: 131.7 sq. mi. Water area: 0.0 sq. mi.
Population density: 109 people per square mile
(very low).
OSM Map
General Map
Google Map
MSN Map
OSM Map
General Map
Google Map
MSN Map
OSM Map
General Map
Google Map
MSN Map
OSM Map
General Map
Google Map
MSN Map
Please wait while loading the map...
Real estate property taxes paid for housing units in 2022:
This zip code:
0.7% ($2,566)
California:
0.7% ($4,831)
Median real estate property taxes paid for housing units with mortgages in 2022: $2,636 (0.8%) Median real estate property taxes paid for housing units with no mortgage in 2022: $2,365 (0.6%)
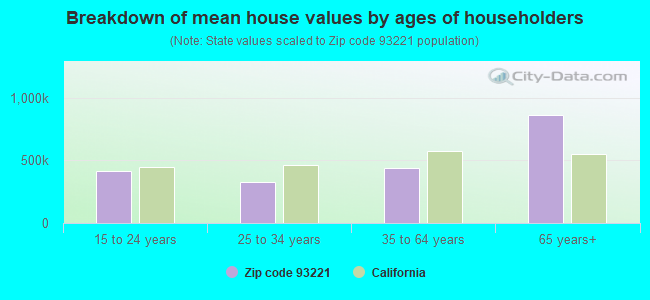
Estimated median house/condo value in 2022: $342,368
93221:
$342,368
California:
$715,900
According to our research of California and other state lists, there were 25 registered sex offenders living in 93221 zip code as of April 27, 2024. The ratio of all residents to sex offenders in zip code 93221 is 613 to 1. The ratio of registered sex offenders to all residents in this zip code is near the state average.
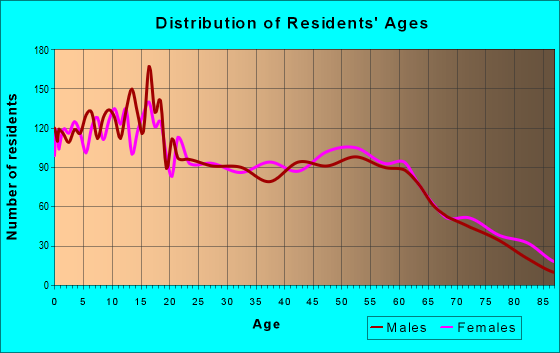
Median resident age:
This zip code:
36.7 years
California median age:
37.9 years
Average household size:
This zip code:
3.0 people
California:
2.8 people
Averages for the 2020 tax year for zip code 93221, filed in 2021:
Average Adjusted Gross Income (AGI) in 2020: $64,175 (Individual Income Tax Returns)
Here:
$64,175
State:
$95,910
Salary/wage: $53,811 (reported on 81.8% of returns)
Here:
$53,811
State:
$77,331
(% of AGI for various income ranges: 1270.7% for AGIs below $25k, 4192.8% for AGIs $25k-50k, 7532.7% for AGIs $50k-75k, 11453.6% for AGIs $75k-100k, 21088.7% for AGIs $100k-200k, 83677.1% for AGIs over 200k)
Taxable interest for individuals: $1,795 (reported on 32.4% of returns)
This zip code:
$1,795
California:
$2,294
(% of AGI for various income ranges: 11.2% for AGIs below $25k, 17.0% for AGIs $25k-50k, 25.0% for AGIs $50k-75k, 76.1% for AGIs $75k-100k, 242.3% for AGIs $100k-200k, 2967.1% for AGIs over 200k)
Ordinary dividends: $6,465 (reported on 11.1% of returns)
Here:
$6,465
State:
$10,949
(% of AGI for various income ranges: 16.1% for AGIs below $25k, 21.6% for AGIs $25k-50k, 62.5% for AGIs $50k-75k, 98.5% for AGIs $75k-100k, 335.1% for AGIs $100k-200k, 3145.7% for AGIs over 200k)
Net capital gain/loss in AGI: +$21,926 (reported on 11.7% of returns)
Here:
+$21,926
State:
+$49,306
(% of AGI for various income ranges: 6.4% for AGIs below $25k, 20.7% for AGIs $25k-50k, 136.2% for AGIs $50k-75k, 95.5% for AGIs $75k-100k, 762.6% for AGIs $100k-200k, 17614.3% for AGIs over 200k)
Profit/loss from business: +$18,292 (reported on 14.3% of returns)
Here:
+$18,292
State:
+$15,671
(% of AGI for various income ranges: 88.7% for AGIs below $25k, 159.7% for AGIs $25k-50k, 331.9% for AGIs $50k-75k, 689.1% for AGIs $75k-100k, 1092.6% for AGIs $100k-200k, 7928.6% for AGIs over 200k)
Taxable individual retirement arrangement distribution: $21,053 (reported on 5.5% of returns)
93221:
$21,053
California:
$23,505
(% of AGI for various income ranges: 28.5% for AGIs below $25k, 52.8% for AGIs $25k-50k, 143.3% for AGIs $50k-75k, 267.6% for AGIs $75k-100k, 606.7% for AGIs $100k-200k, 3627.1% for AGIs over 200k)
Self-employed (Keogh) retirement plans: $40,900 (reported on 0.5% of returns)
93221:
$40,900
California:
$30,163
(% of AGI for various income ranges: 314.6% for AGIs $100k-200k)
Total itemized deductions: $31,536 (reported on 10.2% of returns)
Here:
$31,536
State:
$39,517
(% of AGI for various income ranges: 42.7% for AGIs below $25k, 152.4% for AGIs $25k-50k, 372.5% for AGIs $50k-75k, 680.9% for AGIs $75k-100k, 2055.1% for AGIs $100k-200k, 8854.3% for AGIs over 200k)
Charity contributions: $9,640 (reported on 8.0% of returns)
Here:
$9,640
State:
$12,598
(% of AGI for various income ranges: 22.2% for AGIs $25k-50k, 49.6% for AGIs $50k-75k, 103.6% for AGIs $75k-100k, 580.0% for AGIs $100k-200k, 2704.3% for AGIs over 200k)
Taxes paid: $8,004 (reported on 10.3% of returns)
93221:
$8,004
State:
$8,807
(% of AGI for various income ranges: 6.4% for AGIs below $25k, 25.0% for AGIs $25k-50k, 106.0% for AGIs $50k-75k, 196.1% for AGIs $75k-100k, 573.8% for AGIs $100k-200k, 2198.6% for AGIs over 200k)
Earned income credit: $2,324 (reported on 20.0% of returns)
Here:
$2,324
State:
$2,074
(% of AGI for various income ranges: 114.4% for AGIs below $25k, 110.5% for AGIs $25k-50k)
Percentage of individuals using paid preparers for their 2020 taxes: 92.8%
Here:
93%
State:
92%
(% for various income ranges: 91.7% for AGIs below $25k, 93.0% for AGIs $25k-50k, 92.8% for AGIs $50k-75k, 92.7% for AGIs $75k-100k, 94.0% for AGIs $100k-200k, 96.4% for AGIs over 200k)
Averages for the 2012 tax year for zip code 93221, filed in 2013:
Average Adjusted Gross Income (AGI) in 2012: $56,210 (Individual Income Tax Returns)
Here:
$56,210
State:
$72,726
Salary/wage: $44,427 (reported on 83.3% of returns)
Here:
$44,427
State:
$59,079
(% of AGI for various income ranges: 74.0% for AGIs below $25k, 80.5% for AGIs $25k-50k, 76.2% for AGIs $50k-75k, 71.3% for AGIs $75k-100k, 78.1% for AGIs $100k-200k, 35.3% for AGIs over 200k)
Taxable interest for individuals: $2,035 (reported on 35.1% of returns)
This zip code:
$2,035
California:
$2,146
(% of AGI for various income ranges: 1.3% for AGIs below $25k, 0.3% for AGIs $25k-50k, 0.8% for AGIs $50k-75k, 0.9% for AGIs $75k-100k, 0.8% for AGIs $100k-200k, 2.6% for AGIs over 200k)
Ordinary dividends: $4,953 (reported on 13.8% of returns)
Here:
$4,953
State:
$9,308
(% of AGI for various income ranges: 1.1% for AGIs below $25k, 0.6% for AGIs $25k-50k, 0.6% for AGIs $50k-75k, 1.6% for AGIs $75k-100k, 1.0% for AGIs $100k-200k, 2.0% for AGIs over 200k)
Net capital gain/loss in AGI: +$13,675 (reported on 12.1% of returns)
Here:
+$13,675
State:
+$30,460
(% of AGI for various income ranges: 0.5% for AGIs $50k-75k, 0.8% for AGIs $75k-100k, 1.3% for AGIs $100k-200k, 9.6% for AGIs over 200k)
Profit/loss from business: +$14,204 (reported on 14.9% of returns)
Here:
+$14,204
State:
+$17,064
(% of AGI for various income ranges: 6.9% for AGIs below $25k, 4.2% for AGIs $25k-50k, 4.3% for AGIs $50k-75k, 2.6% for AGIs $75k-100k, 3.7% for AGIs $100k-200k, 2.5% for AGIs over 200k)
Taxable individual retirement arrangement distribution: $14,927 (reported on 8.0% of returns)
93221:
$14,927
California:
$19,557
(% of AGI for various income ranges: 2.2% for AGIs below $25k, 1.6% for AGIs $25k-50k, 1.7% for AGIs $50k-75k, 2.5% for AGIs $75k-100k, 2.5% for AGIs $100k-200k, 2.1% for AGIs over 200k)
Self-employment retirement plans: $23,850 (reported on 0.7% of returns)
93221:
$23,850
California:
$24,530
Total itemized deductions: $28,635 (24% of AGI, reported on 31.6% of returns)
Here:
$28,635
State:
$34,004
Here:
24.4% of AGI
State:
22.7% of AGI
(% of AGI for various income ranges: 9.4% for AGIs below $25k, 10.5% for AGIs $25k-50k, 15.3% for AGIs $50k-75k, 16.8% for AGIs $75k-100k, 19.5% for AGIs $100k-200k, 18.9% for AGIs over 200k)
Charity contributions: $4,115 (reported on 25.5% of returns)
Here:
$4,115
State:
$4,659
(% of AGI for various income ranges: 0.9% for AGIs below $25k, 1.1% for AGIs $25k-50k, 1.9% for AGIs $50k-75k, 2.4% for AGIs $75k-100k, 2.9% for AGIs $100k-200k, 1.5% for AGIs over 200k)
Taxes paid: $9,292 (reported on 31.4% of returns)
93221:
$9,292
State:
$14,448
(% of AGI for various income ranges: 1.6% for AGIs below $25k, 2.1% for AGIs $25k-50k, 3.5% for AGIs $50k-75k, 4.5% for AGIs $75k-100k, 6.7% for AGIs $100k-200k, 8.2% for AGIs over 200k)
Earned income credit: $2,496 (reported on 25.0% of returns)
Here:
$2,496
State:
$2,286
(% of AGI for various income ranges: 8.2% for AGIs below $25k, 1.9% for AGIs $25k-50k)
Percentage of individuals using paid preparers for their 2012 taxes: 67.9%
Here:
68%
State:
64%
(% for various income ranges: 65.4% for AGIs below $25k, 65.7% for AGIs $25k-50k, 69.9% for AGIs $50k-75k, 70.7% for AGIs $75k-100k, 73.7% for AGIs $100k-200k, 87.5% for AGIs over 200k)
Averages for the 2004 tax year for zip code 93221, filed in 2005:
Average Adjusted Gross Income (AGI) in 2004: $43,118 (Individual Income Tax Returns)
Here:
$43,118
State:
$58,600
Salary/wage: $38,613 (reported on 83.7% of returns)
Here:
$38,613
State:
$49,455
(% of AGI for various income ranges: 73.7% for AGIs $10k-25k, 82.2% for AGIs $25k-50k, 80.8% for AGIs $50k-75k, 81.7% for AGIs $75k-100k, 59.1% for AGIs over 100k)
Taxable interest for individuals: $1,824 (reported on 42.7% of returns)
This zip code:
$1,824
California:
$2,365
(% of AGI for various income ranges: 2.0% for AGIs $10k-25k, 1.4% for AGIs $25k-50k, 1.1% for AGIs $50k-75k, 1.1% for AGIs $75k-100k, 2.2% for AGIs over 100k)
Taxable dividends: $2,261 (reported on 18.3% of returns)
Here:
$2,261
State:
$4,746
(% of AGI for various income ranges: 1.0% for AGIs $10k-25k, 0.6% for AGIs $25k-50k, 0.4% for AGIs $50k-75k, 0.8% for AGIs $75k-100k, 1.2% for AGIs over 100k)
Net capital gain/loss: +$9,744 (reported on 16.3% of returns)
Here:
+$9,744
State:
+$23,418
(% of AGI for various income ranges: 0.5% for AGIs $10k-25k, 1.0% for AGIs $25k-50k, 1.3% for AGIs $50k-75k, 2.6% for AGIs $75k-100k, 7.7% for AGIs over 100k)
Profit/loss from business: +$18,941 (reported on 15.8% of returns)
Here:
+$18,941
State:
+$16,826
(% of AGI for various income ranges: 7.0% for AGIs $10k-25k, 3.9% for AGIs $25k-50k, 4.6% for AGIs $50k-75k, 4.6% for AGIs $75k-100k, 10.1% for AGIs over 100k)
IRA payment deduction: $3,558 (reported on 2.2% of returns)
93221:
$3,558
California:
$3,192
(% of AGI for various income ranges: 0.2% for AGIs $10k-25k, 0.2% for AGIs $25k-50k, 0.3% for AGIs $50k-75k, 0.2% for AGIs $75k-100k, 0.1% for AGIs over 100k)
Self-employed pension: $16,143 (reported on 0.9% of returns)
Here:
$16,143
California:
$17,688
Total itemized deductions: $20,717 (25% of AGI, reported on 34.1% of returns)
Here:
$20,717
State:
$28,113
Here:
24.6% of AGI
State:
25.3% of AGI
(% of AGI for various income ranges: 10.2% for AGIs $10k-25k, 12.9% for AGIs $25k-50k, 18.8% for AGIs $50k-75k, 21.5% for AGIs $75k-100k, 16.3% for AGIs over 100k)
Charity contributions deductions: $3,521 (4% of AGI, reported on 30.6% of returns)
Here:
$3,521
State:
$3,923
Here:
4.1% of AGI
State:
3.3% of AGI
(% of AGI for various income ranges: 1.0% for AGIs $10k-25k, 1.7% for AGIs $25k-50k, 2.7% for AGIs $50k-75k, 3.2% for AGIs $75k-100k, 2.9% for AGIs over 100k)
Total tax: $6,968 (reported on 68.9% of returns)
93221:
$6,968
State:
$10,761
(% of AGI for various income ranges: 3.8% for AGIs $10k-25k, 5.5% for AGIs $25k-50k, 8.0% for AGIs $50k-75k, 9.1% for AGIs $75k-100k, 18.5% for AGIs over 100k)
Earned income credit: $1,897 (reported on 21.9% of returns)
Here:
$1,897
State:
$1,763
Percentage of individuals using paid preparers for their 2004 taxes: 67.6%
Here:
68%
State:
66%
(% for various income ranges: 60.2% for AGIs below $10k, 66.1% for AGIs $10k-25k, 68.5% for AGIs $25k-50k, 72.3% for AGIs $50k-75k, 71.8% for AGIs $75k-100k, 78.2% for AGIs over 100k)
Likely homosexual households (counted as self-reported same-sex unmarried-partner households)
Lesbian couples: 0.4% of all households
Gay men: 0.2% of all households
Household received Food Stamps/SNAP in the past 12 months: 1,357 Household did not receive Food Stamps/SNAP in the past 12 months: 3,546
Women who had a birth in the past 12 months: 153 (93 now married, 61 unmarried) Women who did not have a birth in the past 12 months: 3,132 (1,492 now married, 1,629 unmarried)
Housing units in zip code 93221 with a mortgage: 1,901 (161 second mortgage, 13 home equity loan, 63 both second mortgage and home equity loan) Houses without a mortgage: 54
Median monthly owner costs for units with a mortgage: $1,715 Median monthly owner costs for units without a mortgage: $640
Residents with income below the poverty level in 2022:
This zip code:
16.8%
Whole state:
12.2%
Residents with income below 50% of the poverty level in 2022:
This zip code:
9.4%
Whole state:
6.2%
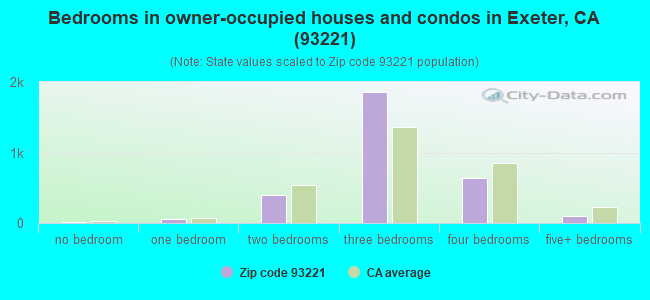
Median number of rooms in houses and condos:
Here:
5.9
State:
6.0
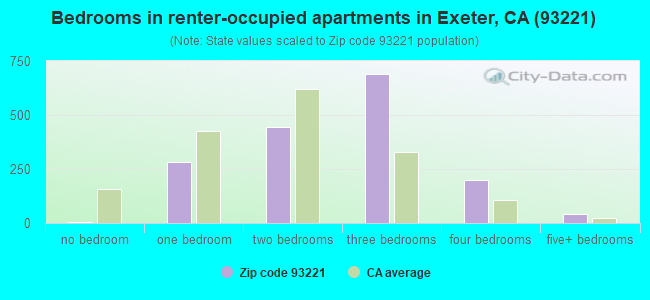
Median number of rooms in apartments:
Here:
4.8
State:
3.9
Notable locations in this zip code not listed on our city pages
Notable locations in zip code 93221: Dumtah (A), Dahlem Ranch (B), Powell Ranch (C), Ankeridge Dairy (D), Exeter High School Farm (E), Exter Golf Course (F), Gill Ranch (G), Sequoia State Fish Hatchery (H), Hamilton Ranch (I), Hinds Cabin (J), Exeter District Ambulance (K), Exeter Fire Department (L), Exeter Womans Club (M), Exeter Memorial Building (N), Exeter City Hall (O), Exeter Branch Tulare County Library (P). Display/hide their locations on the map
Churches in zip code 93221 include: Calvary Baptist Mission (A), Church of Christ (B), Church of God (C), Church of the Nazarene (D), Evangelical Methodist Church (E), First Assembly of God Church (F), First Baptist Church (G), First Presbyterian Church (H), Foursquare Gospel Church (I). Display/hide their locations on the map
In group quarters: 106 (-1 institutionalized population)
Size of family households: 1,289 2-persons, 937 3-persons, 537 4-persons, 370 5-persons, 227 6-persons, 160 7-or-more-persons
Size of nonfamily households: 1,105 1-person, 82 2-persons, 25 3-persons
1,667 married couples with children.
1,300 single-parent households (277 men, 1,023 women).
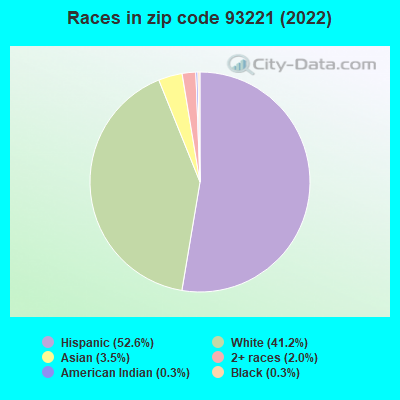
66.9% of residents of 93221 zip code speak English at home.
28.9% of residents speak Spanish at home (57% very well, 24% well, 13% not well, 6% not at all).
1.8% of residents speak other Indo-European language at home (69% very well, 9% well, 5% not well, 18% not at all).
2.2% of residents speak Asian or Pacific Island language at home (18% very well, 69% well, 13% not well).
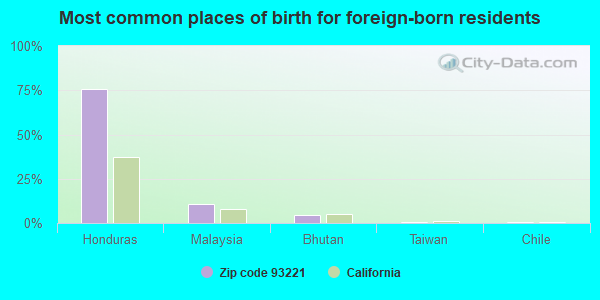
Foreign born population: 1,730 (12.1%) (45.0% of them are naturalized citizens)
This zip code:
12.1%
Whole state:
26.7%
76%Honduras
11%Malaysia
5%Bhutan
1%Taiwan
1%Chile
1%Brazil
1%Belgium
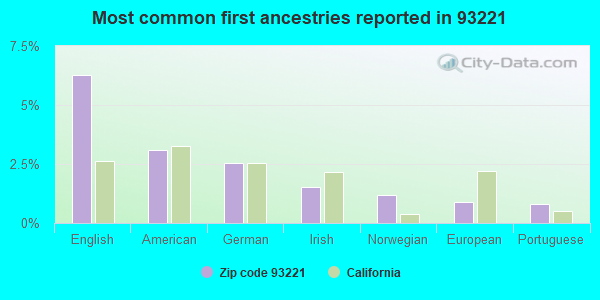
6%English
3%American
3%German
2%Irish
1%Norwegian
1%European
1%Portuguese
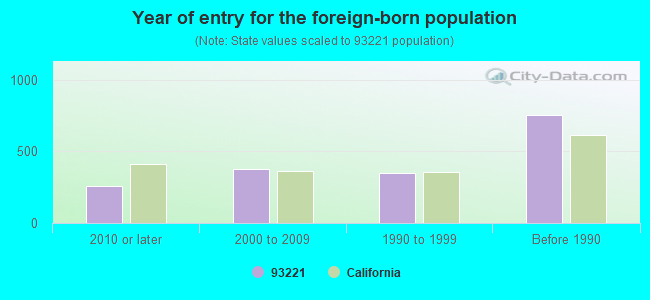
Year of entry for the foreign-born population
2612010 or later
3802000 to 2009
3511990 to 1999
754Before 1990
Major facilities with environmental interests located in this zip code:
MONARCH FORD (132 NORTH D STREET in EXETER, CA)
STATE MASTER (California - Hazardous Waste Tracking) - HAZARDOU WASTE PROGRAM Small Quantity Generators, between 100 kg and 1000 kg of hazardous waste/month (Resource Conservation and Recovery Act (tracking hazardous waste)) - notification STATE MASTER (California - Used Oil Recycling System ) - USED OIL RECYCLING Organizations: PAUL H DEATHRIAGE (CONTACT/OWNER)
AMARILLO WIND MACHINE CO (20513 AVE 256 in EXETER, CA)
STATE MASTER (California - Hazardous Waste Tracking) - HAZARDOU WASTE PROGRAM Small Quantity Generators, between 100 kg and 1000 kg of hazardous waste/month (Resource Conservation and Recovery Act (tracking hazardous waste)) - notification
EXETER COMMUNITY DAY (1107 ROCKY HILL DR. in EXETER, CA)
(National Center for Education Statistics) - STATE ID-5430319 Organizations: EXETER UNION HIGH (SCHOOL DISTRICT)
EXETER HIGH (820 SAN JUAN AVE. in EXETER, CA)
(National Center for Education Statistics) - STATE ID-5431598 Organizations: EXETER UNION HIGH (SCHOOL DISTRICT)
EXETER INDEPENDENT STUDY/ALTER. ED. (1107 E. ROCKY HILL DR. in EXETER, CA)
(National Center for Education Statistics) - STATE ID-5430087 Organizations: EXETER UNION HIGH (SCHOOL DISTRICT)
EXETER UNION COMMUNITY DAY (1107 EAST ROCKY HILL DRIVE in EXETER, CA)
(National Center for Education Statistics) - STATE ID-6118914 Organizations: EXETER UNION ELEMENTARY (SCHOOL DISTRICT)
KAWEAH HIGH (CONT.) (21215 AVE. 300 in EXETER, CA)
(National Center for Education Statistics) - STATE ID-5431614 Organizations: EXETER UNION HIGH (SCHOOL DISTRICT)
LINCOLN ELEMENTARY (333 SOUTH D ST. in EXETER, CA)
(National Center for Education Statistics) - STATE ID-6054043 Organizations: EXETER UNION ELEMENTARY (SCHOOL DISTRICT)
LINCOVE FIELD STATION (22963 CARSON AVENUE in EXETER, CA)
(Resource Conservation and Recovery Act (tracking hazardous waste))
EXETER UNION ELEMENTARY SD (233 E MAPLE ST in EXETER, CA)
COMPLIANCE ACTIVITY (Tracking inspections of insecticide, fungicide, and rodenticide, and toxic substances) Alternative names: EXETER UNION ELEMENTARY SCHOOL DISTRICT
EXETER CITY DUMP (19049 AVE 242 in EXETER, CA)
CRITERIA AND HAZARDOUS AIR POLLUTANT INVENTORY (Inventory of air pollution sources) Business SIC classification: REFUSE SYSTEMS Business NAICS classification: SOLID WASTE LANDFILL.
EXETER DEHYDRATOR INC (26783 ROAD 176 in EXETER, CA)
CRITERIA AND HAZARDOUS AIR POLLUTANT INVENTORY (Inventory of air pollution sources)
EXTER DISPOSAL SITE LANDFILL (4 MI S EXETER in EXETER, CA)
CRITERIA AND HAZARDOUS AIR POLLUTANT INVENTORY (Inventory of air pollution sources) Business SIC classification: REFUSE SYSTEMS Business NAICS classification: SOLID WASTE LANDFILL.
Housing units lacking complete plumbing facilities: 3.5% Housing units lacking complete kitchen facilities: 3.6%
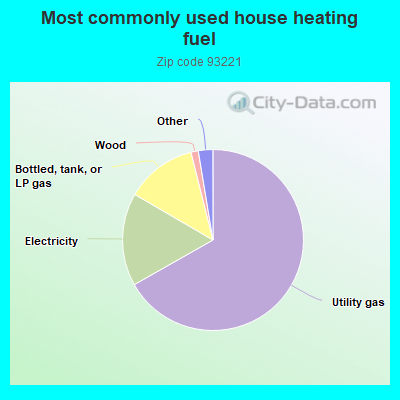
66.8%Utility gas
16.6%Electricity
12.7%Bottled, tank, or LP gas
1.3%Wood
1.0%Other fuel
0.9%Solar energy
0.6%No fuel used
Population in 1990: 11,088. Population change in the 1990s: +2,233 (+20.1%).
Place of birth for U.S.-born residents:
This state: 10,984
Northeast: 110
Midwest: 342
South: 597
West: 500
57% of the 93221 zip code residents lived in the same house 5 years ago. Out of people who lived in different houses, 77% lived in this county. Out of people who lived in different counties, 50% lived in California.
92% of the 93221 zip code residents lived in the same house 1 year ago. Out of people who lived in different houses, 79% moved from this county. Out of people who lived in different houses, 9% moved from different county within same state. Out of people who lived in different houses, 8% moved from different state. Out of people who lived in different houses, 1% moved from abroad.
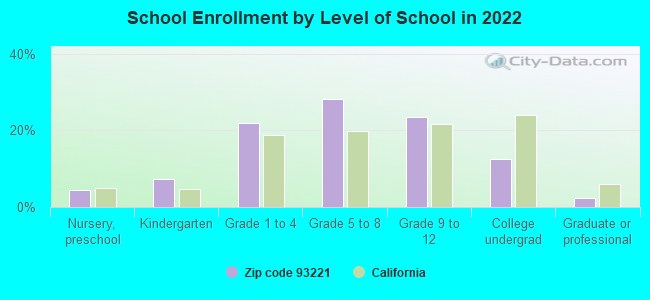
Private vs. public school enrollment:
Students in private schools in grades 1 to 8 (elementary and middle school): 124
Here:
6.4%
California:
10.5%
Students in private schools in grades 9 to 12 (high school): 8
Here:
1.0%
California:
8.5%
Students in private undergraduate colleges: 113
Here:
23.1%
California:
15.9%
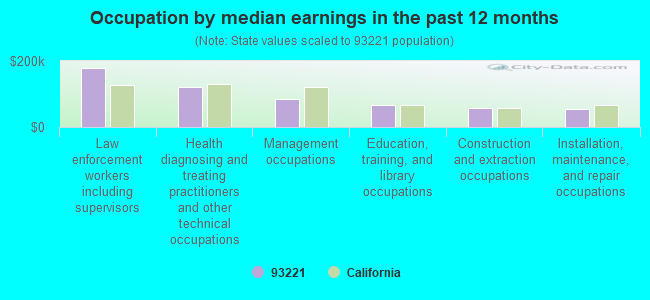
Occupation by median earnings in the past 12 months ($)
180,013Law enforcement workers including supervisors
122,645Health diagnosing and treating practitioners and other technical occupations
85,750Management occupations
66,343Education, training, and library occupations
58,747Construction and extraction occupations
55,798Installation, maintenance, and repair occupations
Companies with federal contracts located in this zip code:
HENDRIX, BONNIE D (429 W PINE ST in EXETER, CA; small business) : $179,373 in 19 contractsfrom 2002 to 2006
Contracts for Custodial Janitorial Services by Army, U.S. Army Corps of Engineers - civil program financing only Signed by year:2000: $0; 2001: $0; 2002: $34,963; 2003: $110,236; 2004: -$39,788; 2005: $74,322; 2006: -$360.
Biggest contracts:
$37,161 with Army for Custodial Janitorial Services. Signed on 2005-02-15. Completion date: 2005-09-30.
$37,161 with U.S. Army Corps of Engineers - civil program financing only for Custodial Janitorial Services. Signed on 2005-02-15. Completion date: 2005-09-30.
$34,963, same as above.Signed on 2002-11-08. Completion date: 2003-09-30.
$33,403 with Army for Custodial Janitorial Services. Signed on 2003-12-09. Completion date: 2003-09-30.
J R HALL (279 S CORNUCOPIA RD in EXETER, CA; small business) : $34,398 in 2 contractsin 2005
$17,199 with Army for Maintenance, Repair or Alteration of Real Property -- Other Non-Building Facilities. Signed on 2005-05-11. Completion date: 2005-07-11.
$17,199 with U.S. Army Corps of Engineers - civil program financing only for Maintenance, Repair or Alteration of Real Property -- Other Non-Building Facilities. Signed on 2005-05-11. Completion date: 2005-07-11.
Top industries in this zip code by the number of employees in 2005:
Administrative and Support and Waste Management and Remediation Services: Temporary Help Services (250-499 employees: 1 establishment)
Wholesale Trade: Fresh Fruit and Vegetable Merchant Wholesalers (100-249: 1, 50-99: 1)
2005 - 2018 National Fire Incident Reporting System (NFIRS) incidents
Based on the data from the years 2005 - 2018 the average number of fire incidents per year is 62. The highest number of fires - 138 took place in 2007, and the least - 18 in 2011. The data has a growing trend.
When looking into fire subcategories, the most reports belonged to: Outside Fires (50.9%), and Structure Fires (29.3%).
Fire incident types reported to NFIRS in Zip Code 93221


 Nearest zip codes: 93247, 93267, 93244, 93223, 93286, 93292.
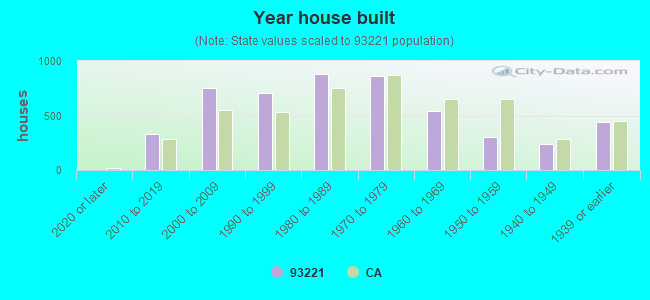


 Based on the data from the years 2005 - 2018 the average number of fire incidents per year is 62. The highest number of fires - 138 took place in 2007, and the least - 18 in 2011. The data has a growing trend.
 When looking into fire subcategories, the most reports belonged to: Outside Fires (50.9%), and Structure Fires (29.3%).