Estimated zip code population in 2022: 17,678 Zip code population in 2010: 17,423 Zip code population in 2000: 15,507
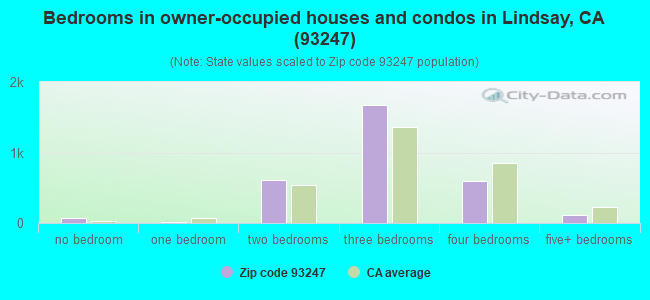
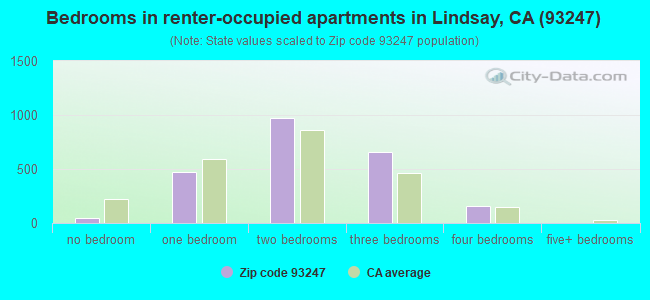
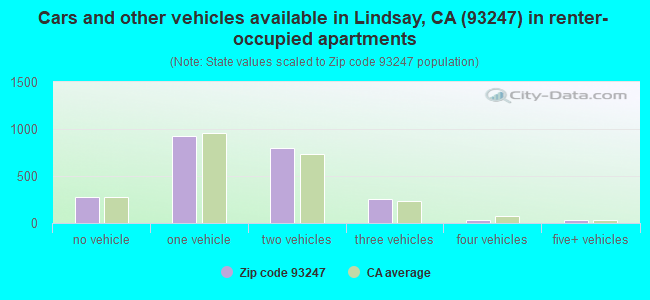
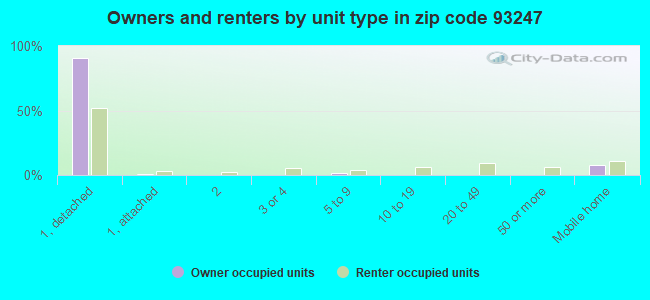
Houses and condos: 5,788 Renter-occupied apartments: 2,313
% of renters here:
43%
State:
44%
March 2022 cost of living index in zip code 93247: 88.9 (less than average, U.S. average is 100)
Land area: 75.7 sq. mi. Water area: 0.0 sq. mi.
Population density: 234 people per square mile
(very low).
OSM Map
General Map
Google Map
MSN Map
OSM Map
General Map
Google Map
MSN Map
OSM Map
General Map
Google Map
MSN Map
OSM Map
General Map
Google Map
MSN Map
Please wait while loading the map...
Real estate property taxes paid for housing units in 2022:
This zip code:
0.6% ($1,782)
California:
0.7% ($4,831)
Median real estate property taxes paid for housing units with mortgages in 2022: $2,092 (0.7%) Median real estate property taxes paid for housing units with no mortgage in 2022: $1,344 (0.6%)
Business Search- 14 Million verified businesses
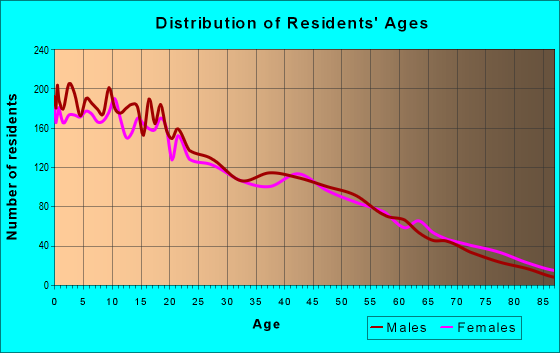
Males: 9,153
(51.8%)
Females: 8,525
(48.2%)
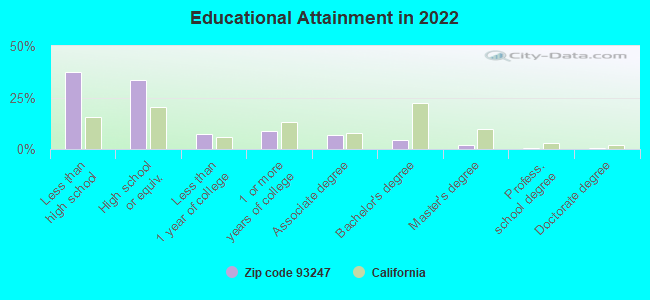
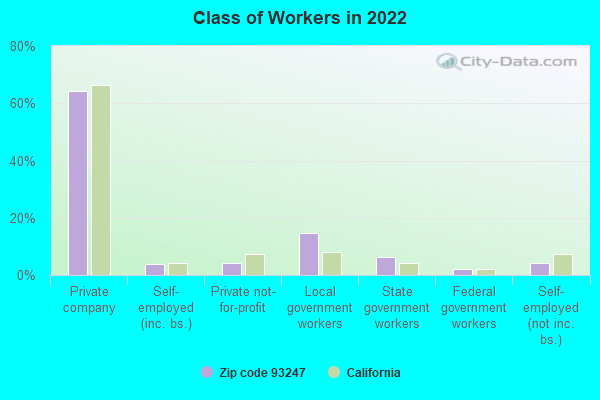
For population 25 years and over in 93247:
High school or higher: 61.7%
Bachelor's degree or higher: 6.7%
Graduate or professional degree: 2.5%
Unemployed: 14.9%
Mean travel time to work (commute): 27.9 minutes
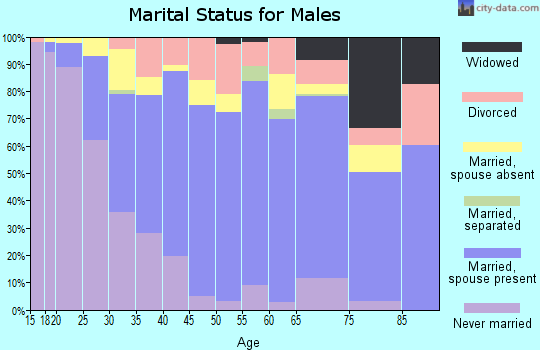
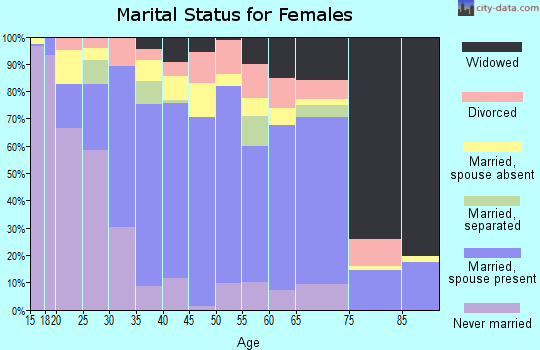
For population 15 years and over in 93247:
Never married: 36.8%
Now married: 45.6%
Separated: 3.9%
Widowed: 4.9%
Divorced: 8.8%
Zip code 93247 compared to state average:
Median household income below state average.
Median house value significantly below state average.
Unemployed percentage above state average.
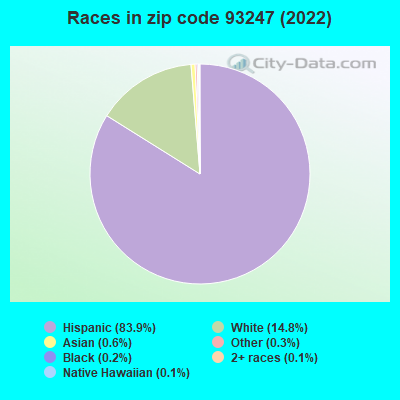
Black race population percentage significantly below state average.
Hispanic race population percentage above state average.
Median age below state average.
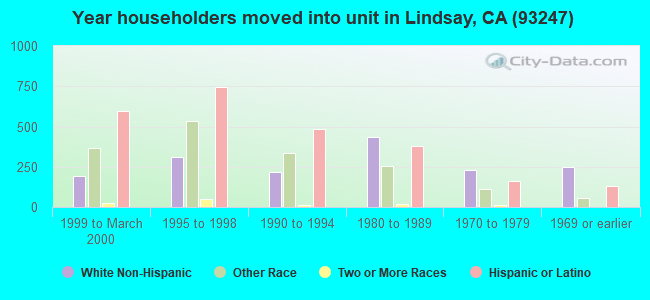
Length of stay since moving in significantly above state average.
Percentage of population with a bachelor's degree or higher significantly below state average.
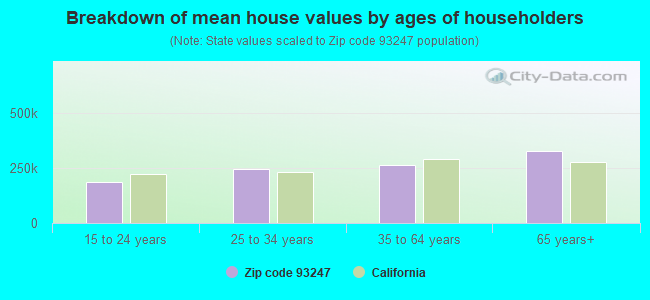
Estimated median house/condo value in 2022: $278,086
93247:
$278,086
California:
$715,900
According to our research of California and other state lists, there were 27 registered sex offenders living in 93247 zip code as of April 26, 2024. The ratio of all residents to sex offenders in zip code 93247 is 702 to 1. The ratio of registered sex offenders to all residents in this zip code is near the state average.
Median resident age:
This zip code:
31.3 years
California median age:
37.9 years
Average household size:
This zip code:
3.3 people
California:
2.8 people
Averages for the 2020 tax year for zip code 93247, filed in 2021:
Average Adjusted Gross Income (AGI) in 2020: $38,996 (Individual Income Tax Returns)
Here:
$38,996
State:
$95,910
Salary/wage: $31,997 (reported on 88.3% of returns)
Here:
$31,997
State:
$77,331
(% of AGI for various income ranges: 1626.7% for AGIs below $25k, 4393.4% for AGIs $25k-50k, 8066.9% for AGIs $50k-75k, 12028.3% for AGIs $75k-100k, 18695.3% for AGIs $100k-200k)
Taxable interest for individuals: $951 (reported on 17.8% of returns)
This zip code:
$951
California:
$2,294
(% of AGI for various income ranges: 3.8% for AGIs below $25k, 7.8% for AGIs $25k-50k, 17.6% for AGIs $50k-75k, 48.3% for AGIs $75k-100k, 118.0% for AGIs $100k-200k)
Ordinary dividends: $6,659 (reported on 3.6% of returns)
Here:
$6,659
State:
$10,949
(% of AGI for various income ranges: 3.7% for AGIs below $25k, 2.9% for AGIs $25k-50k, 18.7% for AGIs $50k-75k, 48.3% for AGIs $75k-100k, 506.7% for AGIs $100k-200k)
Net capital gain/loss in AGI: +$15,407 (reported on 3.9% of returns)
Here:
+$15,407
State:
+$49,306
(% of AGI for various income ranges: 3.3% for AGIs below $25k, 6.1% for AGIs $25k-50k, 33.5% for AGIs $50k-75k, 75.4% for AGIs $75k-100k, 940.0% for AGIs $100k-200k)
Profit/loss from business: +$13,505 (reported on 10.3% of returns)
Here:
+$13,505
State:
+$15,671
(% of AGI for various income ranges: 91.6% for AGIs below $25k, 160.4% for AGIs $25k-50k, 240.2% for AGIs $50k-75k, 512.9% for AGIs $75k-100k, 2365.3% for AGIs $100k-200k)
Taxable individual retirement arrangement distribution: $15,100 (reported on 2.0% of returns)
93247:
$15,100
California:
$23,505
(% of AGI for various income ranges: 7.6% for AGIs below $25k, 35.5% for AGIs $25k-50k, 93.3% for AGIs $75k-100k, 883.3% for AGIs $100k-200k)
Total itemized deductions: $28,805 (reported on 2.8% of returns)
Here:
$28,805
State:
$39,517
(% of AGI for various income ranges: 59.6% for AGIs $25k-50k, 198.5% for AGIs $50k-75k, 432.1% for AGIs $75k-100k, 1987.3% for AGIs $100k-200k)
Charity contributions: $9,171 (reported on 2.3% of returns)
Here:
$9,171
State:
$12,598
(% of AGI for various income ranges: 8.7% for AGIs $25k-50k, 31.9% for AGIs $50k-75k, 64.2% for AGIs $75k-100k, 728.7% for AGIs $100k-200k)
Taxes paid: $6,943 (reported on 2.8% of returns)
93247:
$6,943
State:
$8,807
(% of AGI for various income ranges: 11.2% for AGIs $25k-50k, 45.9% for AGIs $50k-75k, 118.8% for AGIs $75k-100k, 496.7% for AGIs $100k-200k)
Earned income credit: $2,665 (reported on 33.0% of returns)
Here:
$2,665
State:
$2,074
(% of AGI for various income ranges: 197.1% for AGIs below $25k, 175.5% for AGIs $25k-50k, 6.9% for AGIs $50k-75k)
Percentage of individuals using paid preparers for their 2020 taxes: 87.4%
Here:
87%
State:
92%
(% for various income ranges: 85.6% for AGIs below $25k, 87.7% for AGIs $25k-50k, 89.1% for AGIs $50k-75k, 90.5% for AGIs $75k-100k, 93.3% for AGIs $100k-200k, 85.7% for AGIs over 200k)
Averages for the 2012 tax year for zip code 93247, filed in 2013:
Average Adjusted Gross Income (AGI) in 2012: $31,496 (Individual Income Tax Returns)
Here:
$31,496
State:
$72,726
Salary/wage: $26,366 (reported on 90.3% of returns)
Here:
$26,366
State:
$59,079
(% of AGI for various income ranges: 79.5% for AGIs below $25k, 82.4% for AGIs $25k-50k, 80.0% for AGIs $50k-75k, 77.0% for AGIs $75k-100k, 67.7% for AGIs $100k-200k, 43.3% for AGIs over 200k)
Taxable interest for individuals: $852 (reported on 16.8% of returns)
This zip code:
$852
California:
$2,146
(% of AGI for various income ranges: 0.2% for AGIs below $25k, 0.1% for AGIs $25k-50k, 0.5% for AGIs $50k-75k, 0.3% for AGIs $75k-100k, 0.7% for AGIs $100k-200k, 1.9% for AGIs over 200k)
Ordinary dividends: $10,733 (reported on 4.4% of returns)
Here:
$10,733
State:
$9,308
(% of AGI for various income ranges: 0.2% for AGIs below $25k, 0.5% for AGIs $25k-50k, 0.3% for AGIs $50k-75k, 0.7% for AGIs $75k-100k, 1.7% for AGIs $100k-200k, 11.2% for AGIs over 200k)
Net capital gain/loss in AGI: +$4,491 (reported on 3.6% of returns)
Here:
+$4,491
State:
+$30,460
(% of AGI for various income ranges: 0.5% for AGIs $50k-75k, 0.5% for AGIs $75k-100k, 3.7% for AGIs $100k-200k)
Profit/loss from business: +$12,485 (reported on 10.9% of returns)
Here:
+$12,485
State:
+$17,064
(% of AGI for various income ranges: 6.0% for AGIs below $25k, 3.8% for AGIs $25k-50k, 3.7% for AGIs $50k-75k, 3.5% for AGIs $75k-100k, 6.4% for AGIs $100k-200k)
Taxable individual retirement arrangement distribution: $10,224 (reported on 2.8% of returns)
93247:
$10,224
California:
$19,557
(% of AGI for various income ranges: 0.6% for AGIs below $25k, 0.8% for AGIs $25k-50k, 1.0% for AGIs $50k-75k, 1.5% for AGIs $75k-100k, 2.0% for AGIs $100k-200k)
Total itemized deductions: $20,556 (25% of AGI, reported on 14.1% of returns)
Here:
$20,556
State:
$34,004
Here:
25.3% of AGI
State:
22.7% of AGI
(% of AGI for various income ranges: 2.7% for AGIs below $25k, 7.2% for AGIs $25k-50k, 13.2% for AGIs $50k-75k, 17.4% for AGIs $75k-100k, 18.1% for AGIs $100k-200k, 8.9% for AGIs over 200k)
Charity contributions: $2,974 (reported on 12.2% of returns)
Here:
$2,974
State:
$4,659
(% of AGI for various income ranges: 0.2% for AGIs below $25k, 0.8% for AGIs $25k-50k, 1.4% for AGIs $50k-75k, 2.3% for AGIs $75k-100k, 2.6% for AGIs $100k-200k, 1.7% for AGIs over 200k)
Taxes paid: $5,898 (reported on 14.0% of returns)
93247:
$5,898
State:
$14,448
(% of AGI for various income ranges: 0.5% for AGIs below $25k, 1.4% for AGIs $25k-50k, 2.9% for AGIs $50k-75k, 4.5% for AGIs $75k-100k, 6.1% for AGIs $100k-200k, 6.0% for AGIs over 200k)
Earned income credit: $2,831 (reported on 46.1% of returns)
Here:
$2,831
State:
$2,286
(% of AGI for various income ranges: 12.3% for AGIs below $25k, 3.2% for AGIs $25k-50k)
Percentage of individuals using paid preparers for their 2012 taxes: 66.8%
Here:
67%
State:
64%
(% for various income ranges: 63.9% for AGIs below $25k, 68.9% for AGIs $25k-50k, 71.4% for AGIs $50k-75k, 72.2% for AGIs $75k-100k, 83.3% for AGIs $100k-200k, 75.0% for AGIs over 200k)
Averages for the 2004 tax year for zip code 93247, filed in 2005:
Average Adjusted Gross Income (AGI) in 2004: $26,812 (Individual Income Tax Returns)
Here:
$26,812
State:
$58,600
Salary/wage: $24,140 (reported on 89.0% of returns)
Here:
$24,140
State:
$49,455
(% of AGI for various income ranges: 222.4% for AGIs below $10k, 81.8% for AGIs $10k-25k, 83.4% for AGIs $25k-50k, 81.5% for AGIs $50k-75k, 80.8% for AGIs $75k-100k, 53.9% for AGIs over 100k)
Taxable interest for individuals: $1,481 (reported on 23.4% of returns)
This zip code:
$1,481
California:
$2,365
(% of AGI for various income ranges: 6.9% for AGIs below $10k, 0.8% for AGIs $10k-25k, 1.1% for AGIs $25k-50k, 1.1% for AGIs $50k-75k, 1.3% for AGIs $75k-100k, 1.9% for AGIs over 100k)
Taxable dividends: $2,862 (reported on 7.9% of returns)
Here:
$2,862
State:
$4,746
(% of AGI for various income ranges: 3.1% for AGIs below $10k, 0.4% for AGIs $10k-25k, 0.5% for AGIs $25k-50k, 0.8% for AGIs $50k-75k, 0.7% for AGIs $75k-100k, 1.9% for AGIs over 100k)
Net capital gain/loss: +$8,203 (reported on 7.3% of returns)
Here:
+$8,203
State:
+$23,418
(% of AGI for various income ranges: 2.8% for AGIs below $10k, -0.2% for AGIs $10k-25k, 0.7% for AGIs $25k-50k, 2.0% for AGIs $50k-75k, 3.5% for AGIs $75k-100k, 8.0% for AGIs over 100k)
Profit/loss from business: +$11,122 (reported on 11.5% of returns)
Here:
+$11,122
State:
+$16,826
(% of AGI for various income ranges: 17.5% for AGIs below $10k, 4.8% for AGIs $10k-25k, 4.4% for AGIs $25k-50k, 3.8% for AGIs $50k-75k, 2.1% for AGIs $75k-100k, 6.4% for AGIs over 100k)
IRA payment deduction: $3,216 (reported on 1.0% of returns)
93247:
$3,216
California:
$3,192
Self-employed pension: $8,455 (reported on 0.2% of returns)
Here:
$8,455
California:
$17,688
Total itemized deductions: $17,762 (27% of AGI, reported on 16.5% of returns)
Here:
$17,762
State:
$28,113
Here:
27.4% of AGI
State:
25.3% of AGI
(% of AGI for various income ranges: 15.8% for AGIs below $10k, 4.7% for AGIs $10k-25k, 8.2% for AGIs $25k-50k, 16.2% for AGIs $50k-75k, 15.4% for AGIs $75k-100k, 16.5% for AGIs over 100k)
Charity contributions deductions: $3,004 (4% of AGI, reported on 14.6% of returns)
Here:
$3,004
State:
$3,923
Here:
4.5% of AGI
State:
3.3% of AGI
(% of AGI for various income ranges: 1.0% for AGIs below $10k, 0.5% for AGIs $10k-25k, 1.1% for AGIs $25k-50k, 2.2% for AGIs $50k-75k, 1.8% for AGIs $75k-100k, 3.6% for AGIs over 100k)
Total tax: $3,821 (reported on 48.9% of returns)
93247:
$3,821
State:
$10,761
(% of AGI for various income ranges: 5.8% for AGIs below $10k, 2.3% for AGIs $10k-25k, 4.4% for AGIs $25k-50k, 7.5% for AGIs $50k-75k, 9.7% for AGIs $75k-100k, 16.9% for AGIs over 100k)
Earned income credit: $2,226 (reported on 43.7% of returns)
Here:
$2,226
State:
$1,763
Percentage of individuals using paid preparers for their 2004 taxes: 62.3%
Here:
62%
State:
66%
(% for various income ranges: 57.6% for AGIs below $10k, 61.7% for AGIs $10k-25k, 63.1% for AGIs $25k-50k, 65.9% for AGIs $50k-75k, 74.5% for AGIs $75k-100k, 83.5% for AGIs over 100k)
Household received Food Stamps/SNAP in the past 12 months: 1,705 Household did not receive Food Stamps/SNAP in the past 12 months: 3,913
Women who had a birth in the past 12 months: 367 (247 now married, 120 unmarried) Women who did not have a birth in the past 12 months: 3,907 (1,633 now married, 2,270 unmarried)
Housing units in zip code 93247 with a mortgage: 1,867 (117 second mortgage, 26 both second mortgage and home equity loan) Median monthly owner costs for units with a mortgage: $1,456 Median monthly owner costs for units without a mortgage: $517
Residents with income below the poverty level in 2022:
This zip code:
32.2%
Whole state:
12.2%
Residents with income below 50% of the poverty level in 2022:
This zip code:
13.4%
Whole state:
6.2%
Median number of rooms in houses and condos:
Here:
5.7
State:
6.0
Median number of rooms in apartments:
Here:
4.1
State:
3.9
Notable locations in this zip code not listed on our city pages
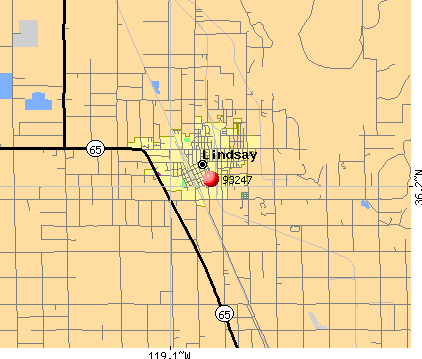
Notable locations in zip code 93247: Rocky Hill School (A), Pacheco and Fagundes Dairy (B), Hilarides Dairy (C), Lindsay Golf Course (D), Tulare County Fire Department Battalion 1 Lindsay Fire Station 15 (E), Lindsay-Strathmore Building (F), Lindsay Unified School District Office (G), Lindsay City Hall (H), Lindsay Branch Tulare County Library (I), Lindsay Fire Department (J). Display/hide their locations on the map
Churches in zip code 93247 include: Church of the Brethren (A), Apostolic Assembly of God Church (B), Church of Jesus Christ (C), First Assembly of God Church (D), First Baptist Church of Lindsay (E), First Church of Christ Scientist (F), First Church of the Nazarene (G), First Presbyterian Church (H), Foursquare Gospel Church (I). Display/hide their locations on the map
In group quarters: 93 (-1 institutionalized population)
Size of family households: 1,021 2-persons, 730 3-persons, 948 4-persons, 764 5-persons, 364 6-persons, 196 7-or-more-persons
Size of nonfamily households: 1,083 1-person, 257 2-persons
3,416 married couples with children.
1,087 single-parent households (226 men, 861 women).
29.4% of residents of 93247 zip code speak English at home.
70.0% of residents speak Spanish at home (49% very well, 20% well, 14% not well, 17% not at all).
0.5% of residents speak Asian or Pacific Island language at home (19% very well, 74% not well, 7% not at all).
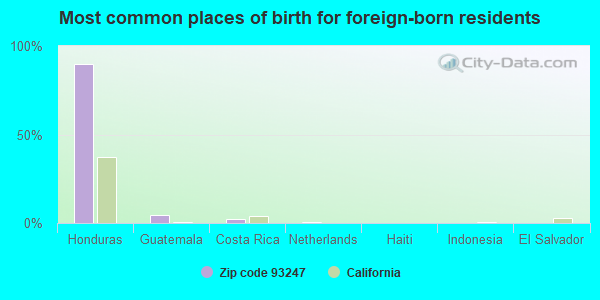
Foreign born population: 5,642 (31.9%) (39.7% of them are naturalized citizens)
This zip code:
31.9%
Whole state:
26.7%
90%Honduras
4%Guatemala
2%Costa Rica
0%Netherlands
0%Haiti
0%Indonesia
0%El Salvador
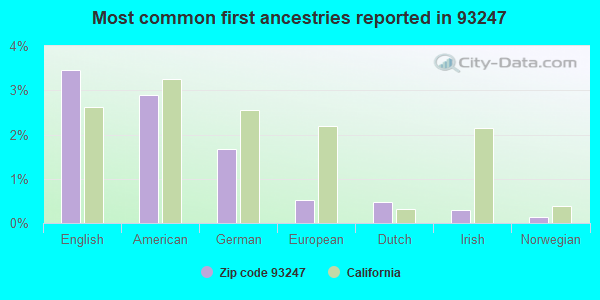
3%English
3%American
2%German
1%European
0%Dutch
0%Irish
0%Norwegian
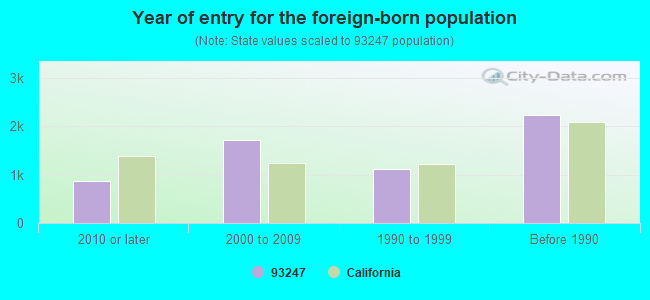
Year of entry for the foreign-born population
8802010 or later
1,7152000 to 2009
1,1201990 to 1999
2,238Before 1990
Major facilities with environmental interests located in this zip code:
GENERAL CABLE CORPORATION (851 N. HARVARD AVE. in LINDSAY, CA)
STATE MASTER (California - Hazardous Waste Tracking) - HAZARDOU WASTE PROGRAM Small Quantity Generators, between 100 kg and 1000 kg of hazardous waste/month (Resource Conservation and Recovery Act (tracking hazardous waste)) - notification (Resource Conservation and Recovery Act (tracking hazardous waste)) TRI REPORTER (Tracking of toxic chemicals releasing facilities) Business SIC classification: DRAWING AND INSULATING OF NONFERROUS WIRE Organizations: GK TECHNOLOGIES INC (CONTACT/OWNER)
, NATIONAL DIVERSIFIED SALES INC (CONTACT/OWNER)
Alternative names: NATIONAL DIVERSIFIED SALES INC
FMC CORP (22700 RD 196 in LINDSAY, CA)
STATE MASTER (California - Hazardous Waste Tracking) - HAZARDOU WASTE PROGRAM CRITERIA AND HAZARDOUS AIR POLLUTANT INVENTORY (Inventory of air pollution sources) Small Quantity Generators, between 100 kg and 1000 kg of hazardous waste/month (Resource Conservation and Recovery Act (tracking hazardous waste)) - notification Business SIC classification: MANUFACTURING INDUSTRIES Organizations: RICHARD L HOUTZER (CONTACT/OWNER)
Alternative names: F M C TECHNOLOGIES INC, FMC TECHNOLOGIES, INC
HELENA CHEMICAL COMPANY (25114 ROAD 204 in LINDSAY, CA)
STATE MASTER (California - Hazardous Waste Tracking) - HAZARDOU WASTE PROGRAM Small Quantity Generators, between 100 kg and 1000 kg of hazardous waste/month (Resource Conservation and Recovery Act (tracking hazardous waste)) Organizations: MR. STEVEN KING (CONTACT/OWNER)
LEFFINGWELL AG SALES (942 E HONOLULU in LINDSAY, CA)
FORMAL ENFORCEMENT ACTION (Integrated Compliance Information System) - ICIS-09-2005-0215, ENFORCEMENT/COMPLIANCE ACTIVITY COMPLIANCE ACTIVITY (Tracking inspections of insecticide, fungicide, and rodenticide, and toxic substances)
MIKE BUTLERS GARAGE (301 W HERMOSA ST in LINDSAY, CA)
STATE MASTER (California - Hazardous Waste Tracking) - HAZARDOU WASTE PROGRAM Small Quantity Generators, between 100 kg and 1000 kg of hazardous waste/month (Resource Conservation and Recovery Act (tracking hazardous waste)) - notification Business NAICS classification: GENERAL AUTOMOTIVE REPAIR. Organizations: MIKE BUTTLER (CONTACT/OWNER)
GARVEY (STEVE) JUNIOR HIGH (340 N. HARVARD AVE. in LINDSAY, CA)
(National Center for Education Statistics) - STATE ID-6060313 Organizations: LINDSAY UNIFIED (SCHOOL DISTRICT)
JEFFERSON ELEMENTARY (333 WESTWOOD in LINDSAY, CA)
(National Center for Education Statistics) - STATE ID-6054142 Organizations: LINDSAY UNIFIED (SCHOOL DISTRICT)
LINCOLN ELEMENTARY (851 N. STANFORD in LINDSAY, CA)
(National Center for Education Statistics) - STATE ID-6107262 Organizations: LINDSAY UNIFIED (SCHOOL DISTRICT)
LINDSAY COMMUNITY DAY (519 E. HONOLULU ST. in LINDSAY, CA)
(National Center for Education Statistics) - STATE ID-5430236 Organizations: LINDSAY UNIFIED (SCHOOL DISTRICT)
LINDSAY SENIOR HIGH (1701 E. TULARE ROAD in LINDSAY, CA)
(National Center for Education Statistics) - STATE ID-5432414 Organizations: LINDSAY UNIFIED (SCHOOL DISTRICT)
CAIRNS (JOHN J.) CONTINUATION HIGH (519 E. HONOLULU ST. in LINDSAY, CA)
(National Center for Education Statistics) - STATE ID-5430194 Organizations: LINDSAY UNIFIED (SCHOOL DISTRICT)
LINDSAY OLIVE GROWERS (650 W. TULARE RD. in LINDSAY, CA)
(Resource Conservation and Recovery Act (tracking hazardous waste)) TRI REPORTER (Tracking of toxic chemicals releasing facilities) Business SIC classification: CANNED FRUITS, VEGETABLES, PRESERVES, JAMS, AND JELLIES Organizations: LINSDAY OLIVE GROWERS (CONTACT/OWNER)
A & W TRANSPORTATION (24017 RD 196 in LINDSAY, CA)
Small Quantity Generators, between 100 kg and 1000 kg of hazardous waste/month (Resource Conservation and Recovery Act (tracking hazardous waste)) - notification Organizations: WAYNE HOUSE (CONTACT/OWNER)
Housing units lacking complete plumbing facilities: 0.9% Housing units lacking complete kitchen facilities: 1.3%
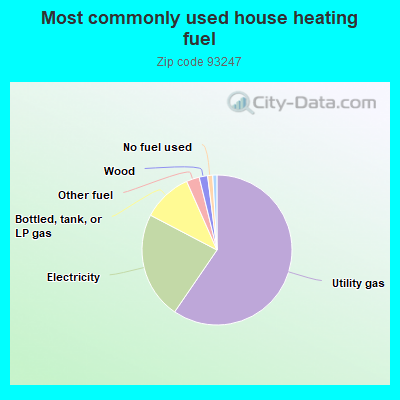
59.5%Utility gas
23.1%Electricity
10.7%Bottled, tank, or LP gas
2.8%Other fuel
1.8%Wood
1.1%No fuel used
0.9%Fuel oil, kerosene, etc.
Population in 1990: 12,983. Population change in the 1990s: +2,524 (+19.4%).
Place of birth for U.S.-born residents:
This state: 10,517
Northeast: 30
Midwest: 214
South: 522
West: 406
60% of the 93247 zip code residents lived in the same house 5 years ago. Out of people who lived in different houses, 80% lived in this county. Out of people who lived in different counties, 50% lived in California.
89% of the 93247 zip code residents lived in the same house 1 year ago. Out of people who lived in different houses, 55% moved from this county. Out of people who lived in different houses, 14% moved from different county within same state. Out of people who lived in different houses, 0% moved from different state. Out of people who lived in different houses, 35% moved from abroad.
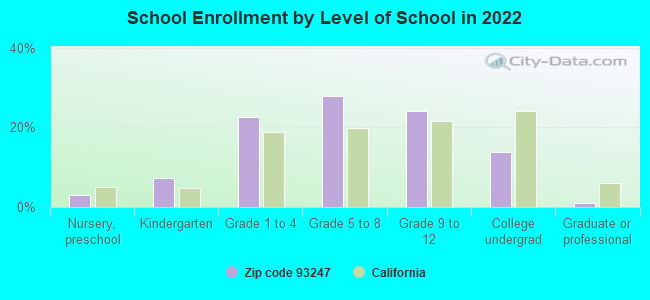
Private vs. public school enrollment:
Students in private schools in grades 1 to 8 (elementary and middle school): 109
Here:
4.4%
California:
10.5%
Students in private schools in grades 9 to 12 (high school): 9
Here:
0.8%
California:
8.5%
Students in private undergraduate colleges: 85
Here:
12.5%
California:
15.9%
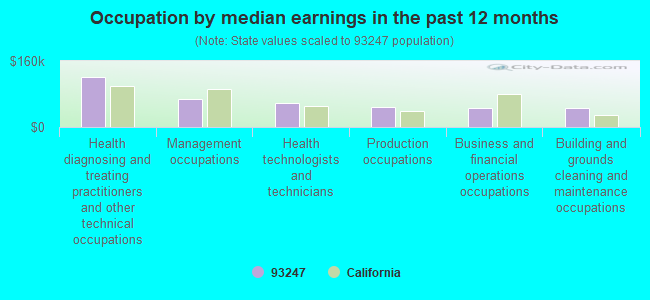
Occupation by median earnings in the past 12 months ($)
121,759Health diagnosing and treating practitioners and other technical occupations
68,035Management occupations
58,479Health technologists and technicians
49,526Production occupations
45,727Business and financial operations occupations
45,511Building and grounds cleaning and maintenance occupations
Companies with federal contracts located in this zip code:
UNIVERSAL STEEL BUILDERS (21967 AVENUE 208 in LINDSAY, CA; small business) : $393,728 in 4 contractsfrom 1999 to 2001
$248,195 with Navy for Non-nuclear Ship Repair (West) Ship repair (including overhauls and conversions) performed on. non-nuclear propelled and nonpropelled ships west of the 108th meridian. Signed on 2000-07-11. Completion date: 2000-10-20.
$82,347, same as above.Signed on 2000-05-26. Completion date: 2000-05-30.
$31,906, same as above.Signed on 2001-01-10. Completion date: 2001-02-16.
$31,280, same as above.Signed on 1999-10-08. Completion date: 1999-10-29.
BLUE, VAHNN (265 LINDERO AVE in LINDSAY, CA)
$8,550 with U.S. Army Corps of Engineers - civil program financing only for Construction of Structures and Facilities -- Miscellaneous Buildings. Signed on 2002-09-25. Completion date: 2002-10-15.
Top industries in this zip code by the number of employees in 2005:
Wholesale Trade: Fresh Fruit and Vegetable Merchant Wholesalers (250-499 employees: 1 establishment, 10-19 employees: 1 establishment, 1-4 employees: 2 establishments)
Health Care and Social Assistance: Nursing Care Facilities (100-249: 1)
2005 - 2018 National Fire Incident Reporting System (NFIRS) incidents
Based on the data from the years 2005 - 2018 the average number of fires per year is 40. The highest number of fires - 83 took place in 2005, and the least - 9 in 2012. The data has a decreasing trend.
When looking into fire subcategories, the most incidents belonged to: Outside Fires (52.9%), and Mobile Property/Vehicle Fires (22.3%).
Fire incident types reported to NFIRS in Zip Code 93247


 Nearest zip codes: 93267, 93221, 93223, 93258, 93292, 93235.
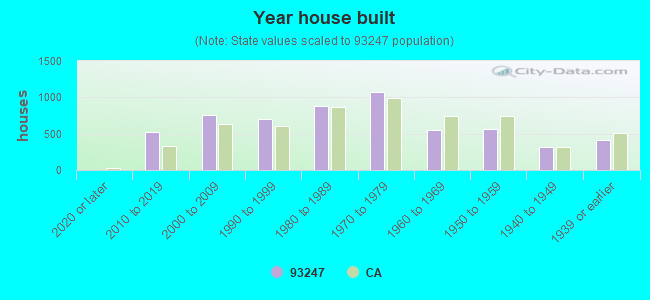


 Based on the data from the years 2005 - 2018 the average number of fires per year is 40. The highest number of fires - 83 took place in 2005, and the least - 9 in 2012. The data has a decreasing trend.
 When looking into fire subcategories, the most incidents belonged to: Outside Fires (52.9%), and Mobile Property/Vehicle Fires (22.3%).