Garland: Fire Incidents, Utah (UT)
Where are fire incidents reported in Garland, UT
Something went wrong! Please refresh the page.
|
| |||||||||||||||||||||||||||||||||||||||||||||||||||||||||||||||||||||||||||||||||||||||||||||||||||||||||||||
2002 - 2018 National Fire Incident Reporting System (NFIRS) incidents
- Incident types reported to NFIRS in Garland, UT
- 50963.0%Rescue & EMS
- 11714.5%Fire
- 688.4%Good Intent Call
- 637.8%Hazardous Condition
- 243.0%Service Call
- 232.8%False Alarm
- 40.5%Severe Weather
- Fire incident types reported to NFIRS in Garland, UT
- 5143.6%Outside Fires
- 4135.0%Structure Fires
- 1714.5%Mobile Property/Vehicle Fires
- 86.8%Other
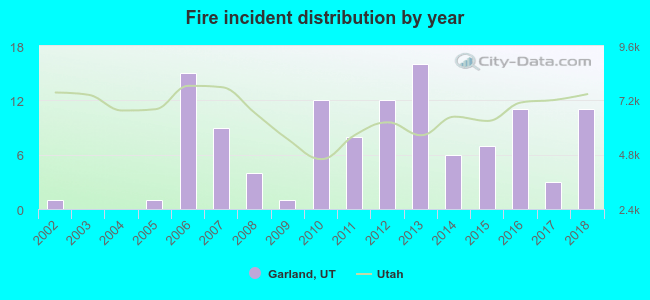 According to the data from the years 2002 - 2018 the average number of fire incidents per year is 7. The highest number of reported fires - 16 took place in 2013, and the least - 0 in 2003. The data has a growing trend.
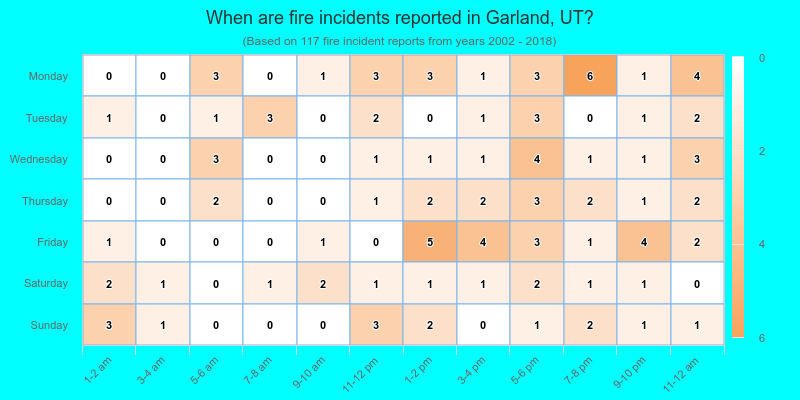
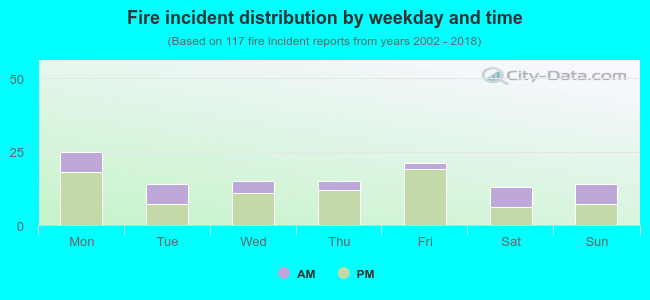 31.6% incidents where reported in the morning and 68.4% in the evening. The most fires (21.4%) took place on Monday, and the least (11.1%) on Saturday.
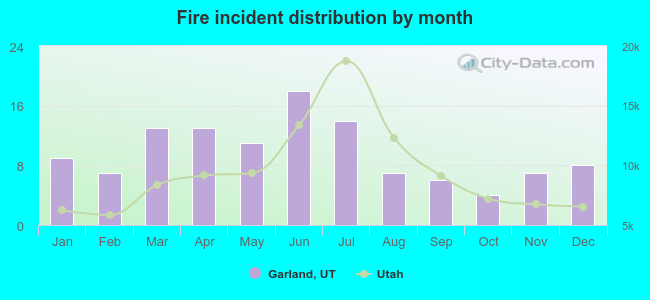 According to the 117 fire incidents from years 2002 - 2018 most fires (15.4%) took place during June, and the least (3.4%) in October.
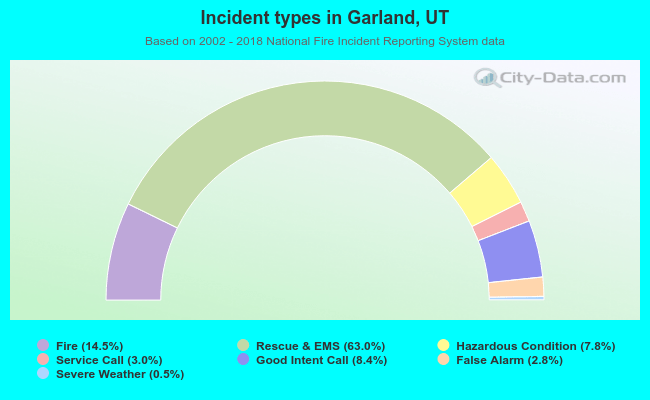 Out of all 808 cases reported during the years 2002 - 2018, the most belonged to the categories: Overpressure Rupture (63.0%), Fire (14.5%), and Service Call (8.4%).
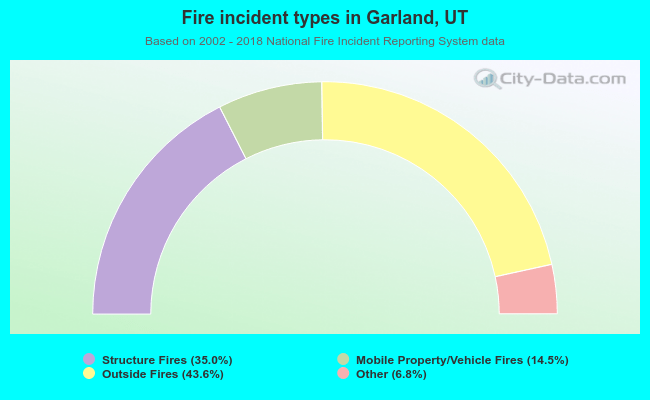 When looking into fire subcategories, the most incidents belonged to: Outside Fires (43.6%), and Structure Fires (35.0%).