Gatlinburg: Fire Incidents, Tennessee (TN)
Where are fire incidents reported in Gatlinburg, TN
Something went wrong! Please refresh the page.
| Fire incidents reported | |
|---|---|
| Sreet name | Count |
| PARKWAY (DOWNTOWN) RD | 222 |
| PARKWAY (CITY-HWY 321) RD | 196 |
| SKI MOUNTAIN RD | 68 |
| PARKWAY | 66 |
| RIVER RD | 54 |
| HISTORIC NATURE TRL | 52 |
| CAMPBELL LEAD RD | 50 |
| PARKWAYDOWNTOWN RD | 34 |
| SKI VIEW DR | 32 |
| VILLAGE LOOP RD | 28 |
| BIRDS CREEK RD | 26 |
| CAMPBELL LEAD RD | 26 |
| CHEROKEE ORCHARD RD | 26 |
| EAST PARKWAY | 26 |
| WILEY OAKLEY DR | 26 |
| SKI MTN RD 426 | 22 |
| BASKINS CREEK RD | 20 |
| BOOGERTOWN RD | 20 |
| JOHNS BRANCH RD | 20 |
| POWDERMILL RD | 20 |
| FOOTHILLS DR | 18 |
| GRASSY BRANCH RD | 18 |
| PARKWAY (NEWFOUND GAP) RD | 18 |
| PARKWAY TER | 18 |
| REAGAN DR | 18 |
| BEECH BRANCH RD | 16 |
| BRUCE RD | 16 |
| GLADES RD | 16 |
| HIDDEN HILLS RD | 16 |
| PARKWAY (SPUR) RD | 16 |
| Other | 1,861 |
2002 - 2018 National Fire Incident Reporting System (NFIRS) incidents
- Incident types reported to NFIRS in Gatlinburg, TN
- 5,13546.8%Rescue & EMS
- 3,06527.9%Fire
- 1,0109.2%False Alarm
- 8287.5%Hazardous Condition
- 4854.4%Good Intent Call
- 3453.1%Service Call
- 430.4%Special Incident
- 420.4%Severe Weather
- 180.2%Overpressure Rupture
- Fire incident types reported to NFIRS in Gatlinburg, TN
- 2,21572.3%Structure Fires
- 60819.8%Outside Fires
- 1795.8%Mobile Property/Vehicle Fires
- 632.1%Other
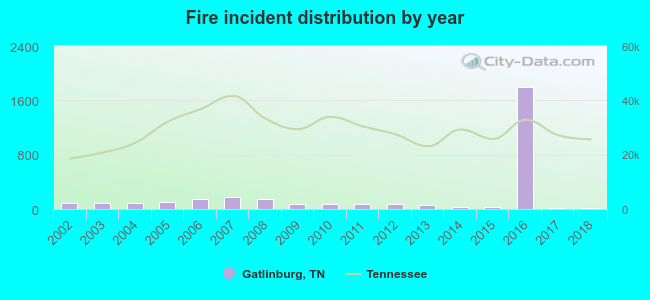 According to the data from the years 2002 - 2018 the average number of fire incidents per year is 180. The highest number of fire incidents - 1,795 took place in 2016, and the least - 16 in 2017. The data has a dropping trend.
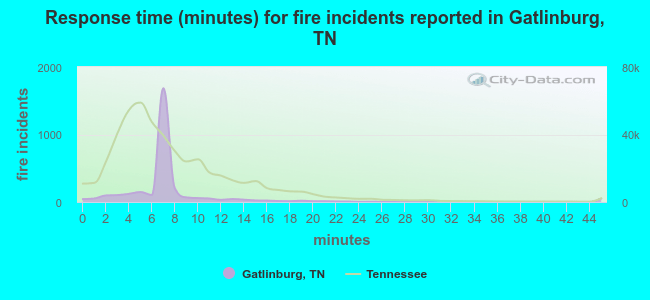 The median response time based on all reported fire incidents is 7 minutes. This is comparable to the state median value.
The median response time in Gatlinburg, TN compared to nearest cities:
(Note: Based on data for all years, including only cities with at least 500 fire incidents)
| Gatlinburg: | 7 minutes |
| Pigeon Forge: | 8 minutes |
| Sevierville: | 13 minutes |
| Seymour: | 8 minutes |
| Cherokee: | 5 minutes |
| Bryson City: | 9 minutes |
| Dandridge: | 10 minutes |
| Newport: | 7 minutes |
| New Market: | 6 minutes |
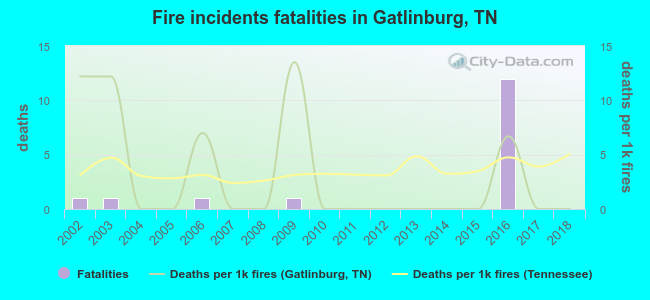 Based on the data from the years 2002 - 2018 the average number of fire-related yearly deaths is 1. The highest number of reported deaths - 12 took place in 2016, and the lowest - 0 in 2004. The data has a decreasing trend.
The average number of deaths per 1,000 fire incidents is 3. This indicator was the highest - 14 in 2009, and the lowest 0 in 2004. The trend for deaths per 1,000 fires is declining. Compared to the state value the number of deaths per 1,000 fire incidents is higher.
Based on the data from the years 2002 - 2018 the average number of fire-related yearly deaths is 1. The highest number of reported deaths - 12 took place in 2016, and the lowest - 0 in 2004. The data has a decreasing trend.
The average number of deaths per 1,000 fire incidents is 3. This indicator was the highest - 14 in 2009, and the lowest 0 in 2004. The trend for deaths per 1,000 fires is declining. Compared to the state value the number of deaths per 1,000 fire incidents is higher.Deaths per 1,000 incidents in Gatlinburg, TN compared to nearest cities:
(Note: Based on data for all years, including only cities with at least 2,500 fire incidents)
| Gatlinburg: | 5.2 |
| Sevierville: | 2.7 |
| Maryville: | 2.8 |
| Knoxville: | 2.1 |
| Morristown: | 4.3 |
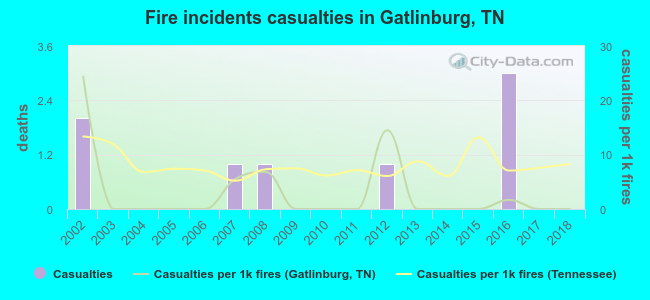 According to the data from the years 2002 - 2018 the average number of fire-related casualties per year is 0. The highest number of reported casualties - 3 took place in 2016, and the lowest - 0 in 2003. The data has a dropping trend.
The average number of injuries per 1,000 fires is 3. This indicator was the highest - 24 in 2002, and the lowest 0 in 2003. The trend for injuries per 1,000 fires is declining. Compared to the state value the number of casualties per 1,000 fire incidents is much lower.
According to the data from the years 2002 - 2018 the average number of fire-related casualties per year is 0. The highest number of reported casualties - 3 took place in 2016, and the lowest - 0 in 2003. The data has a dropping trend.
The average number of injuries per 1,000 fires is 3. This indicator was the highest - 24 in 2002, and the lowest 0 in 2003. The trend for injuries per 1,000 fires is declining. Compared to the state value the number of casualties per 1,000 fire incidents is much lower.Casualties per 1,000 incidents in Gatlinburg, TN compared to nearest cities:
(Note: Based on data for all years, including only cities with at least 500 fire incidents)
| Gatlinburg: | 2.6 |
| Pigeon Forge: | 6.8 |
| Sevierville: | 2.2 |
| Seymour: | 10.4 |
| Cherokee: | 1.1 |
| Bryson City: | 8.6 |
| Dandridge: | 3.3 |
| Newport: | 0.4 |
| New Market: | 19.9 |
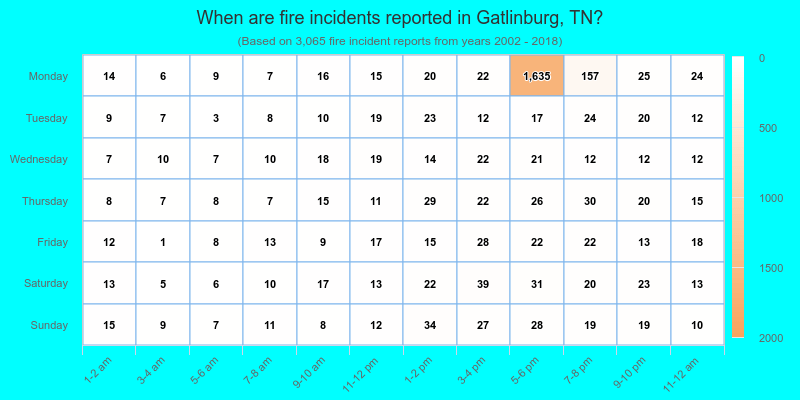
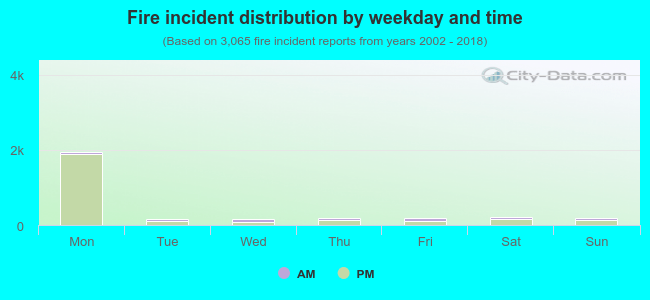 14.2% incidents where reported in the morning and 85.8% in the evening. The most fires (63.6%) took place on Monday, and the least (5.4%) on Tuesday.
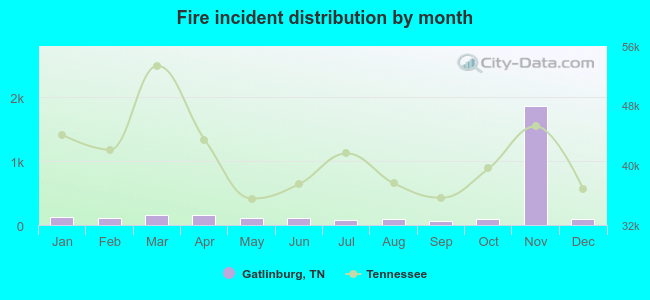 According to the 3,065 incident reports from years 2002 - 2018 most fires (61.0%) took place during November, and the least (2.2%) in September.
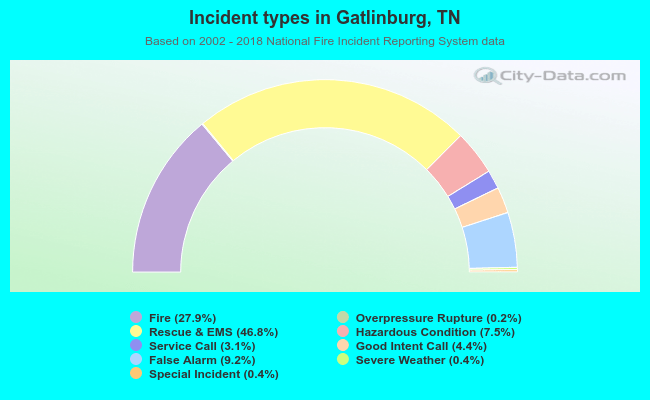 Out of all 10,971 cases reported during the years 2002 - 2018, the most belonged to the categories: Rescue & EMS (46.8%), Fire (27.9%), and False Alarm (9.2%).
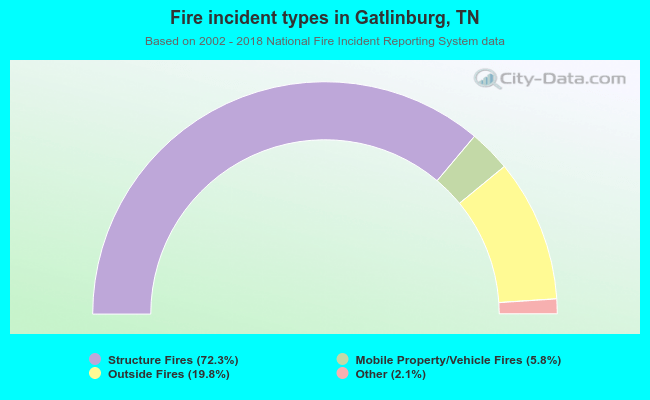 When looking into fire subcategories, the most incidents belonged to: Structure Fires (72.3%), and Outside Fires (19.8%).