Pigeon Forge: Fire Incidents, Tennessee (TN)
Where are fire incidents reported in Pigeon Forge, TN
Something went wrong! Please refresh the page.
| Fire incidents reported | |
|---|---|
| Sreet name | Count |
| PARKWAY | 414 |
| WEARS VALLEY RD | 82 |
| RIDGE RD | 60 |
| TEASTER LN | 38 |
| VETERANS BLVD | 36 |
| DOLLYWOOD LN | 34 |
| PINE MOUNTAIN RD | 28 |
| EAGLE CLOUD WAY | 26 |
| KING BRANCH RD | 26 |
| UPPER MIDDLE CREEK RD | 26 |
| BIRD NEST WAY | 24 |
| HICKORY DR | 22 |
| AUTUMN PATH WAY | 20 |
| MILL CREEK RD | 20 |
| RIVER RD | 20 |
| BIRD NEST | 16 |
| BLACK BEAR CUB WAY | 16 |
| BLACKBERRY RIDGE WAY | 16 |
| CLINTWOOD WAY | 16 |
| JAYELL RD | 14 |
| DOLLYWOOD PARKS BLVD | 12 |
| JESS WILSON RD | 12 |
| PINE KNOB RD | 12 |
| SEQUOIA RD | 12 |
| SKI VIEW LN | 12 |
| SUGAR HOLLOW RD | 12 |
| TEASTER LANE | 12 |
| WALKER TR | 12 |
| AUTUMN PATH | 10 |
| BLACK BEAR CUB | 10 |
| Other | 114 |
2004 - 2018 National Fire Incident Reporting System (NFIRS) incidents
- Incident types reported to NFIRS in Pigeon Forge, TN
- 4,86349.3%Rescue & EMS
- 1,18412.0%Fire
- 1,08311.0%Good Intent Call
- 99010.0%False Alarm
- 9199.3%Service Call
- 7968.1%Hazardous Condition
- 120.1%Severe Weather
- 100.1%Special Incident
- Fire incident types reported to NFIRS in Pigeon Forge, TN
- 55146.5%Outside Fires
- 42135.6%Structure Fires
- 19316.3%Mobile Property/Vehicle Fires
- 191.6%Other
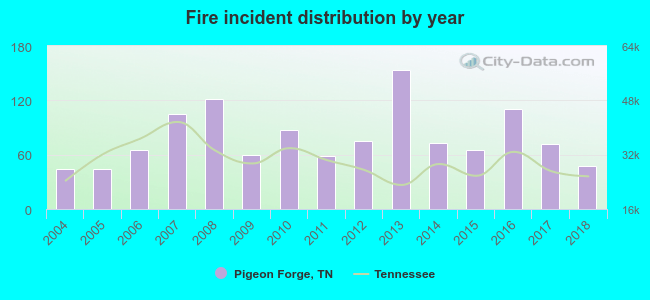 Based on the data from the years 2004 - 2018 the average number of fires per year is 79. The highest number of fire incidents - 154 took place in 2013, and the least - 44 in 2004. The data has an increasing trend.
The average number of yearly fire incidents per 10k residents in Pigeon Forge, TN compared to nearest cities:
(Note: Based on data for the last 3 years, including only cities with population 5,000 and above)
| Pigeon Forge: | 125.0 |
| Sevierville: | 183.4 |
| Seymour: | 67.2 |
| Strawberry Plains: | 29.7 |
| Jefferson City: | 55.4 |
| Alcoa: | 64.4 |
| Maryville: | 76.7 |
| Newport: | 185.1 |
| Knoxville: | 70.0 |
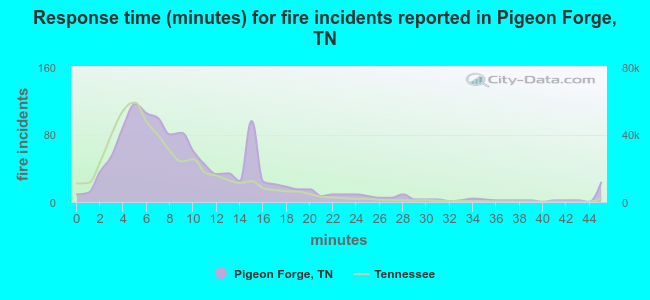 The median response time based on all reported fire incidents is 8 minutes. This is higher compared to the state median value.
The median response time in Pigeon Forge, TN compared to nearest cities:
(Note: Based on data for all years, including only cities with at least 500 fire incidents)
| Pigeon Forge: | 8 minutes |
| Sevierville: | 13 minutes |
| Gatlinburg: | 7 minutes |
| Seymour: | 8 minutes |
| Dandridge: | 10 minutes |
| New Market: | 6 minutes |
| Jefferson City: | 5 minutes |
| Alcoa: | 4 minutes |
| Maryville: | 6 minutes |
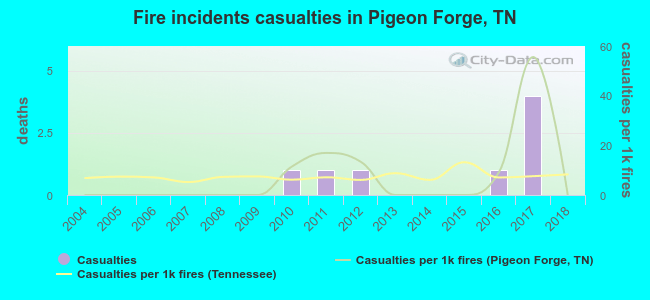 Based on the data from the years 2004 - 2018 the average number of fire-related yearly casualties is 1. The highest number of reported injuries - 4 took place in 2017, and the lowest - 0 in 2004. The data has a constant trend.
The average number of casualties per 1,000 fire incidents is 7. This indicator was the highest - 56 in 2017, and the lowest 0 in 2004. The trend for casualties per 1,000 incidents is constant. Compared to the state value the number of injuries per 1,000 incidents is about the same.
Based on the data from the years 2004 - 2018 the average number of fire-related yearly casualties is 1. The highest number of reported injuries - 4 took place in 2017, and the lowest - 0 in 2004. The data has a constant trend.
The average number of casualties per 1,000 fire incidents is 7. This indicator was the highest - 56 in 2017, and the lowest 0 in 2004. The trend for casualties per 1,000 incidents is constant. Compared to the state value the number of injuries per 1,000 incidents is about the same.Casualties per 1,000 incidents in Pigeon Forge, TN compared to nearest cities:
(Note: Based on data for all years, including only cities with at least 500 fire incidents)
| Pigeon Forge: | 6.8 |
| Sevierville: | 2.2 |
| Gatlinburg: | 2.6 |
| Seymour: | 10.4 |
| Dandridge: | 3.3 |
| New Market: | 19.9 |
| Jefferson City: | 4.5 |
| Alcoa: | 3.9 |
| Maryville: | 56.1 |
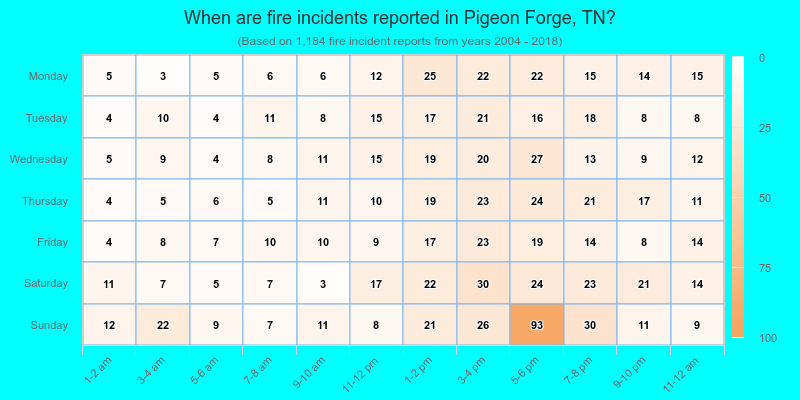
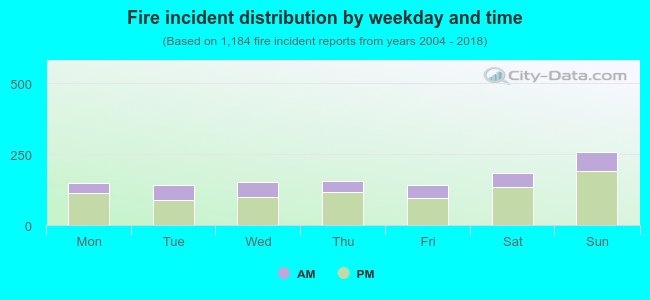 29.5% incidents where reported in the morning and 70.5% in the evening. The most fires (21.9%) took place on Sunday, and the least (11.8%) on Tuesday.
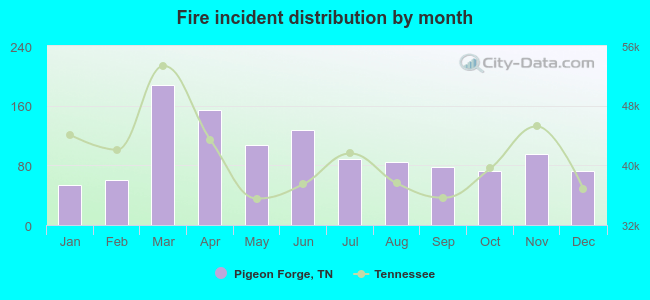 Based on the 1,184 fires from years 2004 - 2018 most fires (15.9%) took place during March, and the least (4.6%) in January.
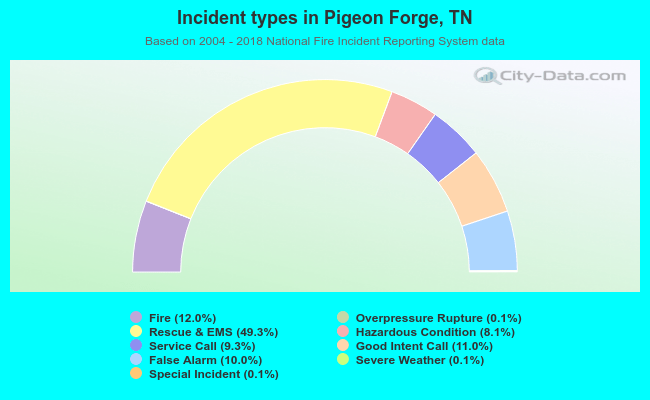 Out of all 9,862 cases reported during the years 2004 - 2018, the most belonged to the categories: Rescue & EMS (49.3%), Fire (12.0%), and Good Intent Call (11.0%).
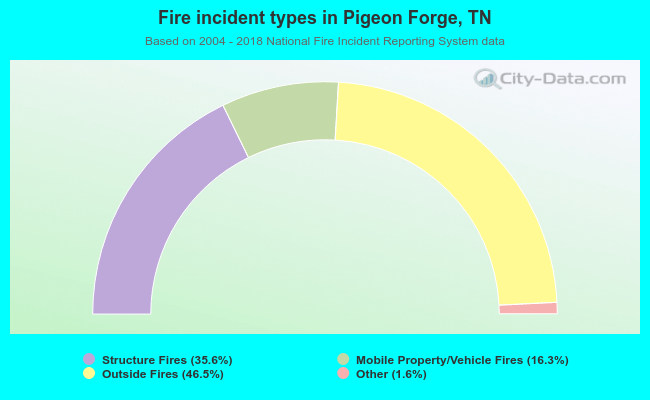 When looking into fire subcategories, the most incidents belonged to: Outside Fires (46.5%), and Structure Fires (35.6%).