Glen Ridge: Fire Incidents, New Jersey (NJ)
Where are fire incidents reported in Glen Ridge, NJ
Something went wrong! Please refresh the page.
|
| |||||||||||||||||||||||||||||||||||||||||||||||||||||||||||||||||||||||||||||||||||||||||||||||||||||||||||||
2004 - 2018 National Fire Incident Reporting System (NFIRS) incidents
- Incident types reported to NFIRS in Glen Ridge, NJ
- 48034.2%Hazardous Condition
- 45932.7%False Alarm
- 22416.0%Fire
- 14810.5%Service Call
- 483.4%Good Intent Call
- 312.2%Rescue & EMS
- 110.8%Overpressure Rupture
- 30.2%Severe Weather
- Fire incident types reported to NFIRS in Glen Ridge, NJ
- 14665.2%Structure Fires
- 6127.2%Outside Fires
- 125.4%Mobile Property/Vehicle Fires
- 52.2%Other
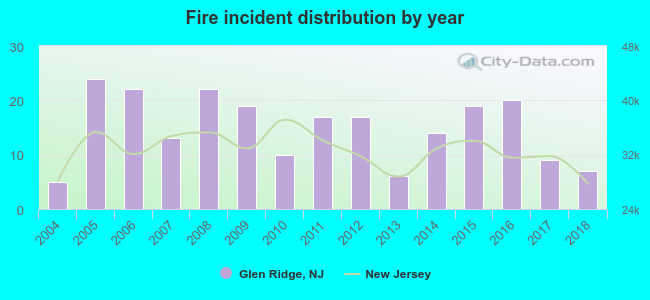 According to the data from the years 2004 - 2018 the average number of fires per year is 15. The highest number of fire incidents - 24 took place in 2005, and the least - 5 in 2004. The data has a rising trend.
The average number of yearly fire incidents per 10k residents in Glen Ridge, NJ compared to nearest cities:
(Note: Based on data for the last 3 years, including only cities with population 5,000 and above)
| Glen Ridge: | 15.6 |
| Bloomfield: | 31.3 |
| Montclair: | 14.4 |
| Belleville: | 25.0 |
| Nutley: | 44.0 |
| East Orange: | 48.4 |
| Verona: | 1.9 |
| Upper Montclair: | 11.2 |
| West Orange: | 32.6 |
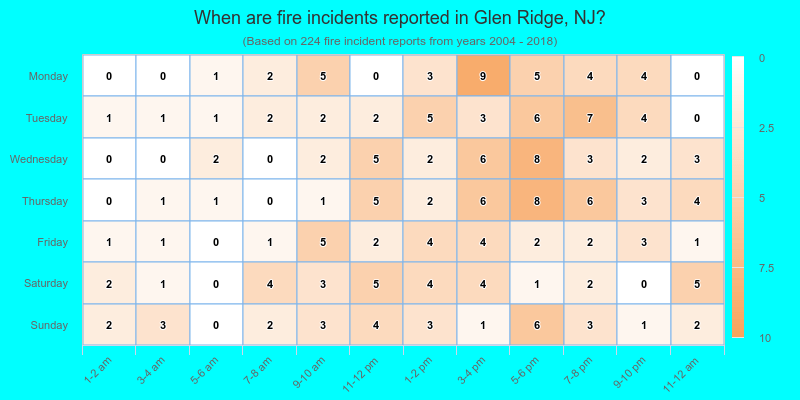
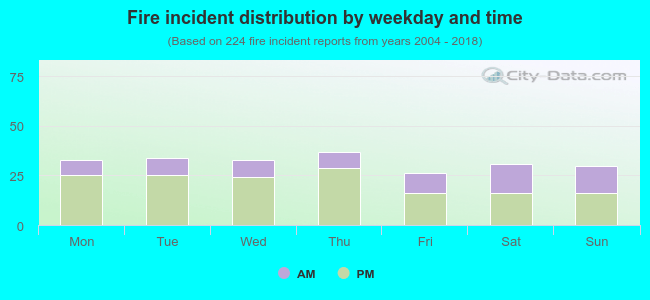 32.6% incidents where reported in the morning and 67.4% in the evening. The most fires (16.5%) took place on Thursday, and the least (11.6%) on Friday.
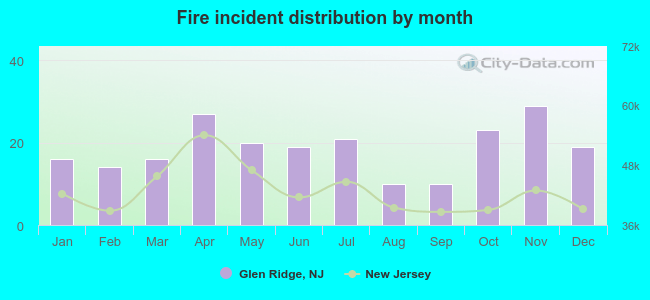 Based on the 224 fires from years 2004 - 2018 most fires (12.9%) took place during November, and the least (4.5%) in August.
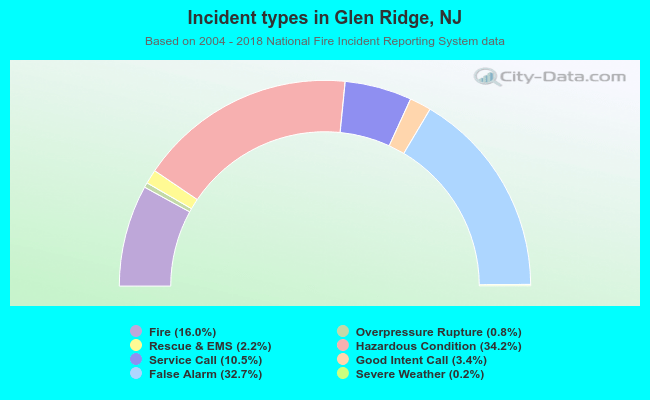 Out of all 1,404 cases reported during the years 2004 - 2018, the most belonged to the categories: Hazardous Condition (34.2%), False Alarm (32.7%), and Fire (16.0%).
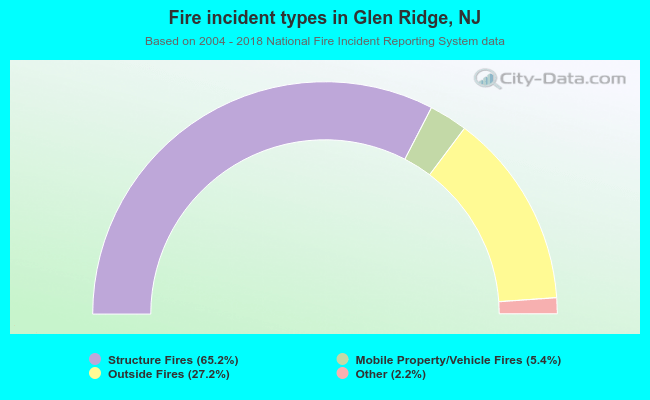 When looking into fire subcategories, the most incidents belonged to: Structure Fires (65.2%), and Outside Fires (27.2%).