Montclair: Fire Incidents, New Jersey (NJ)
Where are fire incidents reported in Montclair, NJ
Something went wrong! Please refresh the page.
| Fire incidents reported | |
|---|---|
| Sreet name | Count |
| GLENRIDGE AVE | 326 |
| BLOOMFIELD AVE | 188 |
| MAPLE AVE | 90 |
| CLAREMONT AVE | 88 |
| ORANGE RD | 82 |
| PINE ST | 80 |
| S PARK ST | 80 |
| WALNUT ST | 68 |
| PARK ST | 64 |
| N FULLERTON AVE | 62 |
| FOREST ST | 54 |
| VALLEY RD | 52 |
| UPPER MOUNTAIN AVE | 46 |
| CEDAR AVE | 42 |
| GROVE ST | 42 |
| MIDLAND AVE | 42 |
| ELM ST | 40 |
| N MOUNTAIN AVE | 40 |
| GATES AVE | 38 |
| GREENWOOD AVE | 38 |
| LACKAWANNA PLZ | 38 |
| CHURCH ST | 36 |
| HIGHLAND AVE | 32 |
| GLENRIDGE AVE | 30 |
| UNION ST | 30 |
| MISSION ST | 28 |
| BLOOMFIELD AVE | 26 |
| CHRISTOPHER ST | 24 |
| ORANGE RD | 24 |
| CENTRAL AVE | 22 |
2004 - 2018 National Fire Incident Reporting System (NFIRS) incidents
- Incident types reported to NFIRS in Montclair, NJ
- 3,54841.6%Hazardous Condition
- 1,60918.9%False Alarm
- 1,56718.4%Fire
- 1,21914.3%Service Call
- 3113.6%Good Intent Call
- 1672.0%Rescue & EMS
- 480.6%Overpressure Rupture
- 300.4%Severe Weather
- 280.3%Special Incident
- Fire incident types reported to NFIRS in Montclair, NJ
- 1,03866.2%Structure Fires
- 37123.7%Outside Fires
- 1278.1%Mobile Property/Vehicle Fires
- 312.0%Other
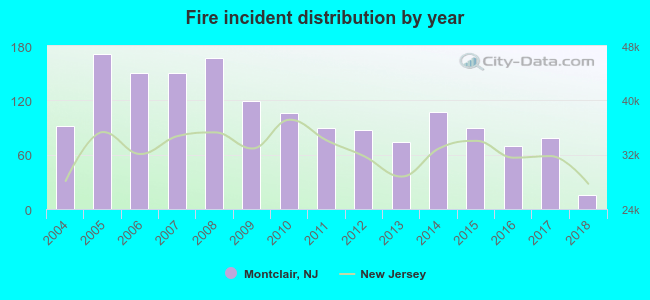 According to the data from the years 2004 - 2018 the average number of fire incidents per year is 104. The highest number of fire incidents - 171 took place in 2005, and the least - 15 in 2018. The data has a dropping trend.
The average number of yearly fire incidents per 10k residents in Montclair, NJ compared to nearest cities:
(Note: Based on data for the last 3 years, including only cities with population 5,000 and above)
| Montclair: | 14.4 |
| Glen Ridge: | 15.6 |
| Verona: | 1.9 |
| Upper Montclair: | 11.2 |
| Bloomfield: | 31.3 |
| Cedar Grove: | 13.1 |
| Nutley: | 44.0 |
| West Orange: | 32.6 |
| Belleville: | 25.0 |
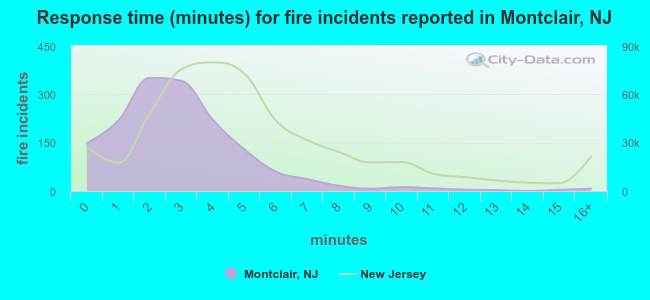 The median response time based on all reported fire incidents is 3 minutes. This is lower than the New Jersey median value.
The median response time in Montclair, NJ compared to nearest cities:
(Note: Based on data for all years, including only cities with at least 500 fire incidents)
| Montclair: | 3 minutes |
| Bloomfield: | 2 minutes |
| Nutley: | 2 minutes |
| West Orange: | 5 minutes |
| Belleville: | 3 minutes |
| East Orange: | 4 minutes |
| Orange: | 3 minutes |
| Little Falls: | 4 minutes |
| Clifton: | 5 minutes |
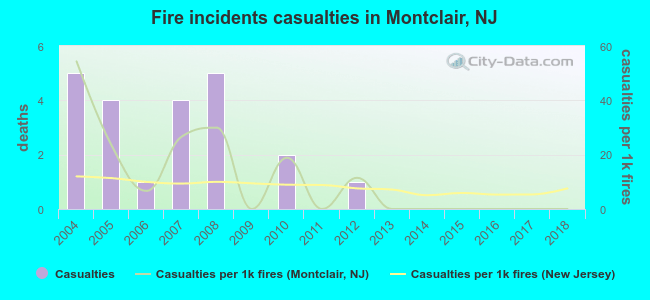 According to the reports from the years 2004 - 2018 the average number of fire-related casualties per year is 1. The highest number of injuries - 5 took place in 2004, and the lowest - 0 in 2009. The data has a decreasing trend.
The average number of casualties per 1,000 fires is 11. This indicator was the highest - 54 in 2004, and the lowest 0 in 2009. The trend for casualties per 1,000 incidents is declining. Compared to the state value the number of injuries per 1,000 incidents is higher.
According to the reports from the years 2004 - 2018 the average number of fire-related casualties per year is 1. The highest number of injuries - 5 took place in 2004, and the lowest - 0 in 2009. The data has a decreasing trend.
The average number of casualties per 1,000 fires is 11. This indicator was the highest - 54 in 2004, and the lowest 0 in 2009. The trend for casualties per 1,000 incidents is declining. Compared to the state value the number of injuries per 1,000 incidents is higher.Casualties per 1,000 incidents in Montclair, NJ compared to nearest cities:
(Note: Based on data for all years, including only cities with at least 500 fire incidents)
| Montclair: | 14.0 |
| Bloomfield: | 9.9 |
| Nutley: | 10.7 |
| West Orange: | 10.1 |
| Belleville: | 10.2 |
| East Orange: | 10.9 |
| Orange: | 6.0 |
| Little Falls: | 2.0 |
| Clifton: | 13.0 |
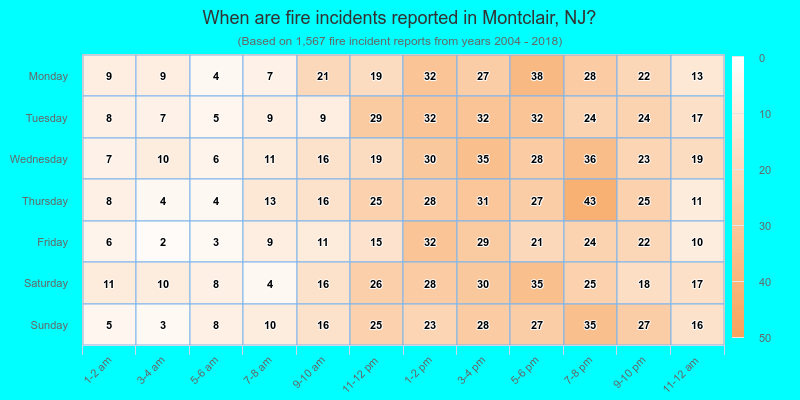
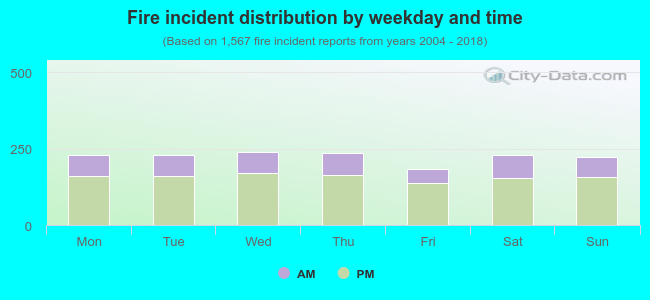 29.5% incidents where reported in the morning and 70.5% in the evening. The most fires (15.3%) took place on Wednesday, and the least (11.7%) on Friday.
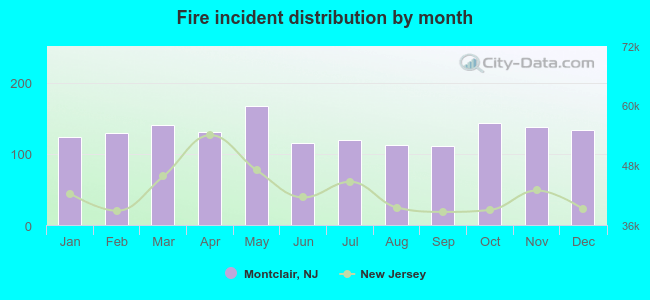 According to the 1,567 fires from years 2004 - 2018 most fires (10.7%) took place during May, and the least (7.1%) in September.
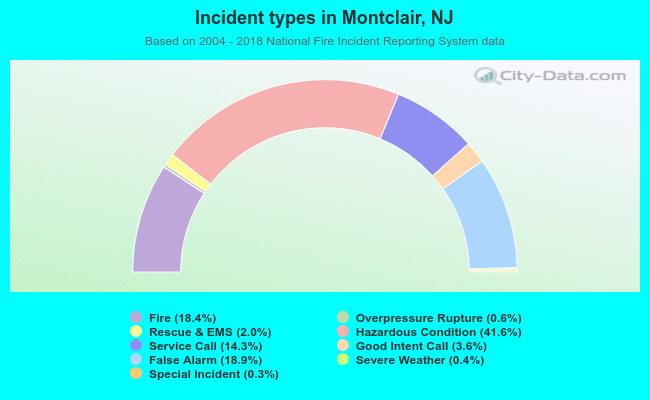 Out of all 8,527 cases reported during the years 2004 - 2018, the most belonged to the categories: Hazardous Condition (41.6%), False Alarm (18.9%), and Fire (18.4%).
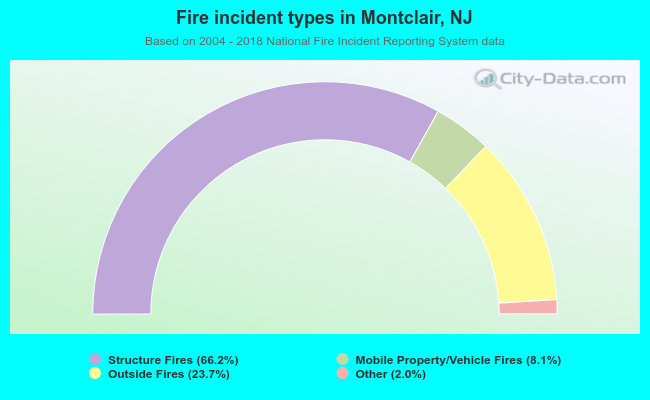 When looking into fire subcategories, the most incidents belonged to: Structure Fires (66.2%), and Outside Fires (23.7%).