Glencoe: Fire Incidents, Minnesota (MN)
Where are fire incidents reported in Glencoe, MN
Something went wrong! Please refresh the page.
|
| |||||||||||||||||||||||||||||||||||||||||||||||||||||||||||||||||||||||||||||||||||||||||||||||||||||||||||||
2002 - 2018 National Fire Incident Reporting System (NFIRS) incidents
- Incident types reported to NFIRS in Glencoe, MN
- 37536.9%Fire
- 21120.8%Hazardous Condition
- 14214.0%Rescue & EMS
- 14113.9%False Alarm
- 868.5%Good Intent Call
- 383.7%Service Call
- 171.7%Severe Weather
- 30.3%Special Incident
- 20.2%Overpressure Rupture
- Fire incident types reported to NFIRS in Glencoe, MN
- 17245.9%Structure Fires
- 12834.1%Outside Fires
- 6717.9%Mobile Property/Vehicle Fires
- 82.1%Other
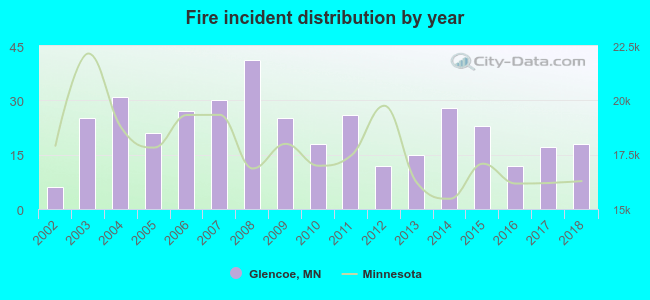 Based on the data from the years 2002 - 2018 the average number of fires per year is 22. The highest number of reported fires - 41 took place in 2008, and the least - 6 in 2002. The data has a rising trend.
The average number of yearly fire incidents per 10k residents in Glencoe, MN compared to nearest cities:
(Note: Based on data for the last 3 years, including only cities with population 5,000 and above)
| Glencoe: | 28.4 |
| Hutchinson: | 41.1 |
| Waconia: | 17.6 |
| Belle Plaine: | 25.6 |
| Minnetrista: | 20.3 |
| Victoria: | 14.3 |
| Delano: | 28.9 |
| Jordan: | 35.7 |
| Mound: | 25.8 |
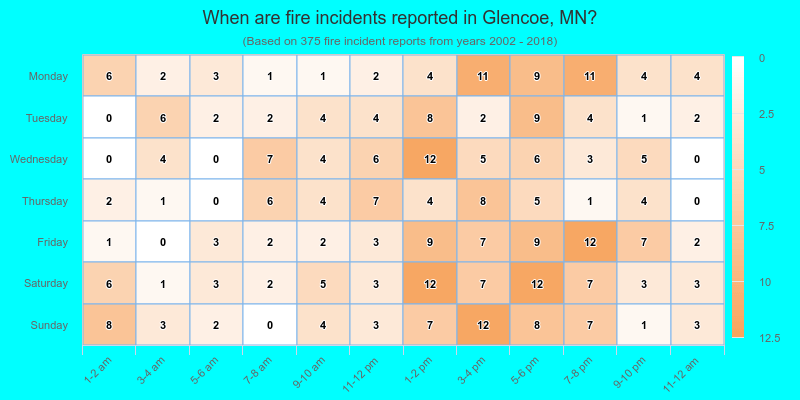
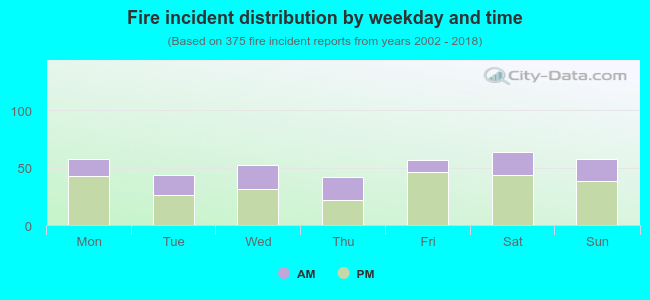 33.3% incidents where reported in the morning and 66.7% in the evening. The most fires (17.1%) took place on Saturday, and the least (11.2%) on Thursday.
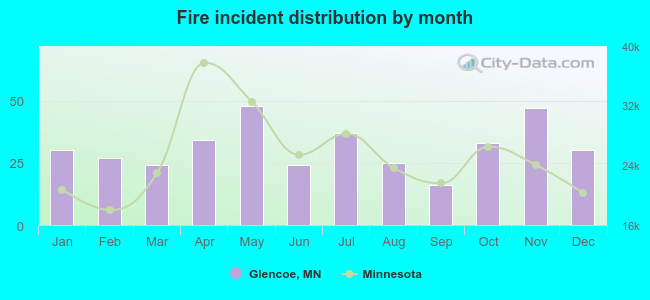 Based on the 375 fire incident reports from years 2002 - 2018 most fires (12.8%) took place during May, and the least (4.3%) in September.
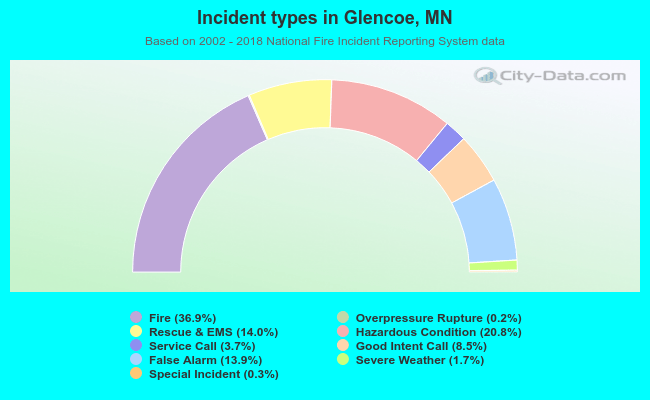 Out of all 1,015 cases reported during the years 2002 - 2018, the most belonged to the categories: Fire (36.9%), Hazardous Condition (20.8%), and Rescue & EMS (14.0%).
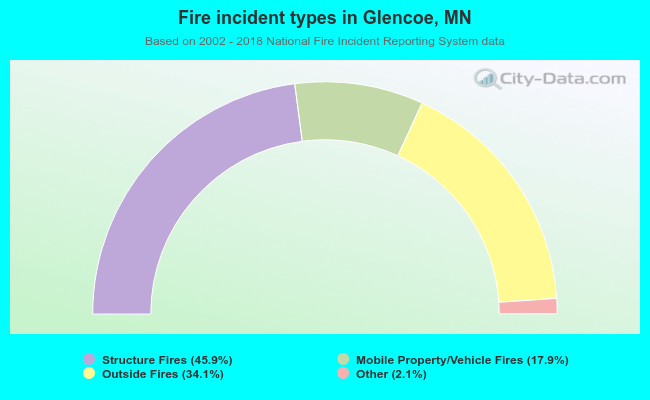 When looking into fire subcategories, the most reports belonged to: Structure Fires (45.9%), and Outside Fires (34.1%).