Minnetrista: Fire Incidents, Minnesota (MN)
Where are fire incidents reported in Minnetrista, MN
Something went wrong! Please refresh the page.
|
| |||||||||||||||||||||||||||||||||||||||||||||||||||||||||||||||||||||||||||||||||||||||||||||||||||||||||||||
2002 - 2018 National Fire Incident Reporting System (NFIRS) incidents
- Incident types reported to NFIRS in Minnetrista, MN
- 32324.4%Rescue & EMS
- 31323.7%Hazardous Condition
- 26219.8%Fire
- 23717.9%Good Intent Call
- 14410.9%False Alarm
- 362.7%Service Call
- 60.5%Overpressure Rupture
- Fire incident types reported to NFIRS in Minnetrista, MN
- 12848.9%Structure Fires
- 9134.7%Outside Fires
- 238.8%Mobile Property/Vehicle Fires
- 207.6%Other
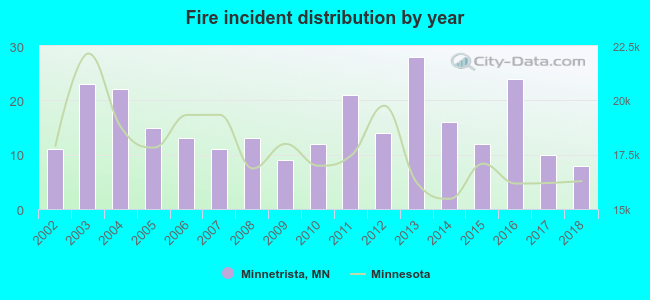 Based on the data from the years 2002 - 2018 the average number of fires per year is 15. The highest number of fires - 28 took place in 2013, and the least - 8 in 2018. The data has a declining trend.
The average number of yearly fire incidents per 10k residents in Minnetrista, MN compared to nearest cities:
(Note: Based on data for the last 3 years, including only cities with population 5,000 and above)
| Minnetrista: | 20.3 |
| Mound: | 25.8 |
| Victoria: | 14.3 |
| Orono: | 19.0 |
| Shorewood: | 10.6 |
| Waconia: | 17.6 |
| Chanhassen: | 11.3 |
| Delano: | 28.9 |
| Chaska: | 13.6 |
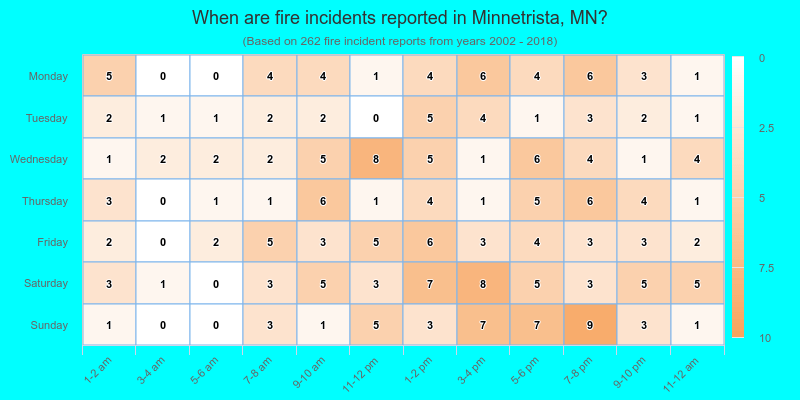
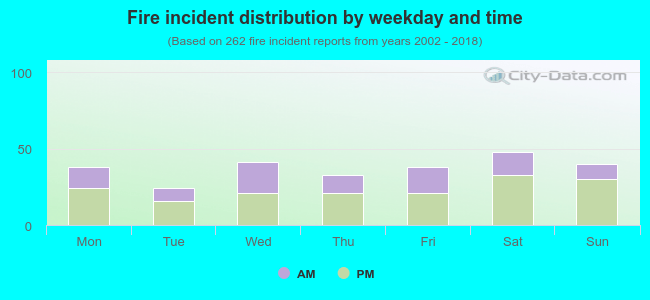 36.6% incidents where reported in the morning and 63.4% in the evening. The most fires (18.3%) took place on Saturday, and the least (9.2%) on Tuesday.
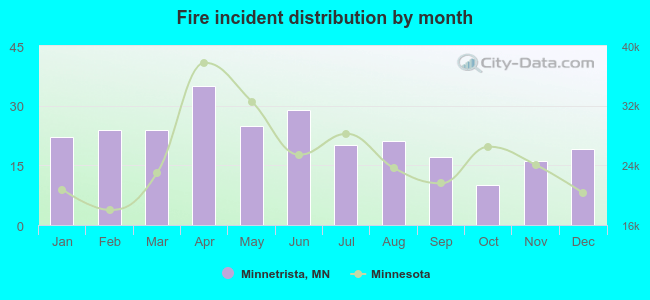 According to the 262 fire incidents from years 2002 - 2018 most fires (13.4%) took place during April, and the least (3.8%) in October.
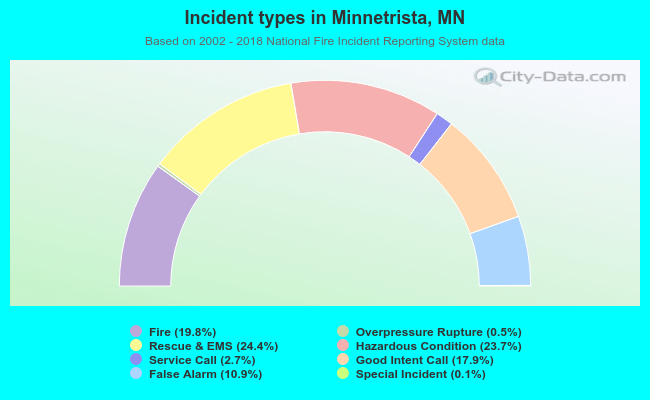 Out of all 1,322 cases reported during the years 2002 - 2018, the most belonged to the categories: Rescue & EMS (24.4%), Hazardous Condition (23.7%), and Fire (19.8%).
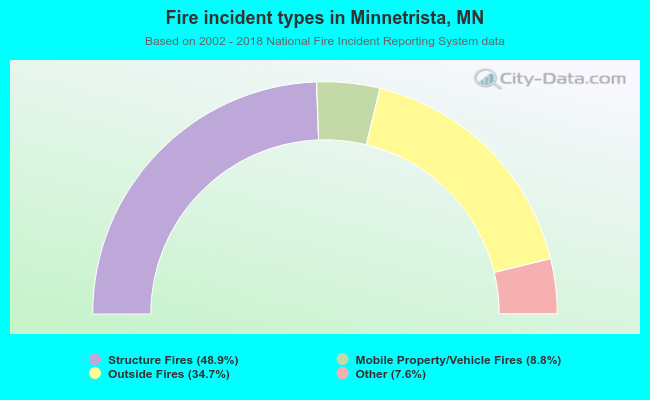 When looking into fire subcategories, the most incidents belonged to: Structure Fires (48.9%), and Outside Fires (34.7%).