Greensboro: Fire Incidents, North Carolina (NC)
Where are fire incidents reported in Greensboro, NC
Something went wrong! Please refresh the page.
| Fire incidents reported | |
|---|---|
| Sreet name | Count |
| MARKET ST | 788 |
| CHURCH ST | 374 |
| WENDOVER AV | 374 |
| ELM ST | 318 |
| HOLDEN RD | 306 |
| HIGH POINT RD | 302 |
| FRIENDLY AV | 290 |
| BATTLEGROUND AV | 282 |
| LAWNDALE DR | 282 |
| SUMMIT AV | 278 |
| RANDLEMAN RD | 272 |
| SPRING GARDEN ST | 262 |
| LEE ST | 258 |
| MEADOWVIEW RD | 250 |
| FAIRVIEW ST | 248 |
| FLORIDA ST | 236 |
| LEES CHAPEL RD | 226 |
| US 29 | 218 |
| CONE BLVD | 206 |
| NEW GARDEN RD | 200 |
| I-40 | 182 |
| I40 | 176 |
| YANCEYVILLE ST | 176 |
| MCCONNELL RD | 154 |
| MCKNIGHT MILL RD | 152 |
| ALAMANCE CHURCH RD | 150 |
| ELM-EUGENE ST | 150 |
| MARTIN LUTHER KING JR DR | 148 |
| GUILFORD COLLEGE RD | 136 |
| RANDLEMAN RD | 134 |
| Other | 11,631 |
2002 - 2018 National Fire Incident Reporting System (NFIRS) incidents
- Incident types reported to NFIRS in Greensboro, NC
- 121,63159.2%Rescue & EMS
- 19,9339.7%Good Intent Call
- 19,4739.5%False Alarm
- 19,1599.3%Fire
- 16,6958.1%Hazardous Condition
- 6,8003.3%Service Call
- 8250.4%Severe Weather
- 4900.2%Special Incident
- 3550.2%Overpressure Rupture
- Fire incident types reported to NFIRS in Greensboro, NC
- 7,78640.6%Structure Fires
- 7,64639.9%Outside Fires
- 3,54318.5%Mobile Property/Vehicle Fires
- 1841.0%Other
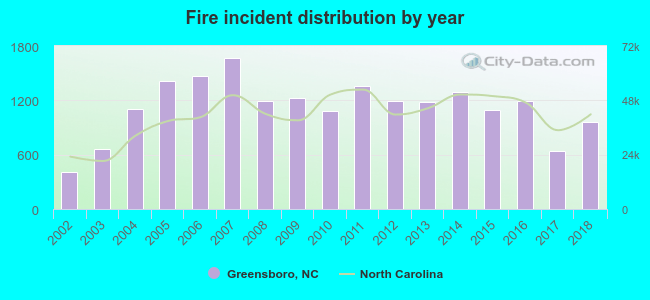 According to the data from the years 2002 - 2018 the average number of fire incidents per year is 1,127. The highest number of fires - 1,671 took place in 2007, and the least - 413 in 2002. The data has a growing trend.
The average number of yearly fire incidents per 10k residents in Greensboro, NC compared to nearest cities:
(Note: Based on data for the last 3 years, including only cities with population 5,000 and above)
| Greensboro: | 33.0 |
| Summerfield: | 41.2 |
| Oak Ridge: | 30.8 |
| High Point: | 21.2 |
| Stokesdale: | 65.5 |
| Archdale: | 54.0 |
| Kernersville: | 86.2 |
| Gibsonville: | 135.9 |
| Elon: | 49.2 |
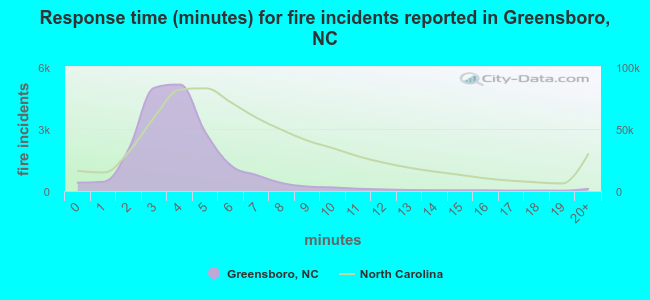 The median response time based on all reported fire incidents is 4 minutes. This is lower than the state median value.
The median response time in Greensboro, NC compared to nearest cities:
(Note: Based on data for all years, including only cities with at least 500 fire incidents)
| Greensboro: | 4 minutes |
| Jamestown: | 5 minutes |
| Pleasant Garden: | 6 minutes |
| Summerfield: | 6 minutes |
| McLeansville: | 6 minutes |
| High Point: | 4 minutes |
| Whitsett: | 6 minutes |
| Stokesdale: | 7 minutes |
| Archdale: | 5 minutes |
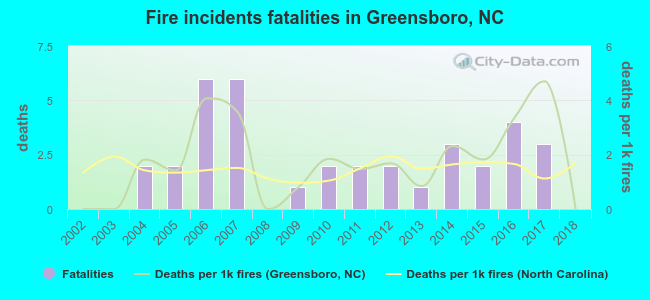 According to the reports from the years 2002 - 2018 the average number of fire-related fatalities per year is 2. The highest number of deaths - 6 took place in 2006, and the lowest - 0 in 2002. The data has a constant trend.
The average number of fatalities per 1,000 fires is 2. This indicator was the highest - 5 in 2017, and the lowest 0 in 2002. The trend for fatalities per 1,000 fires is rising. Compared to the North Carolina value the number of deaths per 1,000 fires is higher.
According to the reports from the years 2002 - 2018 the average number of fire-related fatalities per year is 2. The highest number of deaths - 6 took place in 2006, and the lowest - 0 in 2002. The data has a constant trend.
The average number of fatalities per 1,000 fires is 2. This indicator was the highest - 5 in 2017, and the lowest 0 in 2002. The trend for fatalities per 1,000 fires is rising. Compared to the North Carolina value the number of deaths per 1,000 fires is higher.Deaths per 1,000 incidents in Greensboro, NC compared to nearest cities:
(Note: Based on data for all years, including only cities with at least 2,500 fire incidents)
| Greensboro: | 1.9 |
| High Point: | 1.2 |
| Kernersville: | 1.1 |
| Thomasville: | 2.5 |
| Reidsville: | 2.9 |
| Burlington: | 2.0 |
| Winston-Salem: | 2.1 |
| Asheboro: | 0.3 |
| Lexington: | 0.0 |
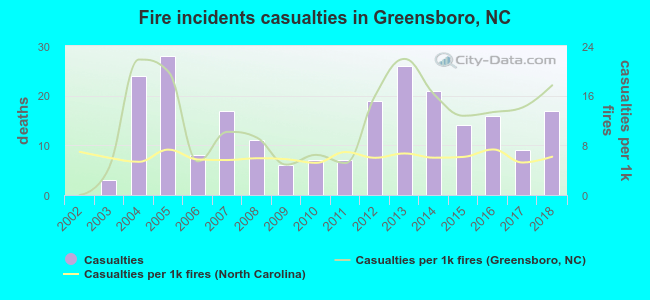 According to the data from the years 2002 - 2018 the average number of fire-related casualties per year is 14. The highest number of reported casualties - 28 took place in 2005, and the lowest - 0 in 2002. The data has an increasing trend.
The average number of injuries per 1,000 fires is 12. This indicator was the highest - 22 in 2013, and the lowest 0 in 2002. The trend for injuries per 1,000 fire incidents is increasing. Compared to the state value the number of injuries per 1,000 fires is higher.
According to the data from the years 2002 - 2018 the average number of fire-related casualties per year is 14. The highest number of reported casualties - 28 took place in 2005, and the lowest - 0 in 2002. The data has an increasing trend.
The average number of injuries per 1,000 fires is 12. This indicator was the highest - 22 in 2013, and the lowest 0 in 2002. The trend for injuries per 1,000 fire incidents is increasing. Compared to the state value the number of injuries per 1,000 fires is higher.Casualties per 1,000 incidents in Greensboro, NC compared to nearest cities:
(Note: Based on data for all years, including only cities with at least 500 fire incidents)
| Greensboro: | 12.2 |
| Jamestown: | 15.7 |
| Pleasant Garden: | 4.2 |
| Summerfield: | 7.3 |
| McLeansville: | 2.3 |
| High Point: | 14.9 |
| Whitsett: | 2.9 |
| Stokesdale: | 5.8 |
| Archdale: | 10.1 |
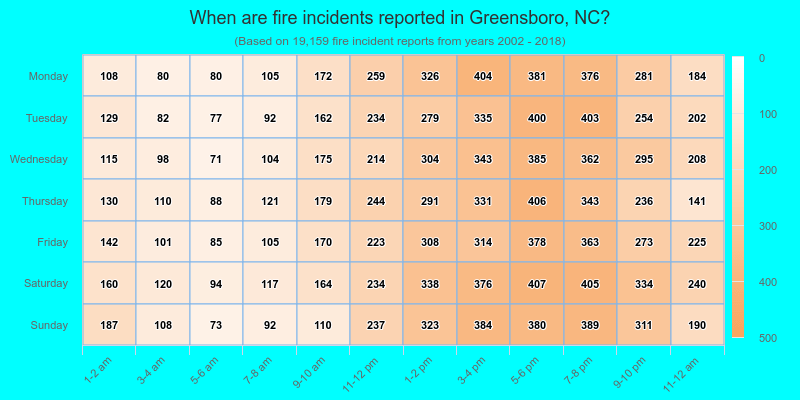
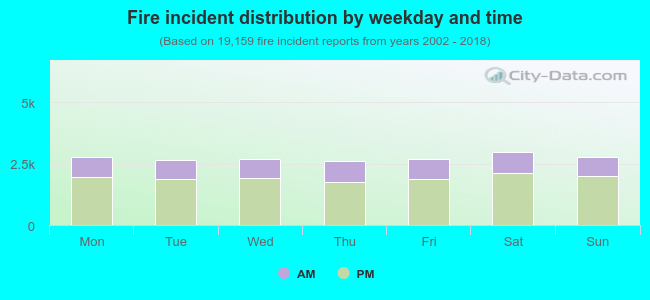 30.0% incidents where reported in the morning and 70.0% in the evening. The most fires (15.6%) took place on Saturday, and the least (13.7%) on Thursday.
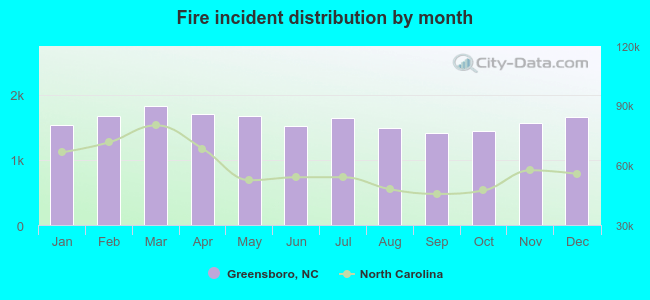 According to the 19,159 incident reports from years 2002 - 2018 most fires (9.6%) took place during March, and the least (7.4%) in September.
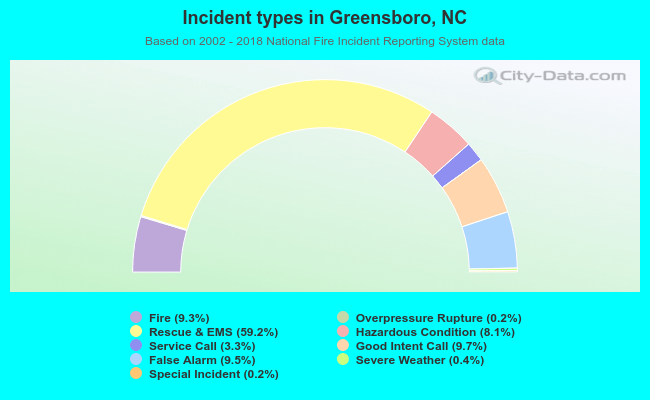 Out of all 205,361 cases reported during the years 2002 - 2018, the most belonged to the categories: Rescue & EMS (59.2%), Good Intent Call (9.7%), and False Alarm (9.5%).
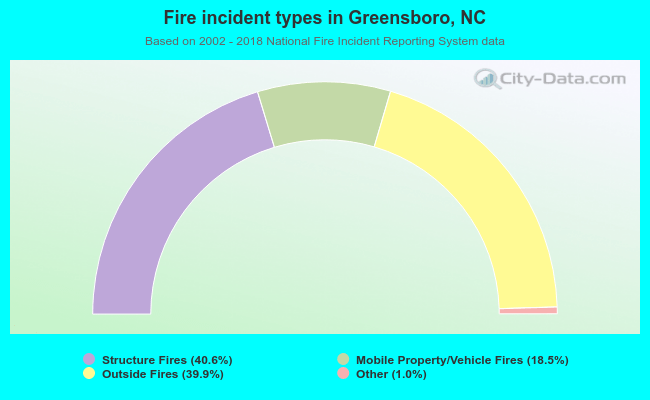 When looking into fire subcategories, the most reports belonged to: Structure Fires (40.6%), and Outside Fires (39.9%).