Oak Ridge: Fire Incidents, North Carolina (NC)
Where are fire incidents reported in Oak Ridge, NC
Something went wrong! Please refresh the page.
|
| |||||||||||||||||||||||||||||||||||||||||||||||||||||||||||||||||||||||||||||||||||||||||||||||||||||||||||||
2002 - 2018 National Fire Incident Reporting System (NFIRS) incidents
- Incident types reported to NFIRS in Oak Ridge, NC
- 93241.3%Rescue & EMS
- 40818.1%Good Intent Call
- 37416.6%Fire
- 2029.0%Service Call
- 1808.0%False Alarm
- 1577.0%Hazardous Condition
- Fire incident types reported to NFIRS in Oak Ridge, NC
- 16844.9%Structure Fires
- 15842.2%Outside Fires
- 338.8%Mobile Property/Vehicle Fires
- 154.0%Other
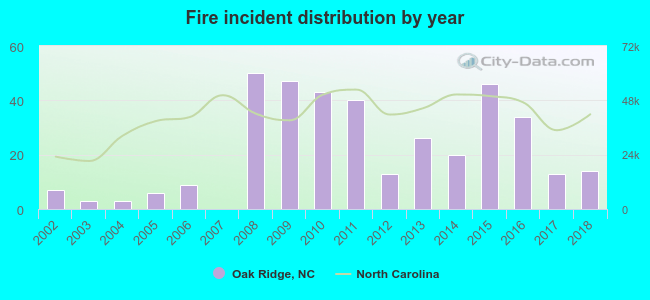 Based on the data from the years 2002 - 2018 the average number of fire incidents per year is 22. The highest number of reported fires - 50 took place in 2008, and the least - 0 in 2007. The data has a growing trend.
The average number of yearly fire incidents per 10k residents in Oak Ridge, NC compared to nearest cities:
(Note: Based on data for the last 3 years, including only cities with population 5,000 and above)
| Oak Ridge: | 30.8 |
| Stokesdale: | 65.5 |
| Summerfield: | 41.2 |
| Kernersville: | 86.2 |
| Greensboro: | 33.0 |
| High Point: | 21.2 |
| Archdale: | 54.0 |
| Thomasville: | 78.8 |
| Trinity: | 78.1 |
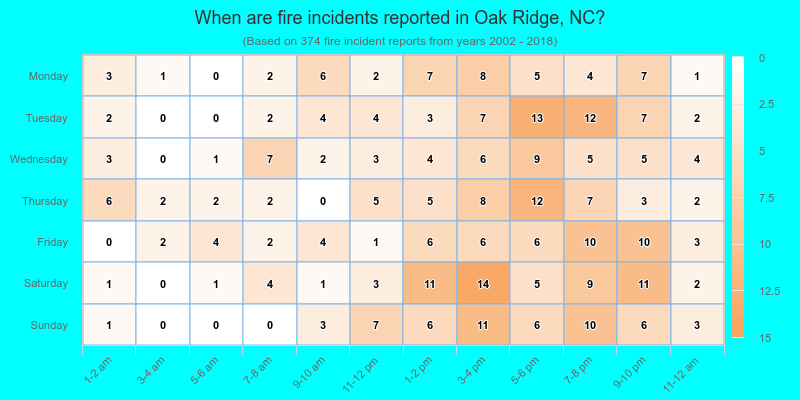
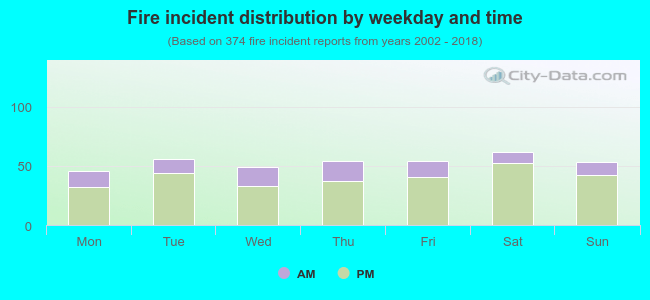 24.9% incidents where reported in the morning and 75.1% in the evening. The most fires (16.6%) took place on Saturday, and the least (12.3%) on Monday.
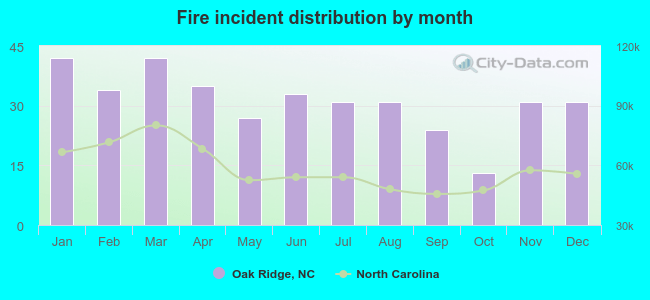 According to the 374 fires from years 2002 - 2018 most fires (11.2%) took place during January, and the least (3.5%) in October.
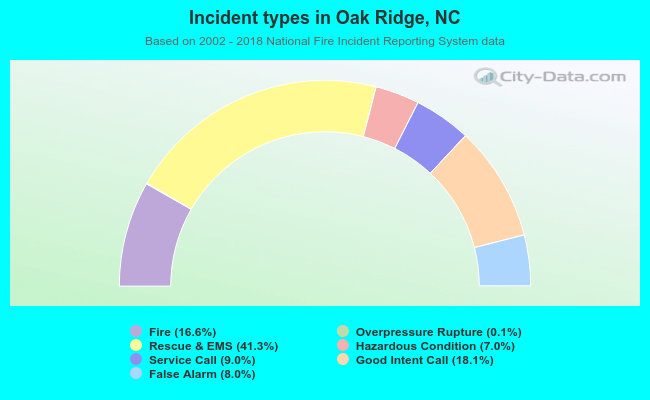 Out of all 2,255 cases reported during the years 2002 - 2018, the most belonged to the categories: Rescue & EMS (41.3%), Good Intent Call (18.1%), and Fire (16.6%).
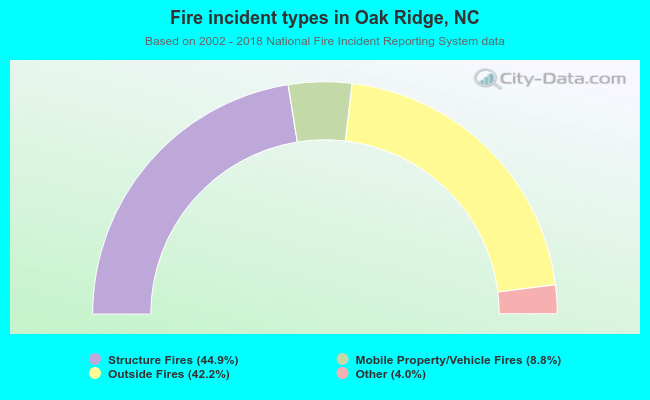 When looking into fire subcategories, the most incidents belonged to: Structure Fires (44.9%), and Outside Fires (42.2%).