Greenville: Fire Incidents, Texas (TX)
Where are fire incidents reported in Greenville, TX
Something went wrong! Please refresh the page.
| Fire incidents reported | |
|---|---|
| Sreet name | Count |
| INTERSTATE 30 | 348 |
| WESLEY ST | 286 |
| JOE RAMSEY BLVD | 244 |
| STONEWALL ST | 122 |
| LEE ST | 102 |
| JACK FINNEY BLVD | 94 |
| SAYLE ST | 94 |
| ONEAL ST | 78 |
| WELLINGTON ST | 78 |
| WALNUT ST | 72 |
| HWY 69 | 68 |
| KING ST | 68 |
| INDUSTRIAL BLVD | 66 |
| FM 1570 | 62 |
| HWY 34 | 62 |
| STANFORD ST | 58 |
| BOURLAND ST | 56 |
| MOULTON ST | 48 |
| DIVISION ST | 46 |
| ROBERTS ST | 46 |
| SPEEDWAY ST | 46 |
| WOLFE CITY DR | 46 |
| FM 1564 | 44 |
| PICKETT ST | 44 |
| COMMERCE DR | 42 |
| JOE RAMSEY VD | 42 |
| HENRY ST | 40 |
| MCDOUGAL ST | 40 |
| CORNELIA ST | 38 |
| FM 118 | 38 |
| Other | 865 |
2003 - 2018 National Fire Incident Reporting System (NFIRS) incidents
- Incident types reported to NFIRS in Greenville, TX
- 16,08563.5%Rescue & EMS
- 3,38313.4%Fire
- 1,8257.2%Service Call
- 1,3975.5%Hazardous Condition
- 1,3975.5%Good Intent Call
- 1,1744.6%False Alarm
- 360.1%Special Incident
- Fire incident types reported to NFIRS in Greenville, TX
- 1,71450.7%Outside Fires
- 98829.2%Structure Fires
- 46113.6%Mobile Property/Vehicle Fires
- 2206.5%Other
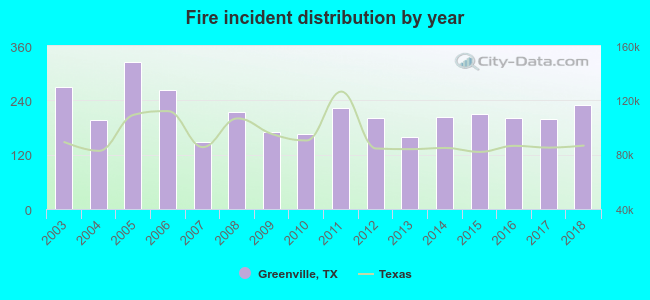 According to the data from the years 2003 - 2018 the average number of fire incidents per year is 211. The highest number of fire incidents - 325 took place in 2005, and the least - 149 in 2007. The data has a declining trend.
The average number of yearly fire incidents per 10k residents in Greenville, TX compared to nearest cities:
(Note: Based on data for the last 3 years, including only cities with population 5,000 and above)
| Greenville: | 80.1 |
| Commerce: | 140.7 |
| Royse City: | 121.2 |
| Fate: | 35.2 |
| Princeton: | 102.0 |
| Rockwall: | 23.0 |
| Wylie: | 21.6 |
| Lucas: | 54.9 |
| Terrell: | 100.4 |
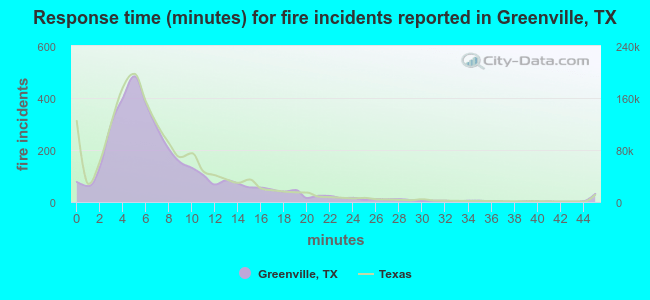 The median response time based on all reported fire incidents is 6 minutes. This is about the same as the Texas median value.
The median response time in Greenville, TX compared to nearest cities:
(Note: Based on data for all years, including only cities with at least 500 fire incidents)
| Greenville: | 6 minutes |
| Caddo Mills: | 13 minutes |
| Campbell: | 13 minutes |
| Celeste: | 9 minutes |
| Lone Oak: | 13 minutes |
| Commerce: | 5 minutes |
| Quinlan: | 12 minutes |
| Farmersville: | 9 minutes |
| Royse City: | 10 minutes |
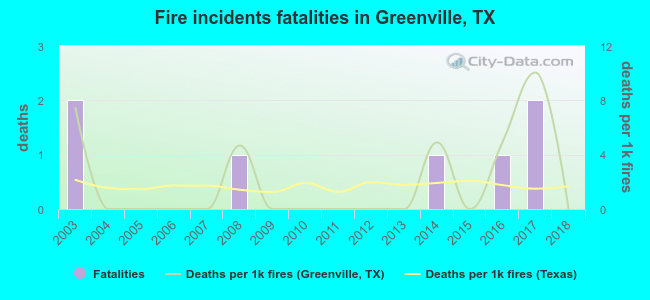 Based on the reports from the years 2003 - 2018 the average number of fire-related fatalities per year is 0. The highest number of deaths - 2 took place in 2003, and the lowest - 0 in 2004. The data has a dropping trend.
The average number of deaths per 1,000 fire incidents is 2. This indicator was the highest - 10 in 2017, and the lowest 0 in 2004. The trend for fatalities per 1,000 fire incidents is dropping. Compared to the Texas value the number of fatalities per 1,000 fires is higher.
Based on the reports from the years 2003 - 2018 the average number of fire-related fatalities per year is 0. The highest number of deaths - 2 took place in 2003, and the lowest - 0 in 2004. The data has a dropping trend.
The average number of deaths per 1,000 fire incidents is 2. This indicator was the highest - 10 in 2017, and the lowest 0 in 2004. The trend for fatalities per 1,000 fire incidents is dropping. Compared to the Texas value the number of fatalities per 1,000 fires is higher.Deaths per 1,000 incidents in Greenville, TX compared to nearest cities:
(Note: Based on data for all years, including only cities with at least 2,500 fire incidents)
| Greenville: | 2.1 |
| Terrell: | 0.0 |
| Sulphur Springs: | 2.0 |
| McKinney: | 2.8 |
| Garland: | 2.2 |
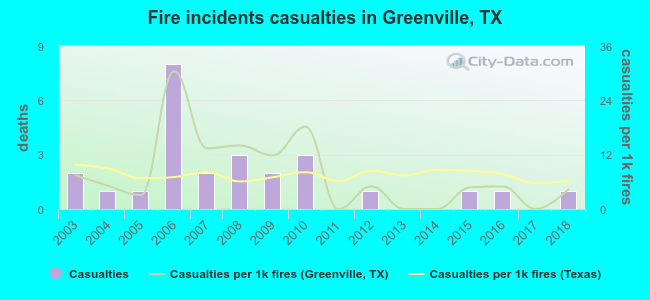 According to the reports from the years 2003 - 2018 the average number of fire-related casualties per year is 2. The highest number of injuries - 8 took place in 2006, and the lowest - 0 in 2011. The data has a declining trend.
The average number of casualties per 1,000 fires is 8. This indicator was the highest - 30 in 2006, and the lowest 0 in 2011. The trend for casualties per 1,000 fires is decreasing. Compared to the Texas value the number of casualties per 1,000 fires is about the same.
According to the reports from the years 2003 - 2018 the average number of fire-related casualties per year is 2. The highest number of injuries - 8 took place in 2006, and the lowest - 0 in 2011. The data has a declining trend.
The average number of casualties per 1,000 fires is 8. This indicator was the highest - 30 in 2006, and the lowest 0 in 2011. The trend for casualties per 1,000 fires is decreasing. Compared to the Texas value the number of casualties per 1,000 fires is about the same.Casualties per 1,000 incidents in Greenville, TX compared to nearest cities:
(Note: Based on data for all years, including only cities with at least 500 fire incidents)
| Greenville: | 7.7 |
| Caddo Mills: | 0.0 |
| Campbell: | 0.9 |
| Celeste: | 0.0 |
| Lone Oak: | 0.0 |
| Commerce: | 1.4 |
| Quinlan: | 0.9 |
| Farmersville: | 0.0 |
| Royse City: | 0.7 |
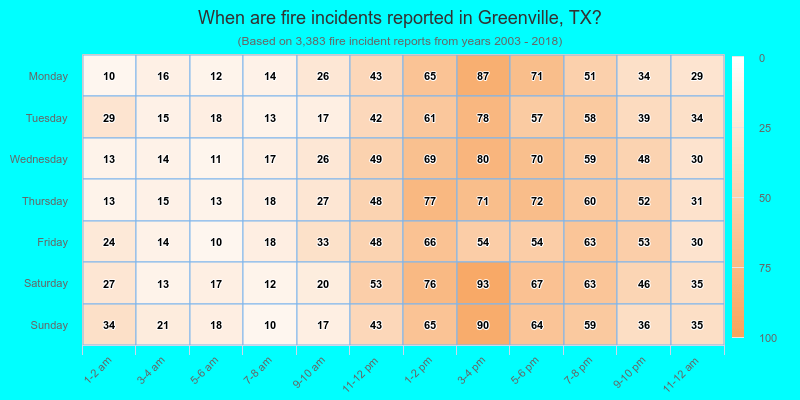
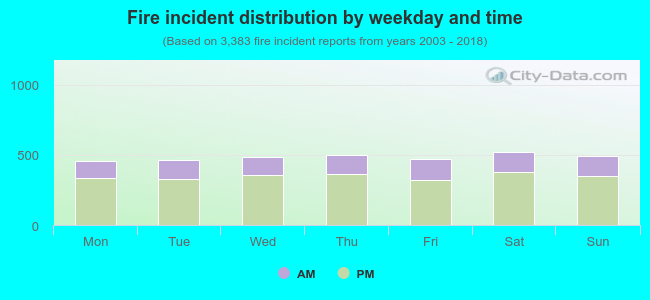 28.1% incidents where reported in the morning and 71.9% in the evening. The most fires (15.4%) took place on Saturday, and the least (13.5%) on Monday.
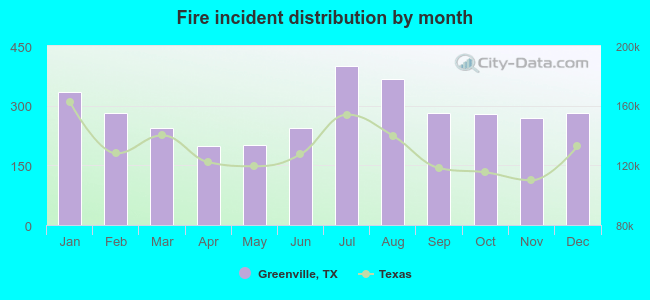 According to the 3,383 fire incidents from years 2003 - 2018 most fires (11.8%) took place during July, and the least (5.9%) in April.
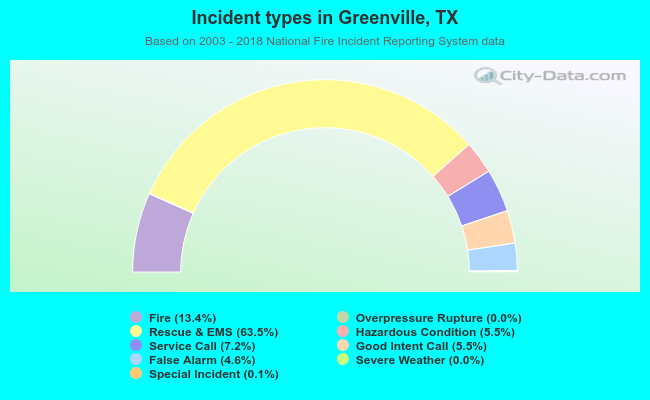 Out of all 25,311 cases reported during the years 2003 - 2018, the most belonged to the categories: Rescue & EMS (63.5%), Fire (13.4%), and Service Call (7.2%).
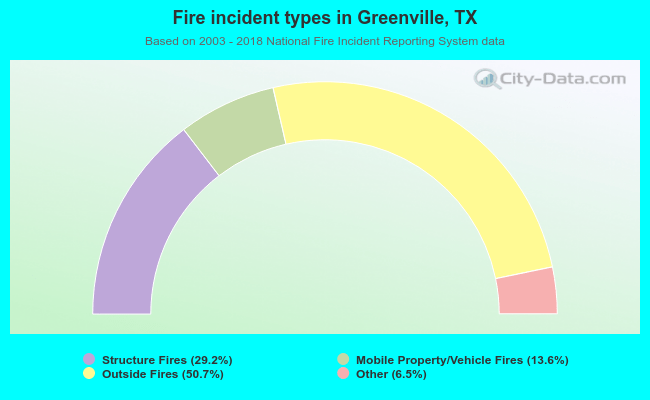 When looking into fire subcategories, the most incidents belonged to: Outside Fires (50.7%), and Structure Fires (29.2%).