| Fire incidents reported |
|---|
| Sreet name | Count |
|---|
| MONUMENT HILL RD | 14 | | BLACK POND RD | 12 | | BLACK POND ROAD | 10 | | HORTONIA RD | 10 | | ROUTE 30 | 10 | | MONUMENT HILL RD | 8 | | CAMP RD | 6 | | MONUMENT HILL ROAD | 6 | | WOODS RD | 6 | | 85 WOODS ROAD | 4 | | GANSON HILL RD | 4 | | HORTONIA ROAD | 4 | | HOWLAND RD | 4 | | ROUTE 30 HWY | 4 | | WOODS RD | 4 | | 1924 ROUTE 30 HWY | 2 | | 2365 RTE 30 RT | 2 | | 30 RT | 2 | | 648 EAST HUBBARDTON RD | 2 | | 704 TOMS LANE (PRIVATE) LANE | 2 | | BIDDY KNOB ROAD | 2 | | BIRCH RD | 2 | | BIRCH ROAD | 2 | | BURNS LN | 2 | | CAMP RD. RD | 2 |
| | | Fire incidents reported |
|---|
| Sreet name | Count |
|---|
| CAMP RDS | 2 | | CRANE LN | 2 | | DAVIS RDS | 2 | | DELANCEY RD | 2 | | DELANCEY RD RD | 2 | | DENSIN LN | 2 | | E. GANSON HILL | 2 | | E. GANSON HILL RD | 2 | | EAST HUBBARDTON | 2 | | FROG HOLLOW RD | 2 | | GREEN MOUNTAIN VILLAGE | 2 | | HALF MOON CAMPGROUND | 2 | | HINCKLEY RD | 2 | | HINKELY ROAD | 2 | | HORTANIA RD | 2 | | HORTONIA RD | 2 | | HORTONIA RDS | 2 | | HORTONIA ROAD | 2 | | HOWLANE RD | 2 | | LEDGEMERE POINT ROAD | 2 | | LEDGEMERE PT | 2 | | LEDGEMERE PT | 2 | | LEDGEMERE PT RD | 2 | | LEDGMARE PT RD | 2 | | MONUMENT HILL RD RD | 2 |
|
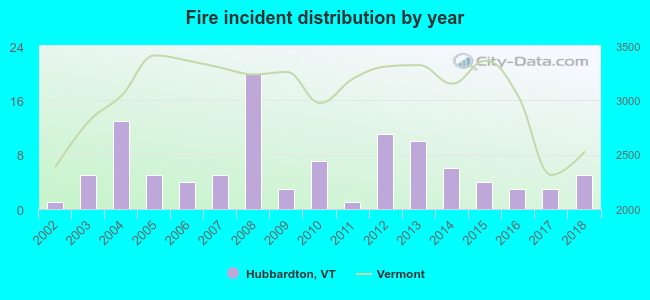 According to the data from the years 2002 - 2018 the average number of fire incidents per year is 6. The highest number of fire incidents - 20 took place in 2008, and the least - 1 in 2002. The data has an increasing trend.
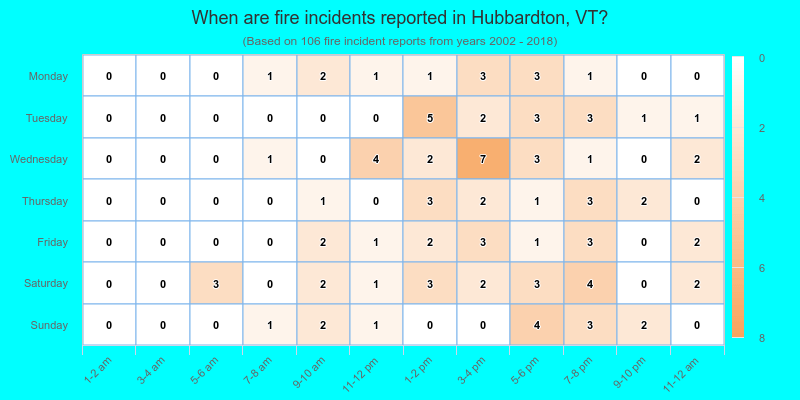
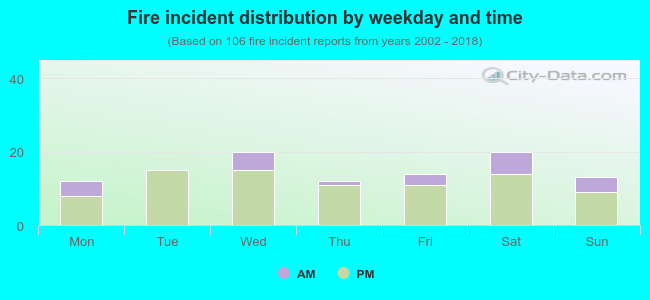 21.7% incidents where reported in the morning and 78.3% in the evening. The most fires (18.9%) took place on Wednesday, and the least (11.3%) on Monday.
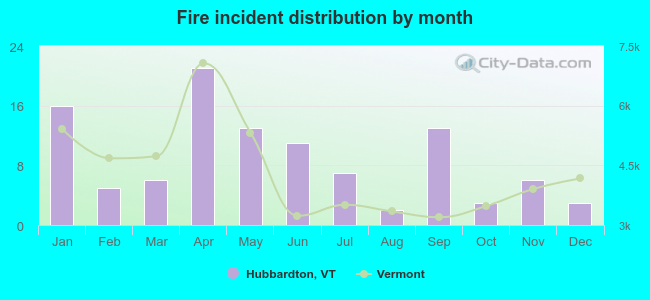 Based on the 106 incident reports from years 2002 - 2018 most fires (19.8%) took place during April, and the least (1.9%) in August.
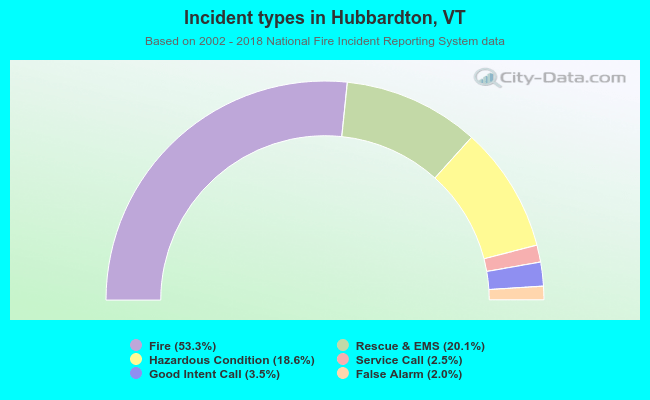 Out of all 199 cases reported during the years 2002 - 2018, the most belonged to the categories: Fire (53.3%), Overpressure Rupture (20.1%), and Rescue & EMS (18.6%).
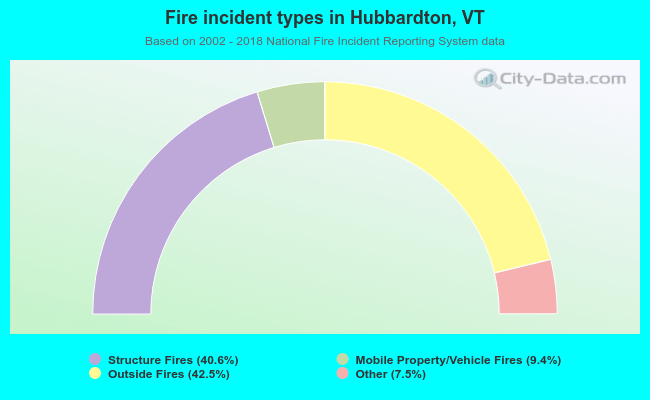 When looking into fire subcategories, the most reports belonged to: Outside Fires (42.5%), and Structure Fires (40.6%).