Hubbardton, Vermont
Submit your own pictures of this town and show them to the world
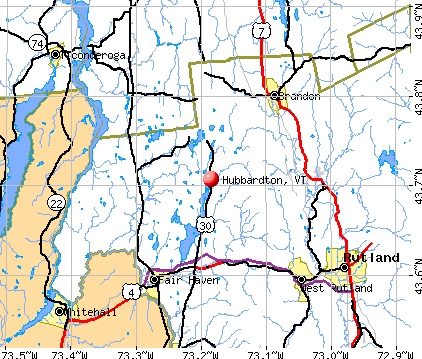
- OSM Map
- General Map
- Google Map
- MSN Map
Population change since 2000: -6.1%
 |
| Males: 366 | |
| Females: 340 |
| Median resident age: | 47.7 years |
| Vermont median age: | 45.8 years |
Zip codes: 05732.
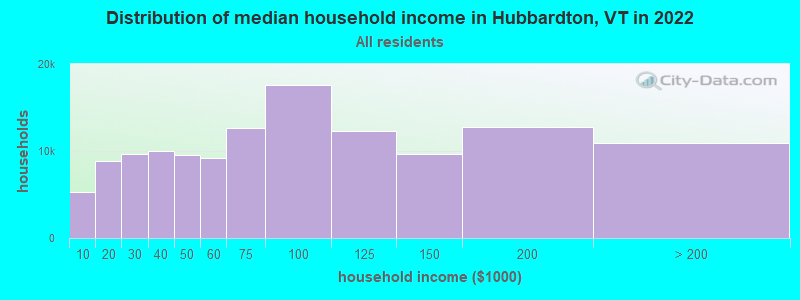
| Hubbardton: | $64,162 |
| VT: | $73,991 |
Estimated per capita income in 2022: $38,145 (it was $19,276 in 2000)
Hubbardton town income, earnings, and wages data
Estimated median house or condo value in 2022: $248,473 (it was $106,100 in 2000)
| Hubbardton: | $248,473 |
| VT: | $304,700 |
Mean prices in 2022: all housing units: $254,868; detached houses: $264,391; townhouses or other attached units: $230,842; in 2-unit structures: $224,848; in 3-to-4-unit structures: $273,008; in 5-or-more-unit structures: $159,824; mobile homes: $117,051
Detailed information about poverty and poor residents in Hubbardton, VT


- 67996.2%White alone
- 142.0%Two or more races
- 101.4%Hispanic
- 10.1%Black alone
- 10.1%Asian alone
- 10.1%Native Hawaiian and Other
Pacific Islander alone
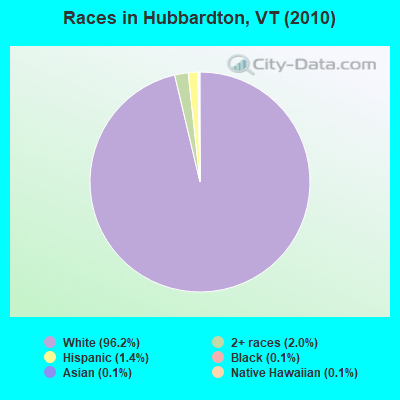
Races in Hubbardton detailed stats: ancestries, foreign born residents, place of birth
 Recent articles from our blog. Our writers, many of them Ph.D. graduates or candidates, create easy-to-read articles on a wide variety of topics.

 | Mad River Valley? Questions on possible relocation... (30 replies) |
| Areas of Vermont for a single male who wants to be alone? (27 replies) |
| Want to move to New England from NC (19 replies) |
| Vermont property taxes: beyond ridiculous! (422 replies) |
| Trader Joe's, Whole Foods, French Bakeries and IKEA (43 replies) |
| Info on Bennington and Brattleboro (12 replies) |
Latest news from Hubbardton, VT collected exclusively by city-data.com from local newspapers, TV, and radio stations
Ancestries: Irish (15.8%), English (15.2%), French (14.0%), United States (10.6%), German (10.1%), Italian (7.0%).
Current Local Time: EST time zone
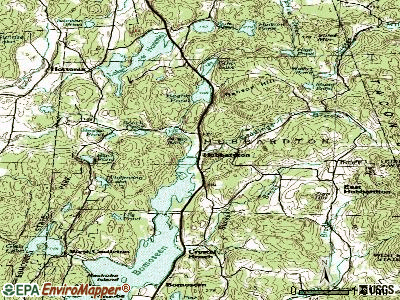
Elevation: 422 feet
Land area: 27.5 square miles.
Population density: 26 people per square mile (very low).
34 residents are foreign born (1.7% Europe, 1.6% Asia, 0.9% North America).
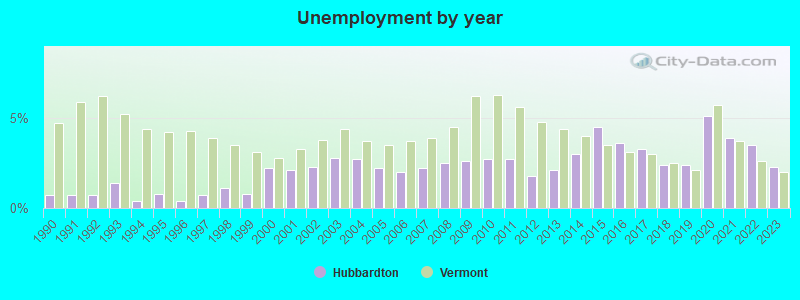
| This town: | 4.5% |
| Vermont: | 3.8% |
| Hubbardton town: | 2.1% ($2,250) |
| Vermont: | 2.0% ($2,196) |
Nearest city with pop. 50,000+: Schenectady, NY  (73.7 miles , pop. 61,821).
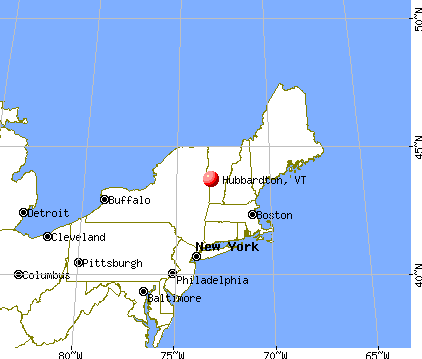
Nearest city with pop. 200,000+: Boston, MA (143.7 miles , pop. 589,141).
Nearest city with pop. 1,000,000+: Bronx, NY (202.0 miles , pop. 1,332,650).
Nearest cities:
), ), ), )Latitude: 43.72 N, Longitude: 73.19 W
Area code: 802

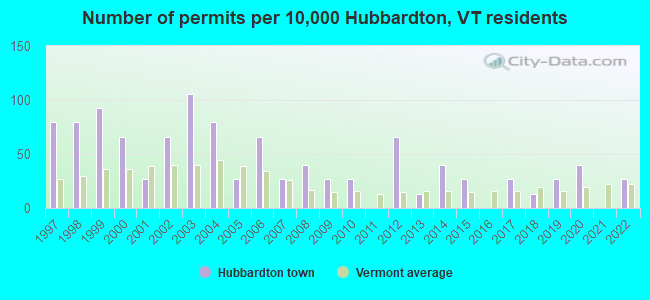
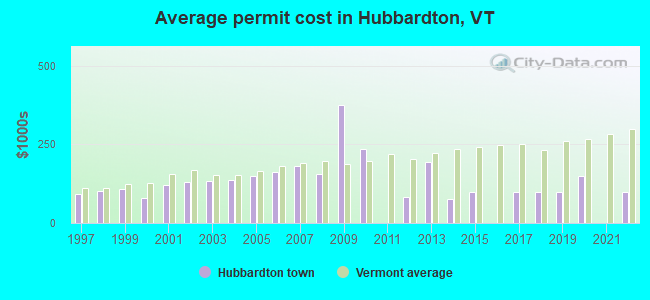
Single-family new house construction building permits:
- 2022: 2 buildings, average cost: $100,000
- 2020: 3 buildings, average cost: $149,400
- 2019: 2 buildings, average cost: $100,000
- 2018: 1 building, cost: $100,000
- 2017: 2 buildings, average cost: $100,000
- 2015: 2 buildings, average cost: $100,000
- 2014: 3 buildings, average cost: $75,000
- 2013: 1 building, cost: $193,300
- 2012: 5 buildings, average cost: $82,000
- 2010: 2 buildings, average cost: $235,000
- 2009: 2 buildings, average cost: $375,000
- 2008: 3 buildings, average cost: $154,500
- 2007: 2 buildings, average cost: $181,200
- 2006: 5 buildings, average cost: $162,700
- 2005: 2 buildings, average cost: $150,200
- 2004: 6 buildings, average cost: $138,300
- 2003: 8 buildings, average cost: $132,800
- 2002: 5 buildings, average cost: $130,700
- 2001: 2 buildings, average cost: $121,400
- 2000: 5 buildings, average cost: $80,000
- 1999: 7 buildings, average cost: $109,200
- 1998: 6 buildings, average cost: $101,700
- 1997: 6 buildings, average cost: $91,700
| Here: | 2.3% |
| Vermont: | 2.0% |
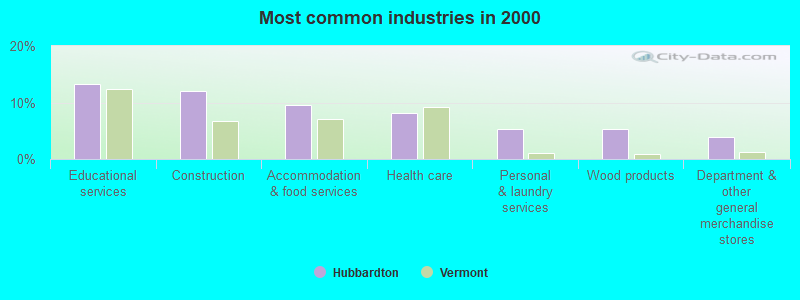
- Educational services (13.2%)
- Construction (12.1%)
- Accommodation & food services (9.6%)
- Health care (8.1%)
- Personal & laundry services (5.3%)
- Wood products (5.3%)
- Department & other general merchandise stores (3.9%)
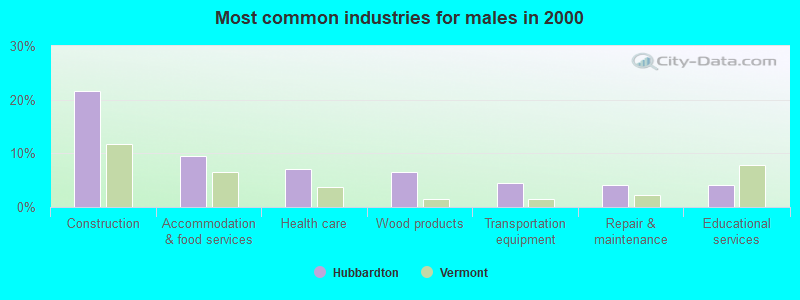
- Construction (21.6%)
- Accommodation & food services (9.5%)
- Health care (7.0%)
- Wood products (6.5%)
- Transportation equipment (4.5%)
- Repair & maintenance (4.0%)
- Educational services (4.0%)
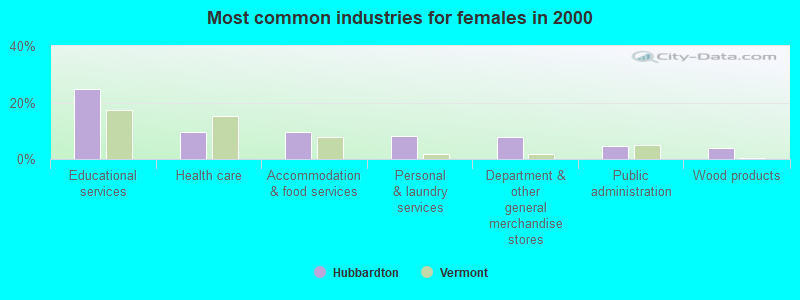
- Educational services (24.8%)
- Health care (9.6%)
- Accommodation & food services (9.6%)
- Personal & laundry services (8.3%)
- Department & other general merchandise stores (7.6%)
- Public administration (4.5%)
- Wood products (3.8%)
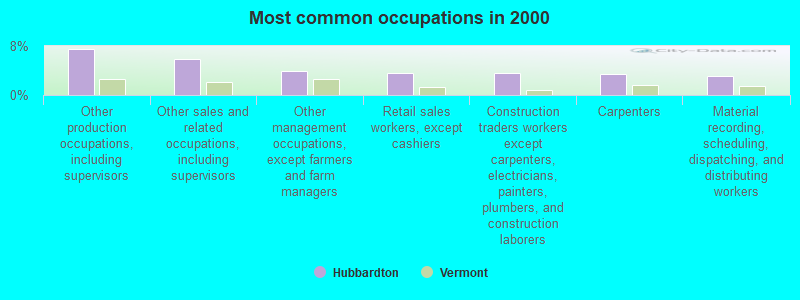
- Other production occupations, including supervisors (7.6%)
- Other sales and related occupations, including supervisors (5.9%)
- Other management occupations, except farmers and farm managers (3.9%)
- Retail sales workers, except cashiers (3.7%)
- Construction traders workers except carpenters, electricians, painters, plumbers, and construction laborers (3.7%)
- Carpenters (3.4%)
- Material recording, scheduling, dispatching, and distributing workers (3.1%)
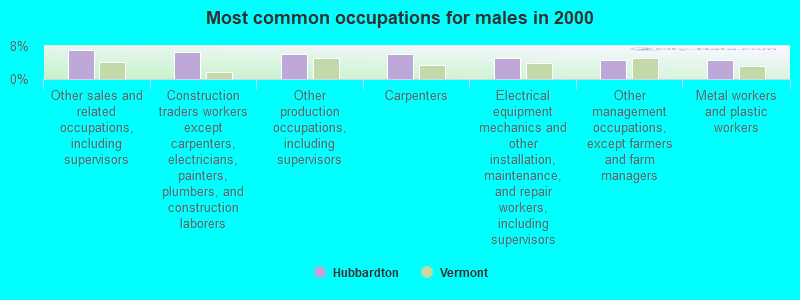
- Other sales and related occupations, including supervisors (7.0%)
- Construction traders workers except carpenters, electricians, painters, plumbers, and construction laborers (6.5%)
- Other production occupations, including supervisors (6.0%)
- Carpenters (6.0%)
- Electrical equipment mechanics and other installation, maintenance, and repair workers, including supervisors (5.0%)
- Other management occupations, except farmers and farm managers (4.5%)
- Metal workers and plastic workers (4.5%)
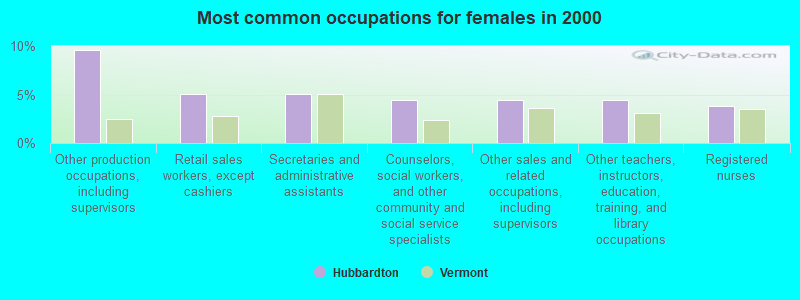
- Other production occupations, including supervisors (9.6%)
- Retail sales workers, except cashiers (5.1%)
- Secretaries and administrative assistants (5.1%)
- Counselors, social workers, and other community and social service specialists (4.5%)
- Other sales and related occupations, including supervisors (4.5%)
- Other teachers, instructors, education, training, and library occupations (4.5%)
- Registered nurses (3.8%)
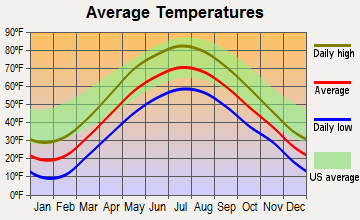
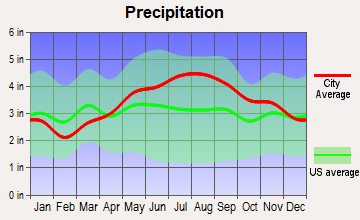
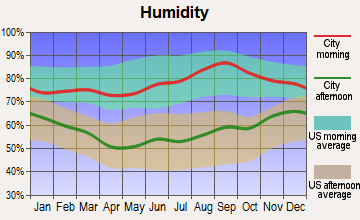
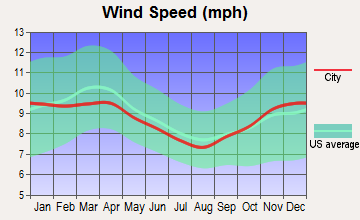
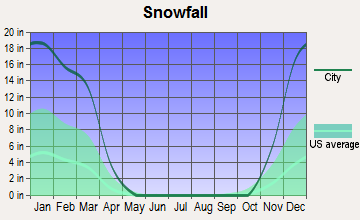
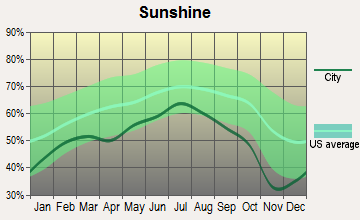
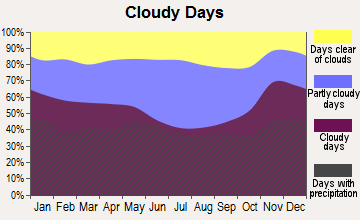
Average climate in Hubbardton, Vermont
Based on data reported by over 4,000 weather stations
(lower is better)
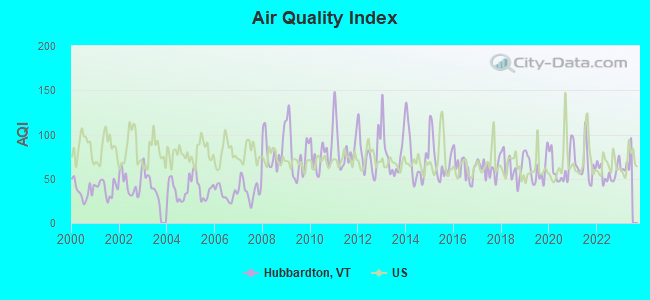
Air Quality Index (AQI) level in 2022 was 56.9. This is better than average.
| City: | 56.9 |
| U.S.: | 72.6 |
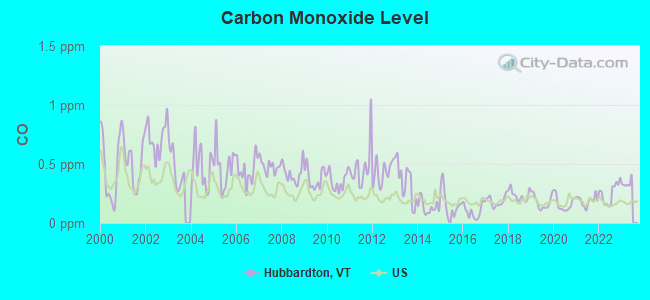
Carbon Monoxide (CO) [ppm] level in 2022 was 0.251. This is about average. Closest monitor was 13.0 miles away from the city center.
| City: | 0.251 |
| U.S.: | 0.251 |
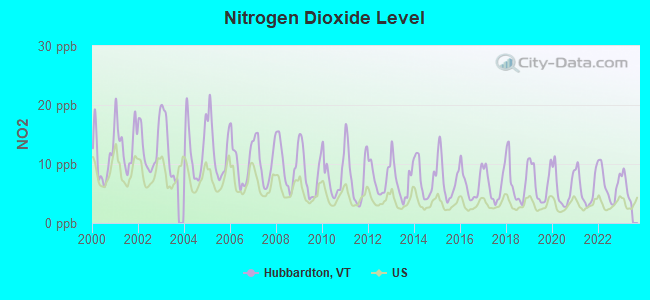
Nitrogen Dioxide (NO2) [ppb] level in 2022 was 6.51. This is worse than average. Closest monitor was 13.0 miles away from the city center.
| City: | 6.51 |
| U.S.: | 5.11 |
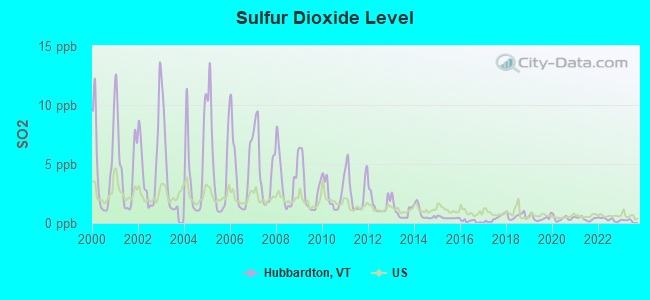
Sulfur Dioxide (SO2) [ppb] level in 2022 was 0.299. This is significantly better than average. Closest monitor was 13.0 miles away from the city center.
| City: | 0.299 |
| U.S.: | 1.515 |
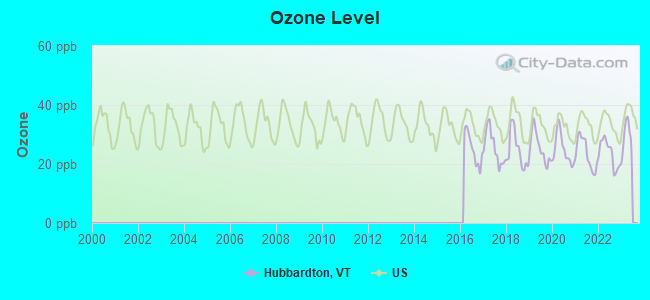
Ozone [ppb] level in 2022 was 23.5. This is significantly better than average. Closest monitor was 13.0 miles away from the city center.
| City: | 23.5 |
| U.S.: | 33.3 |
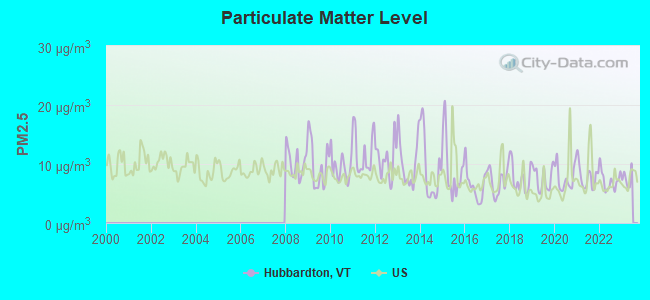
Particulate Matter (PM2.5) [µg/m3] level in 2022 was 7.23. This is about average. Closest monitor was 13.0 miles away from the city center.
| City: | 7.23 |
| U.S.: | 8.11 |
Tornado activity:
Hubbardton-area historical tornado activity is slightly below Vermont state average. It is 77% smaller than the overall U.S. average.
On 8/20/1968, a category F3 (max. wind speeds 158-206 mph) tornado 47.3 miles away from the Hubbardton town center injured one person and caused between $5000 and $50,000 in damages.
On 5/31/1998, a category F3 tornado 54.8 miles away from the town center injured 68 people and caused $71 million in damages.
Earthquake activity:
Hubbardton-area historical earthquake activity is significantly above Vermont state average. It is 69% smaller than the overall U.S. average.On 10/7/1983 at 10:18:46, a magnitude 5.3 (5.1 MB, 5.3 LG, 5.1 ML, Class: Moderate, Intensity: VI - VII) earthquake occurred 59.8 miles away from Hubbardton center
On 4/20/2002 at 10:50:47, a magnitude 5.3 (5.3 ML, Depth: 3.0 mi) earthquake occurred 60.2 miles away from the city center
On 4/20/2002 at 10:50:47, a magnitude 5.2 (5.2 MB, 4.2 MS, 5.2 MW, 5.0 MW) earthquake occurred 59.1 miles away from Hubbardton center
On 1/19/1982 at 00:14:42, a magnitude 4.7 (4.5 MB, 4.7 MD, 4.5 LG, Class: Light, Intensity: IV - V) earthquake occurred 81.0 miles away from Hubbardton center
On 10/16/2012 at 23:12:25, a magnitude 4.7 (4.7 ML, Depth: 10.0 mi) earthquake occurred 127.0 miles away from Hubbardton center
On 6/17/1991 at 08:53:16, a magnitude 4.1 (4.0 MB, 4.0 LG, Depth: 3.1 mi) earthquake occurred 106.6 miles away from Hubbardton center
Magnitude types: regional Lg-wave magnitude (LG), body-wave magnitude (MB), duration magnitude (MD), local magnitude (ML), surface-wave magnitude (MS), moment magnitude (MW)
Natural disasters:
The number of natural disasters in Rutland County (16) is near the US average (15).Major Disasters (Presidential) Declared: 11
Emergencies Declared: 2
Causes of natural disasters: Floods: 9, Storms: 9, Tropical Storms: 2, Winter Storms: 2, Hurricane: 1, Landslide: 1, Snowstorm: 1, Wind: 1, Other: 1 (Note: some incidents may be assigned to more than one category).
Hospitals and medical centers near Hubbardton:
- SAGER NURSING HOME, INC. (Nursing Home, about 11 miles away; FAIR HAVEN, VT)
- WESTVIEW COURT (Hospital, about 14 miles away; RUTLAND, VT)
- RUTLAND HEALTHCARE AND REHABILITATION CENTER (Nursing Home, about 14 miles away; RUTLAND, VT)
- VERMONT ACHIEVEMENT CENTER (Nursing Home, about 14 miles away; RUTLAND, VT)
- THE PINES AT RUTLAND CENTER FOR NURSING AND REHABI (Nursing Home, about 15 miles away; RUTLAND, VT)
- FLETCHER ALLEN HEALTHCARE - RRMC SATELLITE (Dialysis Facility, about 15 miles away; RUTLAND, VT)
- RUTLAND REGIONAL MEDICAL CENTER Acute Care Hospitals (about 15 miles away; RUTLAND, VT)
Amtrak stations near Hubbardton:
- 10 miles: FAIR HAVEN (DEPOT & WATER STS.)
- 14 miles: RUTLAND (MERCHANTS ROW) . Services: ticket office, fully wheelchair accessible, enclosed waiting area, public restrooms, public payphones, vending machines, free short-term parking, free long-term parking, call for car rental service, call for taxi service, intercity bus service, public transit connection.
- 14 miles: TICONDEROGA (RTE. 74 (FORT TICONDEROGA RD.)) . Services: enclosed waiting area, public restrooms, free short-term parking, free long-term parking, call for taxi service.
Colleges/universities with over 2000 students nearest to Hubbardton:
- Castleton State College (about 8 miles; Castleton, VT; Full-time enrollment: 2,079)
- Middlebury College (about 20 miles; Middlebury, VT; FT enrollment: 3,077)
- Adirondack Community College (about 35 miles; Queensbury, NY; FT enrollment: 2,826)
- Norwich University (about 39 miles; Northfield, VT; FT enrollment: 4,221)
- Dartmouth College (about 45 miles; Hanover, NH; FT enrollment: 6,030)
- Champlain College (about 52 miles; Burlington, VT; FT enrollment: 2,623)
- University of Vermont (about 53 miles; Burlington, VT; FT enrollment: 11,566)
Points of interest:
Notable locations in Hubbardton: Half Moon State Park Campground (A), Camp Twin Lake (B), Beechwood Camp (C), Green Mountain Camp (D), Eagle Rock Camp (E), Camp Awanee (F), Big D Campground (G), Lake Bomoseen Campground (H), Hubbardton Fire Department Station 2 (I), Hubbardton Fire Department Station 1 (J). Display/hide their locations on the map
Cemeteries: Hubbardton North Cemetery (1), Hortonville Cemetery (2), Bradley Family Cemetery (3), East Hubbardton Cemetery (4), Pleasant View Cemetery (5), Ressegrie Family Cemetery (6). Display/hide their locations on the map
Lakes and reservoirs: Beaver Meadow (A), Said Pond (B), Breese Pond (C), Black Pond (D), Beebe Pond (E), Echo Lake (F), Roach Pond (G), Walker Pond (H). Display/hide their locations on the map
Streams, rivers, and creeks: Giddings Brook (A). Display/hide its location on the map
Parks in Hubbardton include: Hubbardton Battlefield (1), Hubbardton Battlefield Wildlife Management Area (2), Hubbardton Battle Monument (3), Bomoseen State Park (4). Display/hide their locations on the map
| This town: | 2.2 people |
| Vermont: | 2.3 people |
| This town: | 61.3% |
| Whole state: | 62.5% |
| This town: | 8.3% |
| Whole state: | 9.2% |
Likely homosexual households (counted as self-reported same-sex unmarried-partner households)
- Lesbian couples: 0.6% of all households
- Gay men: 0.0% of all households
| This town: | 13.0% |
| Whole state: | 9.4% |
| This town: | 6.5% |
| Whole state: | 3.6% |
For population 15 years and over in Hubbardton:
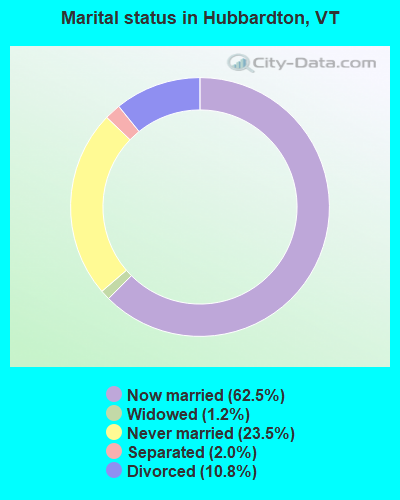
- Never married: 23.5%
- Now married: 62.5%
- Separated: 2.0%
- Widowed: 1.2%
- Divorced: 10.8%
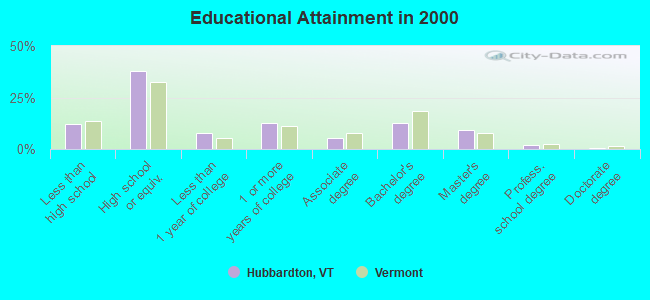
For population 25 years and over in Hubbardton:
- High school or higher: 88.0%
- Bachelor's degree or higher: 24.2%
- Graduate or professional degree: 11.6%
- Unemployed: 6.8%
- Mean travel time to work (commute): 31.1 minutes
| Here: | 11.1 |
| Vermont average: | 11.7 |
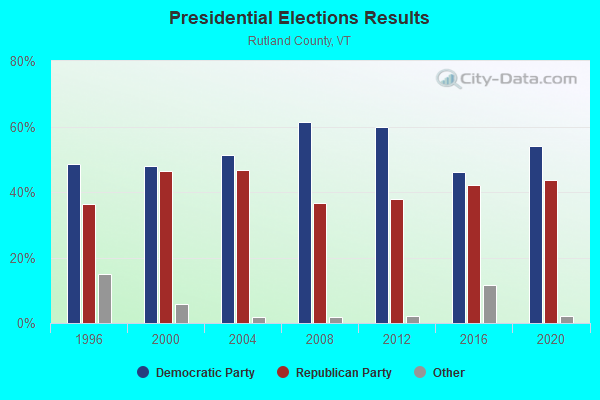
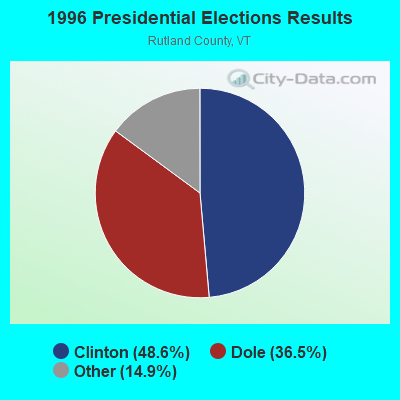
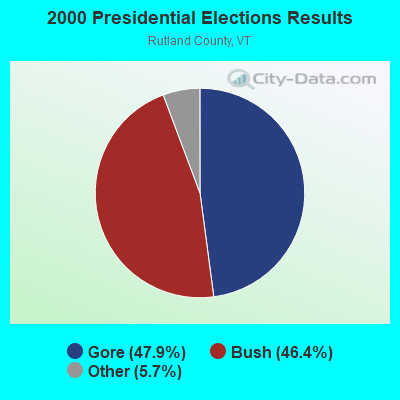
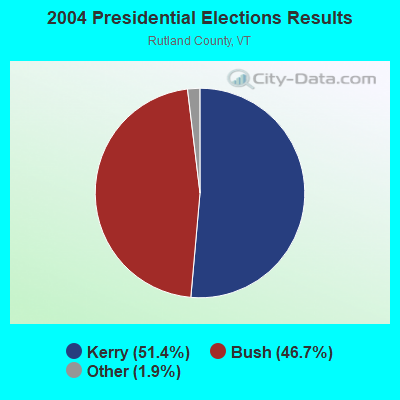
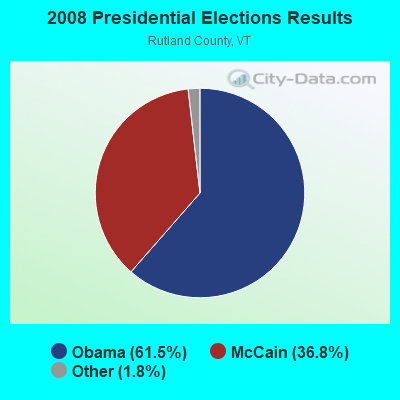
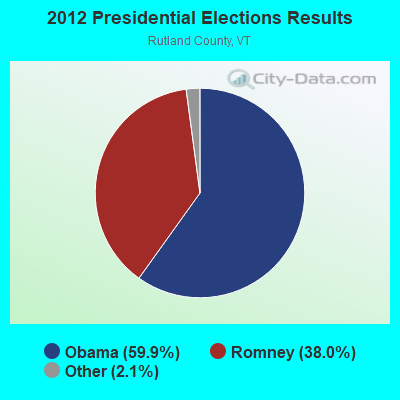
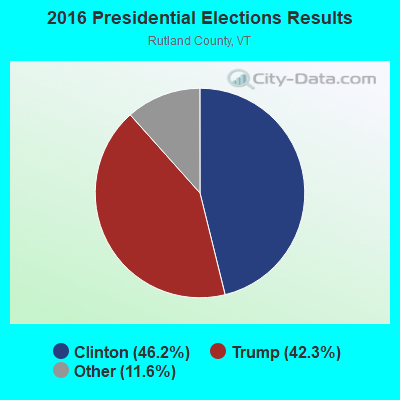
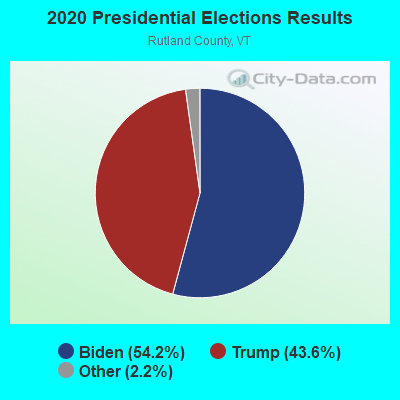
Graphs represent county-level data. Detailed 2008 Election Results
Religion statistics for Hubbardton, VT (based on Rutland County data)

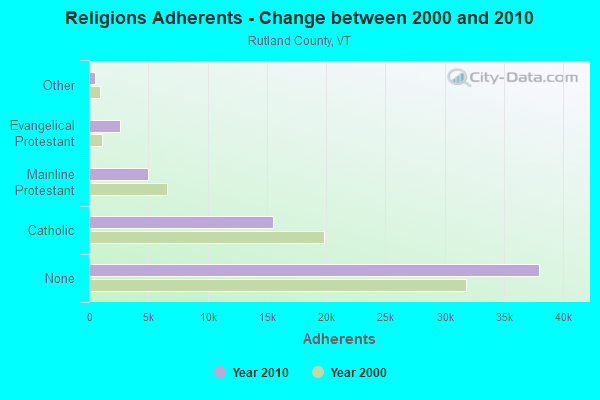
| Religion | Adherents | Congregations |
|---|---|---|
| Catholic | 15,500 | 17 |
| Mainline Protestant | 4,944 | 38 |
| Evangelical Protestant | 2,587 | 36 |
| Other | 520 | 5 |
| Orthodox | 85 | 1 |
| None | 38,006 | - |
Food Environment Statistics:
| Rutland County: | 3.78 / 10,000 pop. |
| Vermont: | 3.84 / 10,000 pop. |
| Here: | 2.05 / 10,000 pop. |
| Vermont: | 1.95 / 10,000 pop. |
| This county: | 7.56 / 10,000 pop. |
| State: | 6.40 / 10,000 pop. |
| Rutland County: | 12.77 / 10,000 pop. |
| Vermont: | 11.52 / 10,000 pop. |
| This county: | 7.8% |
| Vermont: | 6.8% |
| Rutland County: | 24.1% |
| Vermont: | 22.3% |
| Rutland County: | 18.5% |
| Vermont: | 13.3% |
Strongest AM radio stations in Hubbardton:
- WSYB (1380 AM; 5 kW; RUTLAND, VT; Owner: CAPSTAR TX LIMITED PARTNERSHIP)
- WGY (810 AM; 50 kW; SCHENECTADY, NY; Owner: CLEAR CHANNEL BROADCASTING LICENSES, INC.)
- WNNZ (640 AM; 50 kW; WESTFIELD, MA; Owner: CLEAR CHANNEL BROADCASTING LICENSES, INC.)
- WCHP (760 AM; 35 kW; CHAMPLAIN, NY; Owner: CHAMPLAIN RADIO, INC.)
- WPTR (1540 AM; 50 kW; ALBANY, NY; Owner: KIMTRON, INC.)
- WIPS (1250 AM; 1 kW; TICONDEROGA, NY; Owner: CALVIN HUGH CARR)
- WRKO (680 AM; 50 kW; BOSTON, MA; Owner: ENTERCOM BOSTON LICENSE, LLC)
- WCRN (830 AM; 50 kW; WORCESTER, MA; Owner: CARTER BROADCASTING CORPORATION)
- WICY (1490 AM; 50 kW; MALONE, NY; Owner: CARTIER COMMUNICATIONS INC.)
- WDEV (550 AM; 5 kW; WATERBURY, VT; Owner: RADIO VERMONT, INC.)
- WVNR (1340 AM; 1 kW; POULTNEY, VT; Owner: PINE TREE BROADCASTING COMPANY)
- WNTK (1020 AM; 10 kW; NEWPORT, NH; Owner: KOOR COMMUNICATIONS, INC.)
- WEEI (850 AM; 50 kW; BOSTON, MA; Owner: ENTERCOM BOSTON LICENSE, LLC)
Strongest FM radio stations in Hubbardton:
- WEXP (101.5 FM; BRANDON, VT; Owner: VOX VERMONT, L.L.C.)
- WEBK (105.3 FM; KILLINGTON, VT; Owner: 6 JOHNSON ROAD LICENSES, INC.)
- WJJR (98.1 FM; RUTLAND, VT; Owner: 6 JOHNSON ROAD LICENSES, INC.)
- WZRT (97.1 FM; RUTLAND, VT; Owner: CAPSTAR TX LIMITED PARTNERSHIP)
- WGLV (91.7 FM; WOODSTOCK, VT; Owner: CHRISTIAN MINISTRIES INC)
- WHDQ-FM1 (106.1 FM; RUTLAND, VT; Owner: GREAT NORTHERN RADIO, L.L.C.)
- WJEN (94.5 FM; RUTLAND, VT; Owner: 6 JOHNSON ROAD LICENSES, INC.)
- WDEV-FM (96.1 FM; WARREN, VT; Owner: RADIO VERMONT, INC.)
- WEQX (102.7 FM; MANCHESTER, VT; Owner: NORTHSHIRE COMMUNICATIONS, INC.)
- WJAN (95.1 FM; SUNDERLAND, VT; Owner: 6 JOHNSON ROAD LICENSES, INC.)
- WVPR (89.5 FM; WINDSOR, VT; Owner: VERMONT PUBLIC RADIO)
- WCVT (101.7 FM; STOWE, VT; Owner: RADIO VERMONT CLASSICS, L.L.C.)
- WXLG (89.9 FM; NORTH CREEK, NY; Owner: THE ST. LAWRENCE UNIVERSITY)
- WWFY (100.9 FM; BERLIN, VT; Owner: VOX ALLEGANY, LLC)
- WHDQ (106.1 FM; CLAREMONT, NH; Owner: GREAT NORTHERN RADIO, L.L.C.)
- WANC (103.9 FM; TICONDEROGA, NY; Owner: WAMC)
- WVPS (107.9 FM; BURLINGTON, VT; Owner: VERMONT PUBLIC RADIO)
- WEZF (92.9 FM; BURLINGTON, VT; Owner: CAPSTAR TX LIMITED PARTNERSHIP)
- WLKC (103.3 FM; WATERBURY, VT; Owner: RADIO BROADCASTING SERVICES, INC.)
- WKBE (100.3 FM; WARRENSBURG, NY; Owner: 6 JOHNSON ROAD LICENSES, INC.)
TV broadcast stations around Hubbardton:
- WVER (Channel 28; RUTLAND, VT; Owner: VERMONT ETV, INC.)
- W61CE (Channel 61; RUTLAND, VT; Owner: MARGARET SANGUINETTI (ADMINISTRATRIX OF THE ESTATE))
- W07AG (Channel 7; RUTLAND, VT; Owner: WNYT INC.)
- W69AR (Channel 69; RUTLAND, VT; Owner: MT. MANSFIELD TELEVISION, INC.)
- National Bridge Inventory (NBI) Statistics
- 3Number of bridges
- 7ft / 2.5mTotal length
- $271,000Total costs
- 5,360Total average daily traffic
- 404Total average daily truck traffic
- 5,628Total future (year 2028) average daily traffic
FCC Registered Amateur Radio Licenses:
1- Call Sign: KB1GXD, Licensee ID: L00365011, Grant Date: 02/16/2012, Expiration Date: 02/16/2022, Cancellation Date: 02/17/2024, Certifier: Richard J Smulczewski, Registrant: Richard J Smulczewski, 513 Old Ti Rd, Hubbardton, VT 05732
2002 - 2018 National Fire Incident Reporting System (NFIRS) incidents
- Fire incident types reported to NFIRS in Hubbardton, VT
- 4542.5%Outside Fires
- 4340.6%Structure Fires
- 109.4%Mobile Property/Vehicle Fires
- 87.5%Other
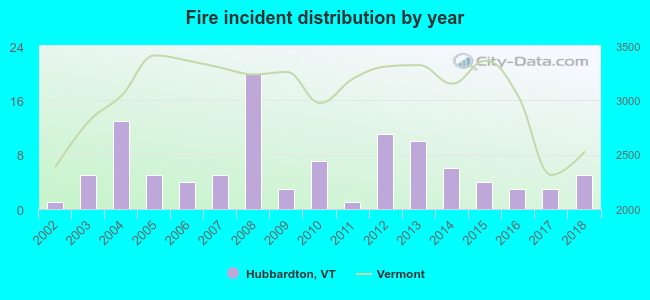 Based on the data from the years 2002 - 2018 the average number of fires per year is 6. The highest number of fire incidents - 20 took place in 2008, and the least - 1 in 2002. The data has a rising trend.
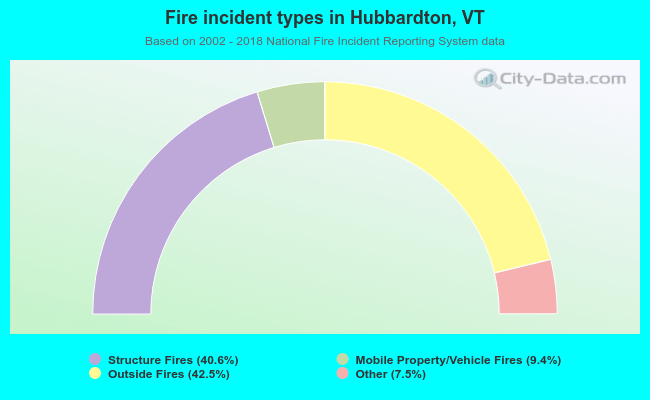 When looking into fire subcategories, the most incidents belonged to: Outside Fires (42.5%), and Structure Fires (40.6%).
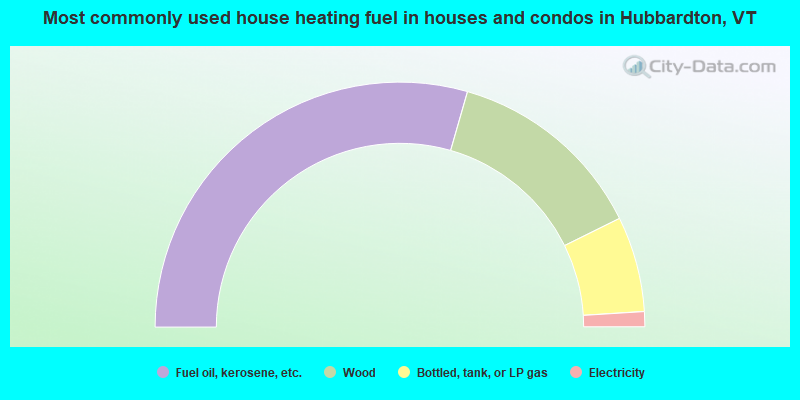
- 58.9%Fuel oil, kerosene, etc.
- 26.5%Wood
- 12.6%Bottled, tank, or LP gas
- 2.0%Electricity
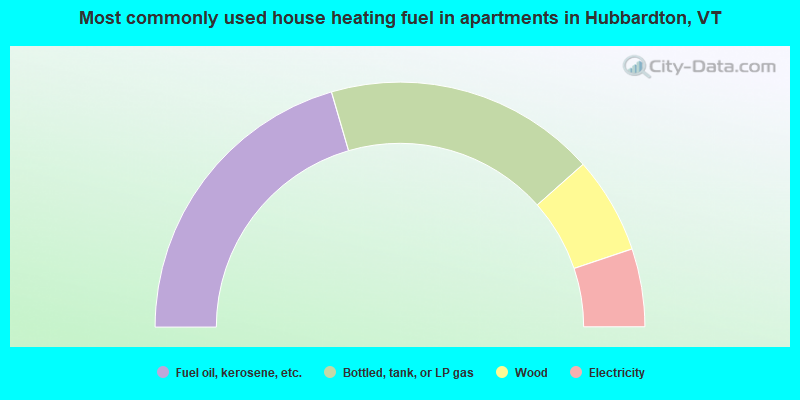
- 41.0%Fuel oil, kerosene, etc.
- 35.9%Bottled, tank, or LP gas
- 12.8%Wood
- 10.3%Electricity
Hubbardton compared to Vermont state average:
- Unemployed percentage below state average.
- Black race population percentage significantly below state average.
- Hispanic race population percentage below state average.
- Renting percentage below state average.
- Length of stay since moving in significantly above state average.
- Number of rooms per house significantly below state average.
- House age significantly below state average.