Kennett: Fire Incidents, Missouri (MO)
Where are fire incidents reported in Kennett, MO
Something went wrong! Please refresh the page.
| Fire incidents reported | |
|---|---|
| Sreet name | Count |
| FIRST ST | 78 |
| JACKSON ST | 64 |
| FIFTH ST | 38 |
| INDEPENDENCE AVE | 26 |
| FLOYD ST | 24 |
| MAIN ST | 24 |
| SIXTH ST | 24 |
| WIMBERLY ST | 24 |
| BALDWIN ST | 22 |
| HOPPER ST | 22 |
| SLICER ST | 22 |
| ELY RD | 20 |
| JACKSON | 20 |
| BLAIR ST | 18 |
| BONNIE LN | 18 |
| KENNETT ST | 18 |
| NINTH ST | 18 |
| WILLOUGHBY | 18 |
| COUNTY ROAD 403 | 16 |
| EVERETT | 16 |
| HARRIS ST | 16 |
| HARRISON ST | 16 |
| HIGHWAY 412 | 16 |
| HOMECREST | 16 |
| HOPPER | 16 |
| INDEPENDENCE | 16 |
| RIGGS ST | 16 |
| RUSSELL | 16 |
| THIRD ST | 16 |
| VANDEVENTER | 16 |
| Other | 655 |
2004 - 2018 National Fire Incident Reporting System (NFIRS) incidents
- Incident types reported to NFIRS in Kennett, MO
- 1,65343.2%Rescue & EMS
- 1,34535.1%Fire
- 3489.1%Service Call
- 1664.3%False Alarm
- 1634.3%Hazardous Condition
- 1443.8%Good Intent Call
- 60.2%Special Incident
- Fire incident types reported to NFIRS in Kennett, MO
- 60545.0%Structure Fires
- 55641.3%Outside Fires
- 15811.7%Mobile Property/Vehicle Fires
- 261.9%Other
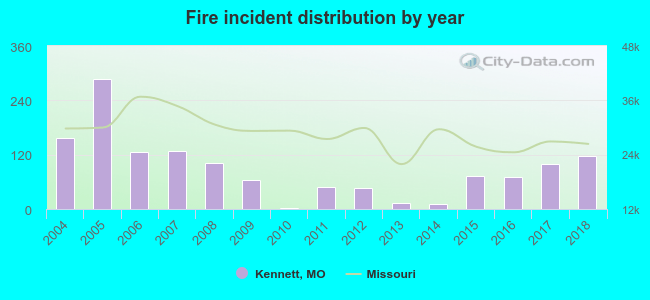 Based on the data from the years 2004 - 2018 the average number of fires per year is 90. The highest number of fire incidents - 287 took place in 2005, and the least - 3 in 2010. The data has a decreasing trend.
The average number of yearly fire incidents per 10k residents in Kennett, MO compared to nearest cities:
(Note: Based on data for the last 3 years, including only cities with population 5,000 and above)
| Kennett: | 88.3 |
| Caruthersville: | 82.0 |
| Dexter: | 38.9 |
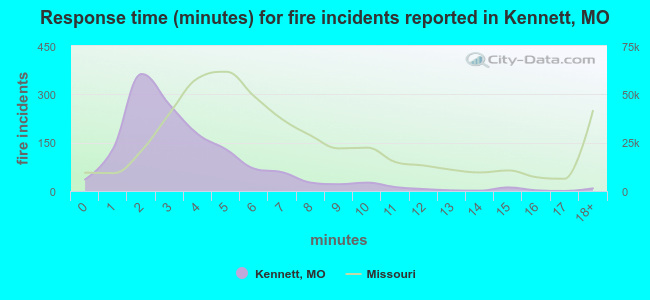 The median response time based on all reported fire incidents is 3 minutes. This is much lower than the state median value.
The median response time in Kennett, MO compared to nearest cities:
(Note: Based on data for all years, including only cities with at least 500 fire incidents)
| Kennett: | 3 minutes |
| Rector: | 7 minutes |
| Caruthersville: | 3 minutes |
| Blytheville: | 4 minutes |
| Malden: | 4 minutes |
| Portageville: | 9 minutes |
| Paragould: | 4 minutes |
| Osceola: | 3 minutes |
| Dexter: | 4 minutes |
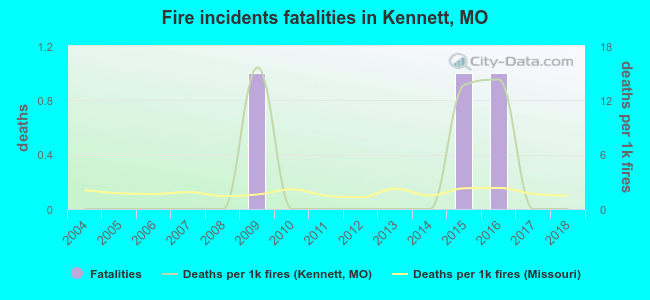 Based on the reports from the years 2004 - 2018 the average number of fire-related fatalities per year is 0. The highest number of reported deaths - 1 took place in 2009, and the lowest - 0 in 2004. The data has a constant trend.
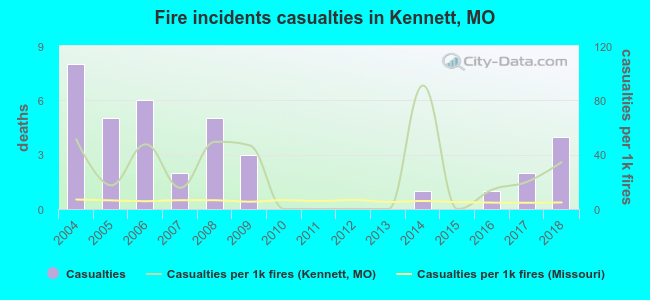 According to the reports from the years 2004 - 2018 the average number of fire-related yearly casualties is 2. The highest number of injuries - 8 took place in 2004, and the lowest - 0 in 2010. The data has a declining trend.
The average number of casualties per 1,000 fire incidents is 26. This indicator was the highest - 91 in 2014, and the lowest 0 in 2010. The trend for injuries per 1,000 fires is declining. Compared to the Missouri value the number of casualties per 1,000 fire incidents is much higher.
According to the reports from the years 2004 - 2018 the average number of fire-related yearly casualties is 2. The highest number of injuries - 8 took place in 2004, and the lowest - 0 in 2010. The data has a declining trend.
The average number of casualties per 1,000 fire incidents is 26. This indicator was the highest - 91 in 2014, and the lowest 0 in 2010. The trend for injuries per 1,000 fires is declining. Compared to the Missouri value the number of casualties per 1,000 fire incidents is much higher.Casualties per 1,000 incidents in Kennett, MO compared to nearest cities:
(Note: Based on data for all years, including only cities with at least 500 fire incidents)
| Kennett: | 27.5 |
| Rector: | 17.6 |
| Caruthersville: | 0.0 |
| Blytheville: | 4.9 |
| Malden: | 0.0 |
| Portageville: | 0.0 |
| Paragould: | 11.7 |
| Osceola: | 1.5 |
| Dexter: | 1.0 |
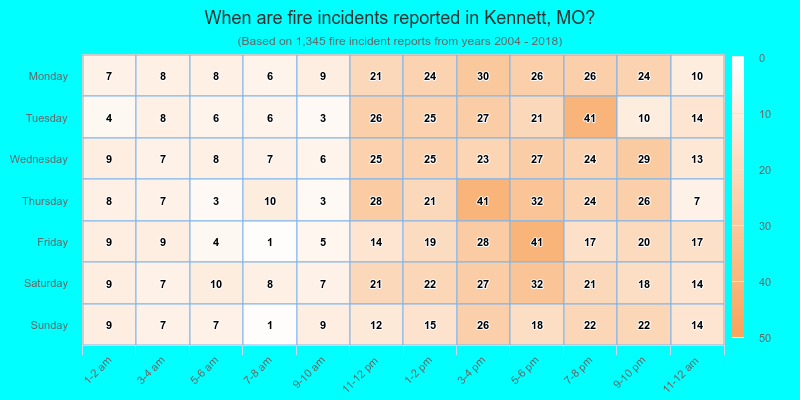
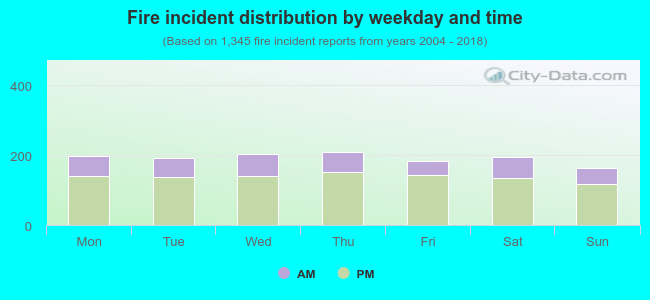 28.4% incidents where reported in the morning and 71.6% in the evening. The most fires (15.6%) took place on Thursday, and the least (12.0%) on Sunday.
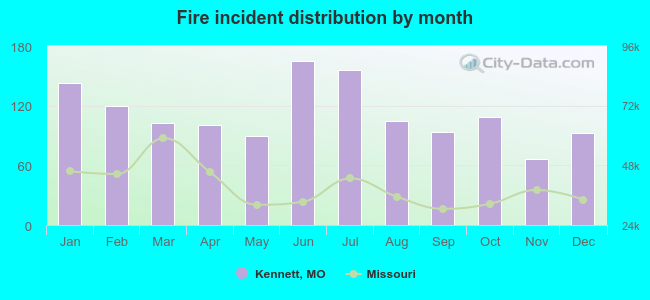 Based on the 1,345 reports from years 2004 - 2018 most fires (12.3%) took place during June, and the least (4.9%) in November.
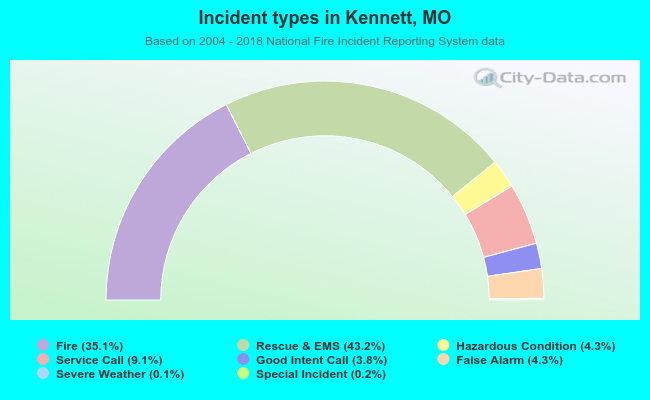 Out of all 3,828 cases reported during the years 2004 - 2018, the most belonged to the categories: Overpressure Rupture (43.2%), Fire (35.1%), and Hazardous Condition (9.1%).
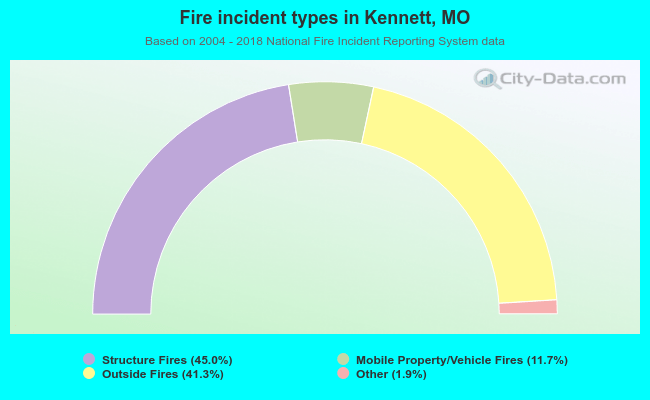 When looking into fire subcategories, the most incidents belonged to: Structure Fires (45.0%), and Outside Fires (41.3%).