Kensington: Fire Incidents, California (CA)
Where are fire incidents reported in Kensington, CA
Something went wrong! Please refresh the page.
|
| |||||||||||||||||||||||||||||||||||||||||||||||||||||||||||||||||||||||||||||||||||||||||||||||||||||||||||||
2005 - 2018 National Fire Incident Reporting System (NFIRS) incidents
- Incident types reported to NFIRS in Kensington, CA
- 71446.0%Rescue & EMS
- 22014.2%Hazardous Condition
- 22014.2%Service Call
- 18311.8%Good Intent Call
- 1117.1%False Alarm
- 1026.6%Fire
- 20.1%Special Incident
- Fire incident types reported to NFIRS in Kensington, CA
- 6563.7%Structure Fires
- 2221.6%Outside Fires
- 109.8%Other
- 54.9%Mobile Property/Vehicle Fires
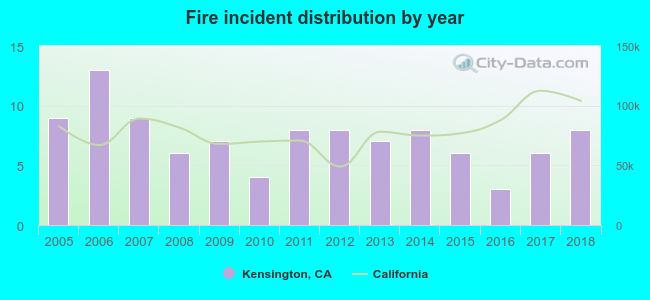 According to the data from the years 2005 - 2018 the average number of fire incidents per year is 7. The highest number of fire incidents - 13 took place in 2006, and the least - 3 in 2016. The data has a dropping trend.
The average number of yearly fire incidents per 10k residents in Kensington, CA compared to nearest cities:
(Note: Based on data for the last 3 years, including only cities with population 5,000 and above)
| Kensington: | 11.2 |
| Albany: | 19.3 |
| El Cerrito: | 25.2 |
| Berkeley: | 22.9 |
| Richmond: | 41.0 |
| El Sobrante: | 14.5 |
| Briones: | 1.5 |
| Emeryville: | 46.3 |
| San Pablo: | 41.0 |
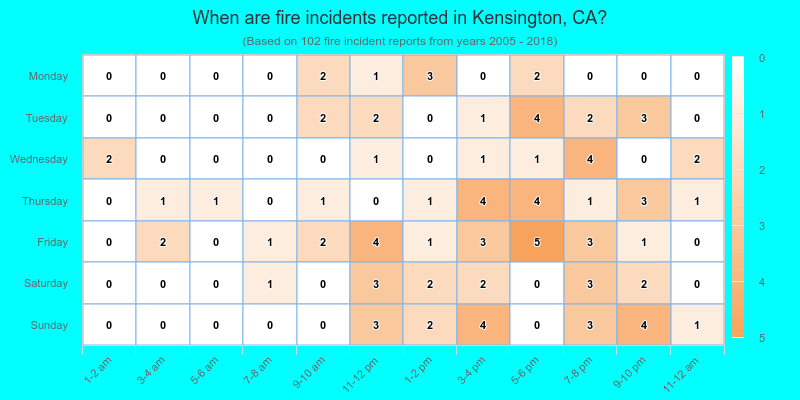
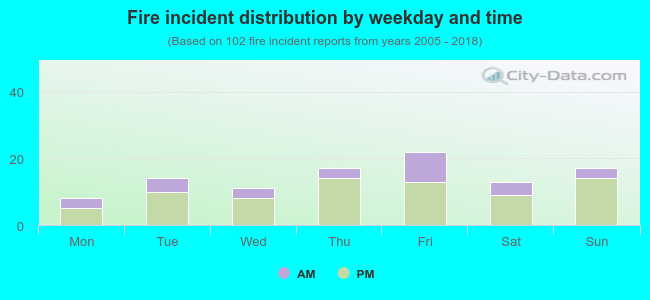 28.4% incidents where reported in the morning and 71.6% in the evening. The most fires (21.6%) took place on Friday, and the least (7.8%) on Monday.
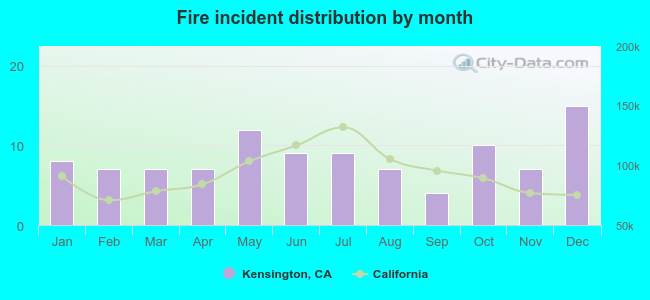 According to the 102 fires from years 2005 - 2018 most fires (14.7%) took place during December, and the least (3.9%) in September.
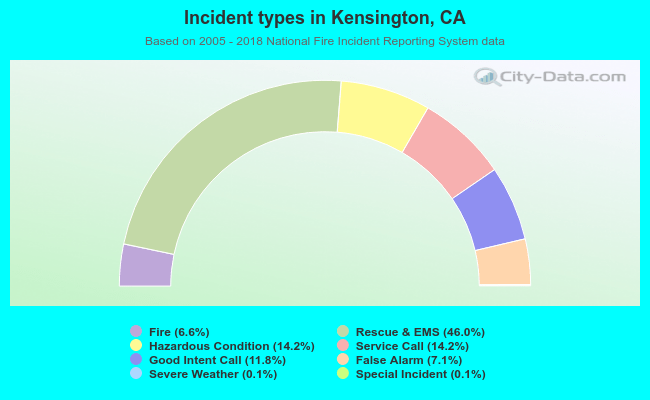 Out of all 1,553 cases reported during the years 2005 - 2018, the most belonged to the categories: Overpressure Rupture (46.0%), Rescue & EMS (14.2%), and Hazardous Condition (14.2%).
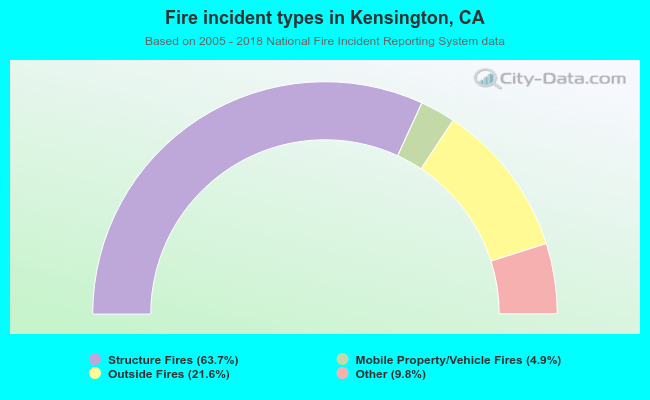 When looking into fire subcategories, the most reports belonged to: Structure Fires (63.7%), and Outside Fires (21.6%).