Kingsville: Fire Incidents, Texas (TX)
Where are fire incidents reported in Kingsville, TX
Something went wrong! Please refresh the page.
| Fire incidents reported | |
|---|---|
| Sreet name | Count |
| HWY 77 HWY | 76 |
| CORRAL RD | 60 |
| CORRAL | 58 |
| KING AVE | 56 |
| 6TH ST | 46 |
| SANTA GERTRUDIS ST | 46 |
| BRAHMA BLVD | 36 |
| KENEDY AVE | 36 |
| GENERAL CAVAZOS BLVD | 32 |
| SANTA GERTRUDIS | 32 |
| JOHNSTON AVE | 30 |
| KING | 30 |
| KLEBERG | 30 |
| 14TH | 28 |
| 14TH ST | 28 |
| CAESAR AVE | 28 |
| 17TH ST | 26 |
| FORDYCE AVE | 24 |
| HWY 77 | 24 |
| RICHARD AVE | 24 |
| YOAKUM | 24 |
| 141 HWY | 22 |
| ALICE | 22 |
| UNIVERSITY BLVD | 22 |
| FM 1355 | 20 |
| HENRIETTA | 20 |
| KENEDY | 20 |
| NETTIE | 20 |
| YOAKUM AVE | 20 |
| 77 HWY | 18 |
| Other | 716 |
2002 - 2018 National Fire Incident Reporting System (NFIRS) incidents
- Incident types reported to NFIRS in Kingsville, TX
- 11,39967.7%Rescue & EMS
- 1,92111.4%Hazardous Condition
- 1,6749.9%Fire
- 7804.6%False Alarm
- 5753.4%Service Call
- 4372.6%Good Intent Call
- 210.1%Special Incident
- Fire incident types reported to NFIRS in Kingsville, TX
- 84350.4%Outside Fires
- 35421.1%Structure Fires
- 25115.0%Mobile Property/Vehicle Fires
- 22613.5%Other
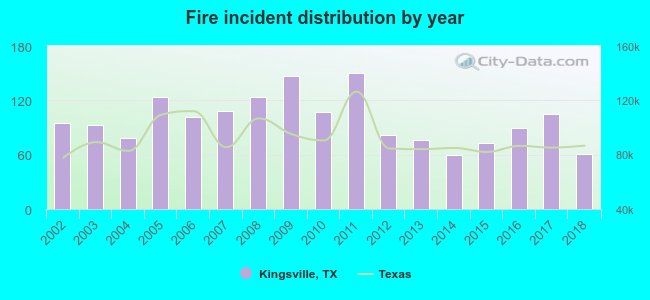 According to the data from the years 2002 - 2018 the average number of fires per year is 98. The highest number of reported fires - 150 took place in 2011, and the least - 60 in 2014. The data has a decreasing trend.
The average number of yearly fire incidents per 10k residents in Kingsville, TX compared to nearest cities:
(Note: Based on data for the last 3 years, including only cities with population 5,000 and above)
| Kingsville: | 32.0 |
| Alice: | 50.7 |
| Robstown: | 106.1 |
| Corpus Christi: | 38.5 |
| Mathis: | 5.3 |
| Portland: | 26.2 |
| Sinton: | 18.6 |
| Ingleside: | 59.1 |
| Aransas Pass: | 93.0 |
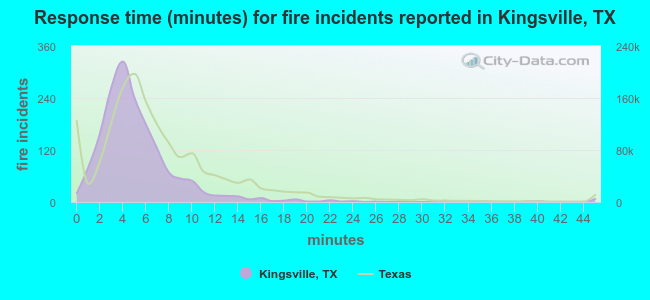 The median response time based on all reported fire incidents is 4 minutes. This is lower compared to the Texas median value.
The median response time in Kingsville, TX compared to nearest cities:
(Note: Based on data for all years, including only cities with at least 500 fire incidents)
| Kingsville: | 4 minutes |
| Alice: | 6 minutes |
| Robstown: | 5 minutes |
| Corpus Christi: | 5 minutes |
| Portland: | 5 minutes |
| Taft: | 10 minutes |
| Ingleside: | 5 minutes |
| Aransas Pass: | 5 minutes |
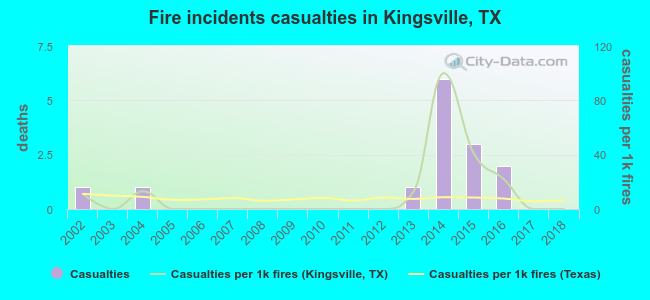 Based on the data from the years 2002 - 2018 the average number of fire-related casualties per year is 1. The highest number of reported casualties - 6 took place in 2014, and the lowest - 0 in 2003. The data has a decreasing trend.
The average number of casualties per 1,000 fires is 12. This indicator was the highest - 100 in 2014, and the lowest 0 in 2003. The trend for casualties per 1,000 fires is decreasing. Compared to the state value the number of casualties per 1,000 fire incidents is about the same.
Based on the data from the years 2002 - 2018 the average number of fire-related casualties per year is 1. The highest number of reported casualties - 6 took place in 2014, and the lowest - 0 in 2003. The data has a decreasing trend.
The average number of casualties per 1,000 fires is 12. This indicator was the highest - 100 in 2014, and the lowest 0 in 2003. The trend for casualties per 1,000 fires is decreasing. Compared to the state value the number of casualties per 1,000 fire incidents is about the same.Casualties per 1,000 incidents in Kingsville, TX compared to nearest cities:
(Note: Based on data for all years, including only cities with at least 500 fire incidents)
| Kingsville: | 8.4 |
| Alice: | 3.7 |
| Robstown: | 1.4 |
| Corpus Christi: | 15.7 |
| Portland: | 4.3 |
| Taft: | 0.0 |
| Ingleside: | 5.2 |
| Aransas Pass: | 0.0 |
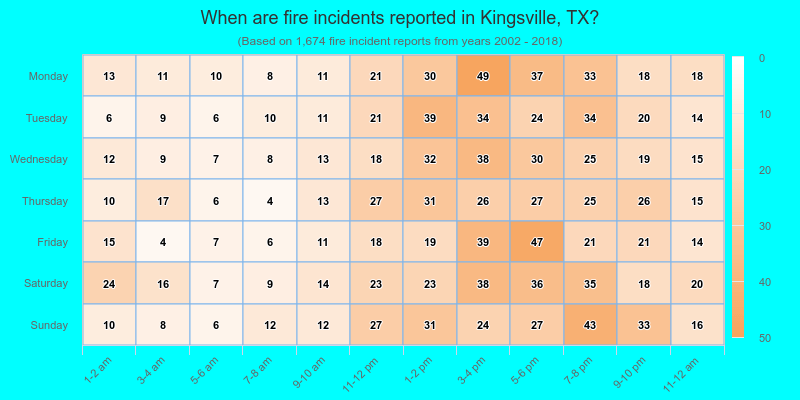
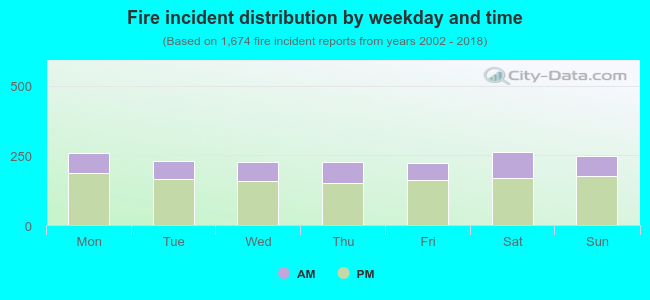 30.5% incidents where reported in the morning and 69.5% in the evening. The most fires (15.7%) took place on Saturday, and the least (13.3%) on Friday.
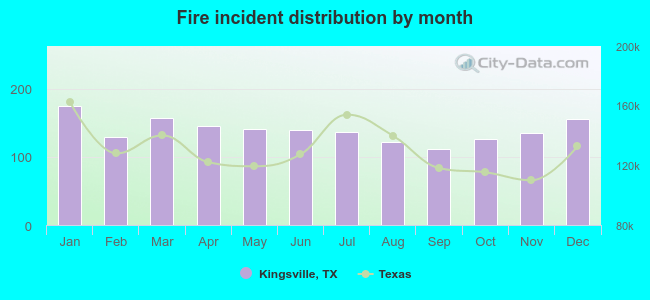 According to the 1,674 fire incident reports from years 2002 - 2018 most fires (10.5%) took place during January, and the least (6.7%) in September.
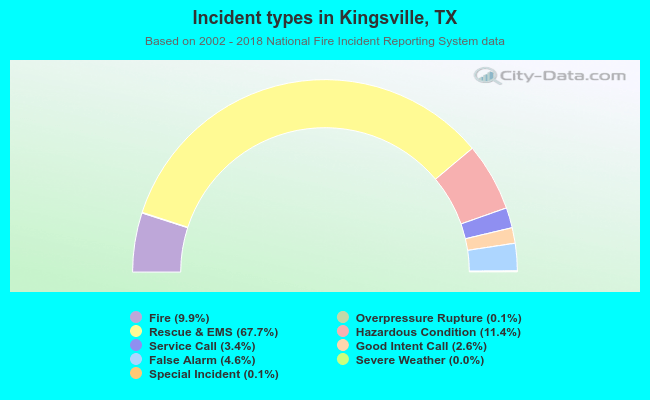 Out of all 16,826 cases reported during the years 2002 - 2018, the most belonged to the categories: Rescue & EMS (67.7%), Hazardous Condition (11.4%), and Fire (9.9%).
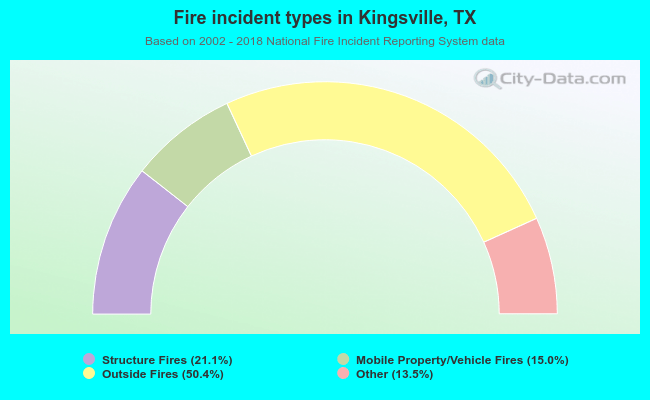 When looking into fire subcategories, the most reports belonged to: Outside Fires (50.4%), and Structure Fires (21.1%).