| Fire incidents reported |
|---|
| Sreet name | Count |
|---|
| SR 29 | 42 | | WHEELER RD | 36 | | SR 80 | 34 | | CASE RD | 18 | | CR 78 | 14 | | HENDRY COUNTY LINE SR 29 | 10 | | PIONEER | 10 | | SEARS RD | 10 | | HELMS RD | 8 | | MAIN ST | 8 | | F RD | 6 | | FORREY DR | 6 | | HENDRY COUNTY LINE CR 846 | 6 | | LITTLEFIELD RD | 6 | | STATE ROUTE 80 | 6 | | 1370 CRESENT AVE | 4 | | 15TH ST | 4 | | 16TH ST | 4 | | CHURCH RD | 4 | | CLARK ST | 4 | | COLLINGSWOOD | 4 | | COWBOY WAY | 4 | | COWBOY WAY | 4 | | COWBOY WAY BLVD | 4 | | CR 846 | 4 |
| | | Fire incidents reported |
|---|
| Sreet name | Count |
|---|
| CRESENT AVE | 4 | | DOUBLE J ACRES RD | 4 | | FT DENAUD RD | 4 | | HELMS RD | 4 | | HELMS ROAD | 4 | | HOWARD RD | 4 | | INDIAN HILLS DR | 4 | | KIRBY RD | 4 | | LEXINGTON | 4 | | LEXINGTON PKWY | 4 | | OUT OF DISTRICT | 4 | | RAINTREE | 4 | | S.R. 29 | 4 | | WELLINGTON | 4 | | WHIDDEN RD | 4 | | 1000 WHIDDEN ROAD | 2 | | 10000 E STATE ROUTE 80 | 2 | | 1049 CALOOSA TERRACE | 2 | | 1055 CHRIST ST | 2 | | 1123 SUNSET TRAIL | 2 | | 1161 NAIRN LN | 2 | | 1171 PINE AVE | 2 | | 1202 ALICE ST | 2 | | 1361 CORNELIA DR | 2 | | |
|
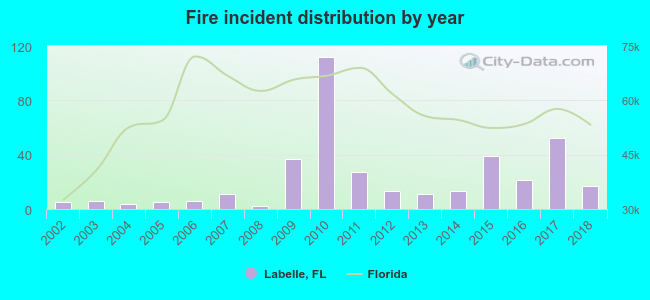 Based on the data from the years 2002 - 2018 the average number of fires per year is 22. The highest number of fire incidents - 112 took place in 2010, and the least - 2 in 2008. The data has an increasing trend.
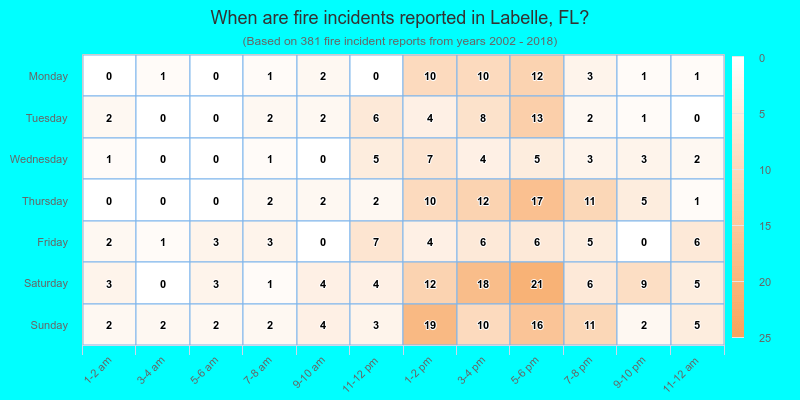
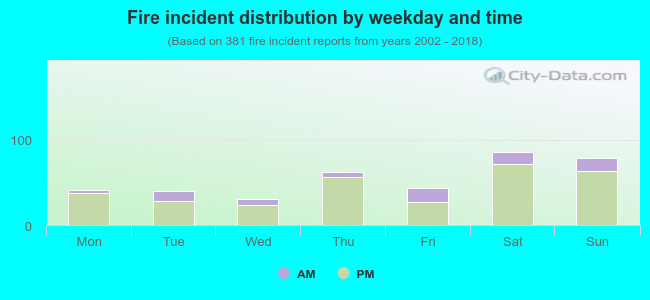 19.7% incidents where reported in the morning and 80.3% in the evening. The most fires (22.6%) took place on Saturday, and the least (8.1%) on Wednesday.
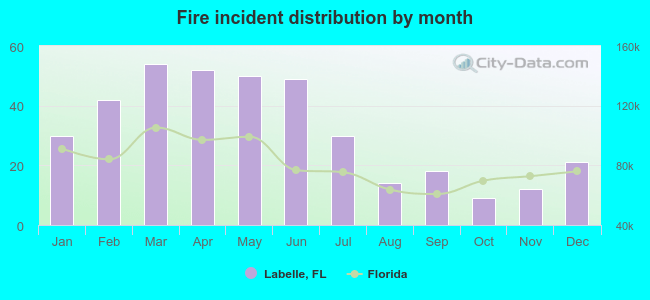 According to the 381 reports from years 2002 - 2018 most fires (14.2%) took place during March, and the least (2.4%) in October.
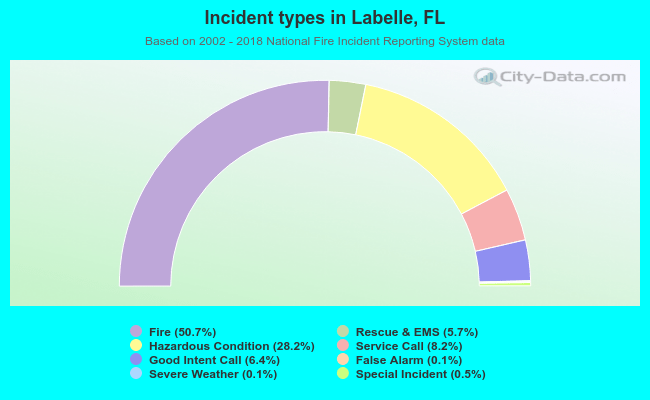 Out of all 752 cases reported during the years 2002 - 2018, the most belonged to the categories: Fire (50.7%), Rescue & EMS (28.2%), and Hazardous Condition (8.2%).
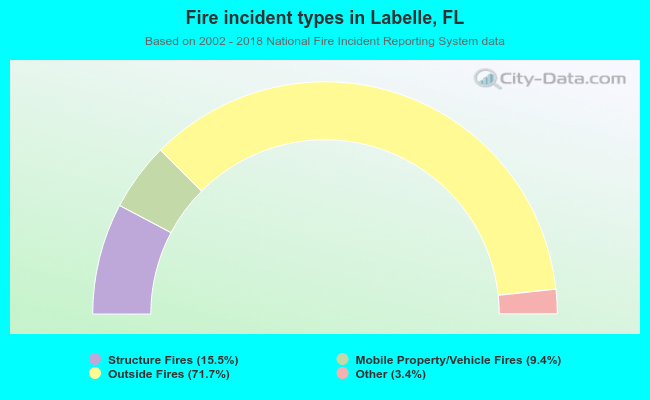 When looking into fire subcategories, the most incidents belonged to: Outside Fires (71.7%), and Structure Fires (15.5%).