Lebanon: Fire Incidents, Oregon (OR)
Where are fire incidents reported in Lebanon, OR
Something went wrong! Please refresh the page.
| Fire incidents reported | |
|---|---|
| Sreet name | Count |
| SANTIAM HWY | 250 |
| MAIN ST | 96 |
| BERLIN RD | 68 |
| LACOMB DR | 66 |
| 5TH ST | 62 |
| 2ND ST | 58 |
| ROCK HILL DR | 58 |
| BREWSTER RD | 50 |
| CASCADE DR | 50 |
| 7TH ST | 48 |
| OAK ST | 48 |
| SHERMAN ST | 44 |
| WHEELER ST | 44 |
| MCDOWELL CREEK DR | 42 |
| GROVE ST | 40 |
| RIVER DR | 40 |
| SAND RIDGE RD | 40 |
| MOUNT HOPE DR | 38 |
| TENNESSEE RD | 38 |
| 12TH ST | 34 |
| GRANT ST | 34 |
| ROSE ST | 32 |
| HANSARD AVE | 30 |
| MILTON ST | 30 |
| WEIRICH DR | 30 |
| 9TH ST | 28 |
| ASH ST | 28 |
| PARK ST | 26 |
| 8TH ST | 24 |
| AIRPORT RD | 24 |
| Other | 155 |
2002 - 2018 National Fire Incident Reporting System (NFIRS) incidents
- Incident types reported to NFIRS in Lebanon, OR
- 11,26964.9%Rescue & EMS
- 2,32713.4%Service Call
- 1,6559.5%Fire
- 1,2066.9%Good Intent Call
- 5333.1%Hazardous Condition
- 3632.1%False Alarm
- Fire incident types reported to NFIRS in Lebanon, OR
- 69041.7%Structure Fires
- 68241.2%Outside Fires
- 26215.8%Mobile Property/Vehicle Fires
- 211.3%Other
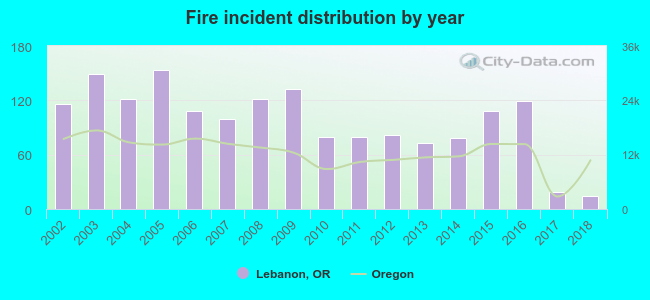 According to the data from the years 2002 - 2018 the average number of fires per year is 97. The highest number of reported fire incidents - 154 took place in 2005, and the least - 14 in 2018. The data has a declining trend.
The average number of yearly fire incidents per 10k residents in Lebanon, OR compared to nearest cities:
(Note: Based on data for the last 3 years, including only cities with population 5,000 and above)
| Lebanon: | 31.7 |
| Albany: | 12.8 |
| Sweet Home: | 30.3 |
| Corvallis: | 10.1 |
| Stayton: | 34.4 |
| Junction City: | 44.4 |
| Independence: | 14.4 |
| Monmouth: | 14.7 |
| Four Corners: | 1.9 |
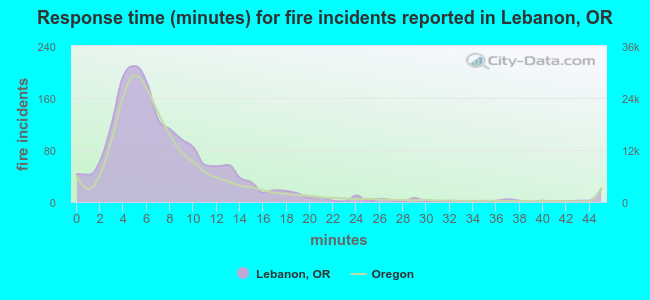 The median response time based on all reported fire incidents is 6 minutes. This is close to the state median value.
The median response time in Lebanon, OR compared to nearest cities:
(Note: Based on data for all years, including only cities with at least 500 fire incidents)
| Lebanon: | 6 minutes |
| Albany: | 6 minutes |
| Sweet Home: | 7 minutes |
| Corvallis: | 6 minutes |
| Stayton: | 8 minutes |
| Turner: | 10 minutes |
| Junction City: | 9 minutes |
| Salem: | 5 minutes |
| Keizer: | 5 minutes |
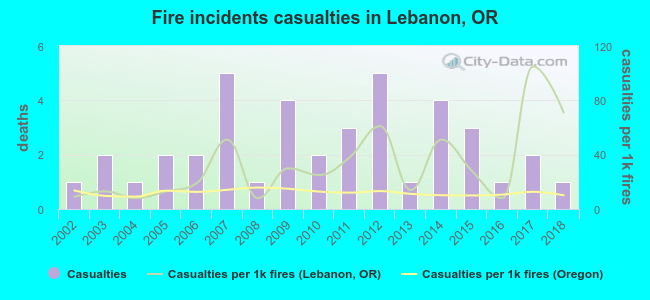 According to the reports from the years 2002 - 2018 the average number of fire-related yearly casualties is 2. The highest number of casualties - 5 took place in 2007, and the lowest - 1 in 2002. The data has a constant trend.
The average number of casualties per 1,000 fire incidents is 32. This indicator was the highest - 105 in 2017, and the lowest 8 in 2004. The trend for casualties per 1,000 fire incidents is growing. Compared to the Oregon value the number of injuries per 1,000 incidents is much higher.
According to the reports from the years 2002 - 2018 the average number of fire-related yearly casualties is 2. The highest number of casualties - 5 took place in 2007, and the lowest - 1 in 2002. The data has a constant trend.
The average number of casualties per 1,000 fire incidents is 32. This indicator was the highest - 105 in 2017, and the lowest 8 in 2004. The trend for casualties per 1,000 fire incidents is growing. Compared to the Oregon value the number of injuries per 1,000 incidents is much higher.Casualties per 1,000 incidents in Lebanon, OR compared to nearest cities:
(Note: Based on data for all years, including only cities with at least 500 fire incidents)
| Lebanon: | 24.2 |
| Albany: | 14.5 |
| Sweet Home: | 20.6 |
| Corvallis: | 5.4 |
| Stayton: | 23.3 |
| Turner: | 3.5 |
| Junction City: | 7.4 |
| Salem: | 22.6 |
| Keizer: | 22.5 |
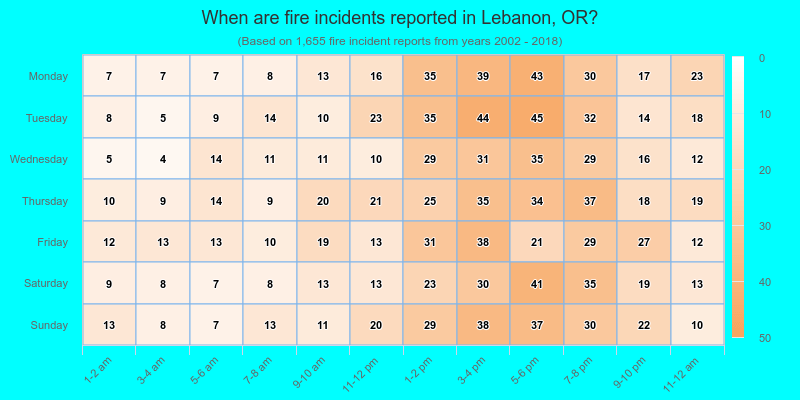
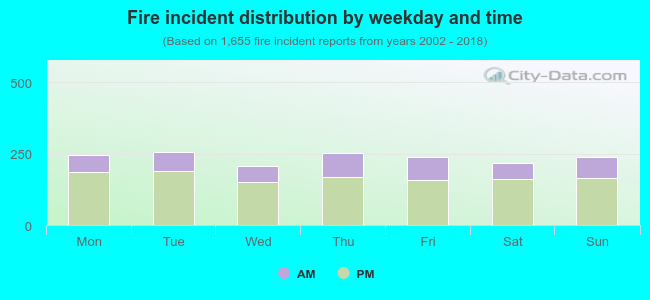 28.7% incidents where reported in the morning and 71.3% in the evening. The most fires (15.5%) took place on Tuesday, and the least (12.5%) on Wednesday.
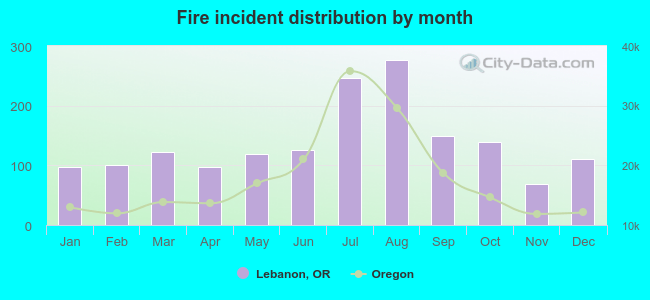 According to the 1,655 fire incident reports from years 2002 - 2018 most fires (16.7%) took place during August, and the least (4.1%) in November.
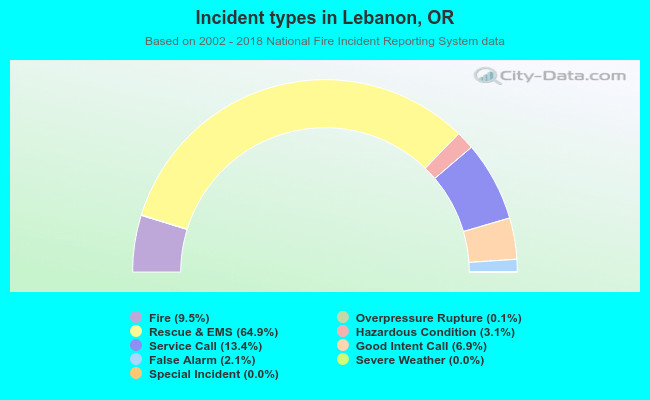 Out of all 17,365 cases reported during the years 2002 - 2018, the most belonged to the categories: Rescue & EMS (64.9%), Service Call (13.4%), and Fire (9.5%).
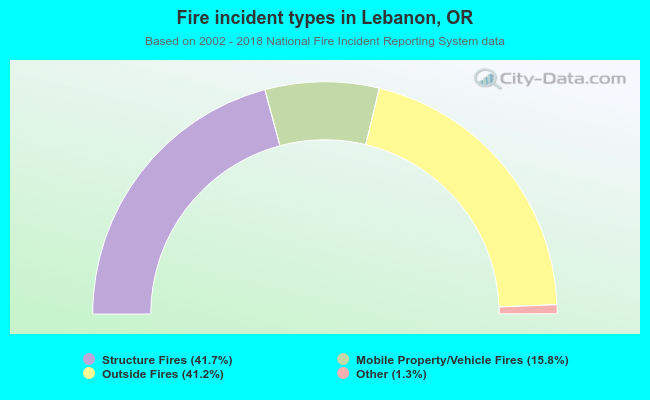 When looking into fire subcategories, the most reports belonged to: Structure Fires (41.7%), and Outside Fires (41.2%).