Levittown: Fire Incidents, New York (NY)
Where are fire incidents reported in Levittown, NY
Something went wrong! Please refresh the page.
| Fire incidents reported | |
|---|---|
| Sreet name | Count |
| HEMPSTEAD TPKE | 226 |
| HEMPSTEAD TPKE TPKE | 146 |
| CENTER LN LN | 52 |
| CENTER LN | 40 |
| GARDINERS AV | 36 |
| DIVISION AV | 34 |
| GARDINERS AV AVE | 26 |
| AZALEA RD | 22 |
| BLACKSMITH RD | 22 |
| AZALEA RD RD | 18 |
| SHELTER LN | 16 |
| ORCHID RD | 14 |
| POLARIS DR | 14 |
| ABBEY LN | 12 |
| ABBEY LN LN | 12 |
| BLACKSMITH RD RD | 12 |
| DIVISION AV AVE | 12 |
| HICKORY LN | 12 |
| JERUSALEM AV | 12 |
| KINGFISHER RD | 12 |
| MERIDIAN RD RD | 12 |
| NORTH NEWBRIDGE ROAD | 12 |
| PERIWINKLE RD | 12 |
| WANTAGH AV | 12 |
| WANTAGH STATE PARKWAY | 12 |
| WOODCOCK LN | 12 |
| BOBOLINK LN | 10 |
| PERIWINKLE RD RD | 10 |
| RANCH LN | 10 |
| BALSAM LN | 8 |
| Other | 100 |
2003 - 2018 National Fire Incident Reporting System (NFIRS) incidents
- Incident types reported to NFIRS in Levittown, NY
- 3,13541.9%Rescue & EMS
- 1,35318.1%Hazardous Condition
- 1,09714.7%False Alarm
- 96012.8%Fire
- 4646.2%Good Intent Call
- 4225.6%Service Call
- 220.3%Special Incident
- 130.2%Overpressure Rupture
- 110.1%Severe Weather
- Fire incident types reported to NFIRS in Levittown, NY
- 40542.2%Outside Fires
- 38039.6%Structure Fires
- 10811.3%Mobile Property/Vehicle Fires
- 677.0%Other
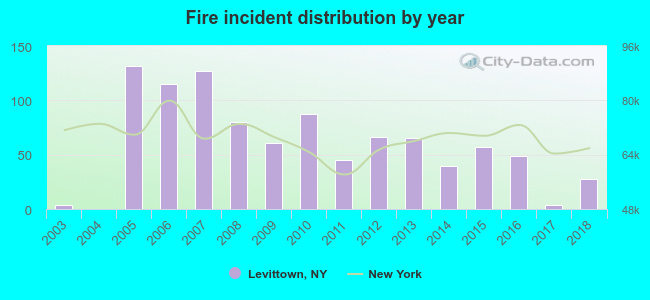 Based on the data from the years 2003 - 2018 the average number of fire incidents per year is 60. The highest number of reported fire incidents - 132 took place in 2005, and the least - 0 in 2004. The data has an increasing trend.
The average number of yearly fire incidents per 10k residents in Levittown, NY compared to nearest cities:
(Note: Based on data for the last 3 years, including only cities with population 5,000 and above)
| Levittown: | 5.2 |
| Bethpage: | 13.2 |
| East Meadow: | 3.1 |
| North Massapequa: | 2.1 |
| Hicksville: | 9.9 |
| North Bellmore: | 5.8 |
| Salisbury: | 5.0 |
| Wantagh: | 9.5 |
| South Farmingdale: | 6.7 |
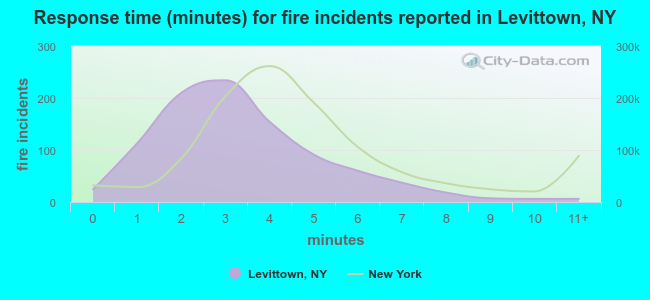 The median response time based on all reported fire incidents is 3 minutes. This is lower compared to the state median value.
The median response time in Levittown, NY compared to nearest cities:
(Note: Based on data for all years, including only cities with at least 500 fire incidents)
| Levittown: | 3 minutes |
| Hicksville: | 4 minutes |
| Massapequa: | 6 minutes |
| Hempstead: | 3 minutes |
| Amityville: | 5 minutes |
| Freeport: | 3 minutes |
| Baldwin: | 4 minutes |
| Copiague: | 4 minutes |
| Garden City: | 3 minutes |
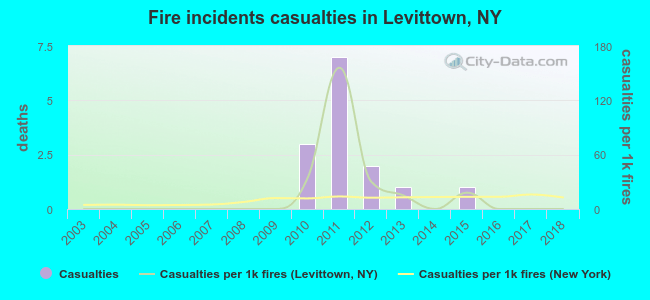 Based on the reports from the years 2003 - 2018 the average number of fire-related yearly casualties is 1. The highest number of reported casualties - 7 took place in 2011, and the lowest - 0 in 2003. The data has a constant trend.
The average number of injuries per 1,000 fire incidents is 16. This indicator was the highest - 156 in 2011, and the lowest 0 in 2003. The trend for casualties per 1,000 fire incidents is constant. Compared to the state value the number of casualties per 1,000 incidents is higher.
Based on the reports from the years 2003 - 2018 the average number of fire-related yearly casualties is 1. The highest number of reported casualties - 7 took place in 2011, and the lowest - 0 in 2003. The data has a constant trend.
The average number of injuries per 1,000 fire incidents is 16. This indicator was the highest - 156 in 2011, and the lowest 0 in 2003. The trend for casualties per 1,000 fire incidents is constant. Compared to the state value the number of casualties per 1,000 incidents is higher.Casualties per 1,000 incidents in Levittown, NY compared to nearest cities:
(Note: Based on data for all years, including only cities with at least 500 fire incidents)
| Levittown: | 14.6 |
| Hicksville: | 27.9 |
| Massapequa: | 3.8 |
| Hempstead: | 21.2 |
| Amityville: | 2.1 |
| Freeport: | 46.4 |
| Baldwin: | 1.2 |
| Copiague: | 1.7 |
| Garden City: | 11.3 |
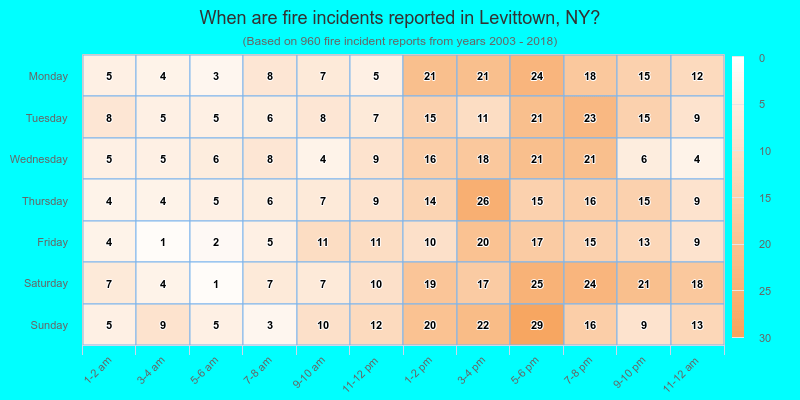
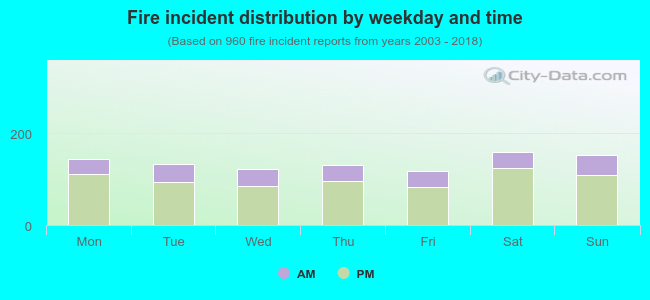 26.8% incidents where reported in the morning and 73.2% in the evening. The most fires (16.7%) took place on Saturday, and the least (12.3%) on Friday.
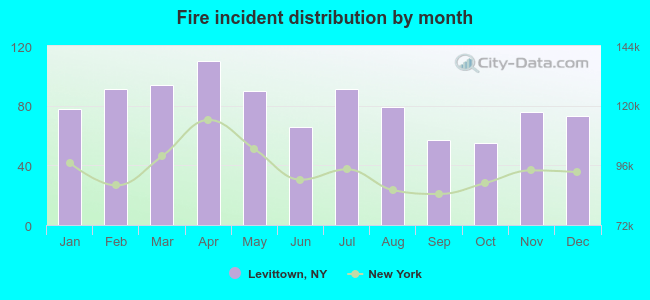 Based on the 960 fire incident reports from years 2003 - 2018 most fires (11.5%) took place during April, and the least (5.7%) in October.
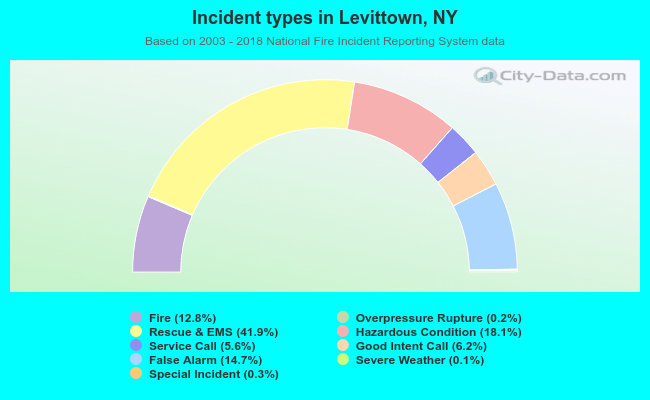 Out of all 7,477 cases reported during the years 2003 - 2018, the most belonged to the categories: Rescue & EMS (41.9%), Hazardous Condition (18.1%), and False Alarm (14.7%).
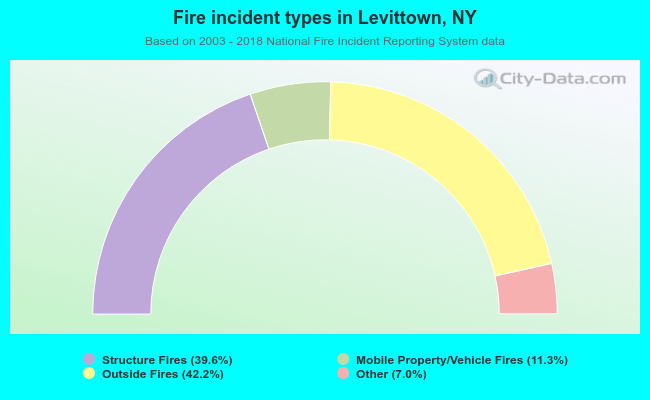 When looking into fire subcategories, the most incidents belonged to: Outside Fires (42.2%), and Structure Fires (39.6%).