McCordsville: Fire Incidents, Indiana (IN)
Where are fire incidents reported in McCordsville, IN
Something went wrong! Please refresh the page.
|
| |||||||||||||||||||||||||||||||||||||||||||||||||||||||||||||||||||||||||||||||||||||||||||||||||||||||||||||
2002 - 2018 National Fire Incident Reporting System (NFIRS) incidents
- Incident types reported to NFIRS in McCordsville, IN
- 92752.3%Rescue & EMS
- 25214.2%Fire
- 19010.7%Good Intent Call
- 1629.1%Hazardous Condition
- 1428.0%False Alarm
- 925.2%Service Call
- 50.3%Severe Weather
- 20.1%Overpressure Rupture
- Fire incident types reported to NFIRS in McCordsville, IN
- 11846.8%Structure Fires
- 10541.7%Outside Fires
- 249.5%Mobile Property/Vehicle Fires
- 52.0%Other
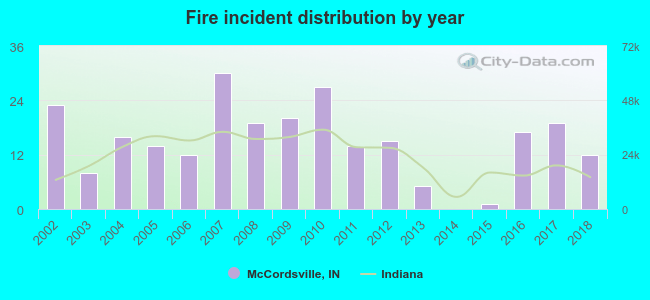 Based on the data from the years 2002 - 2018 the average number of fire incidents per year is 15. The highest number of reported fires - 30 took place in 2007, and the least - 0 in 2014. The data has a dropping trend.
The average number of yearly fire incidents per 10k residents in McCordsville, IN compared to nearest cities:
(Note: Based on data for the last 3 years, including only cities with population 5,000 and above)
| McCordsville: | 29.4 |
| Lawrence: | 15.2 |
| Fishers: | 4.8 |
| Greenfield: | 36.8 |
| Carmel: | 2.9 |
| Noblesville: | 17.4 |
| Indianapolis: | 5.2 |
| Westfield: | 17.8 |
| Beech Grove: | 10.3 |
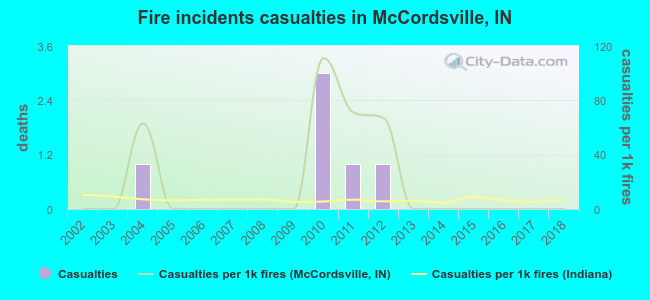 According to the data from the years 2002 - 2018 the average number of fire-related casualties per year is 0. The highest number of reported injuries - 3 took place in 2010, and the lowest - 0 in 2002. The data has a constant trend.
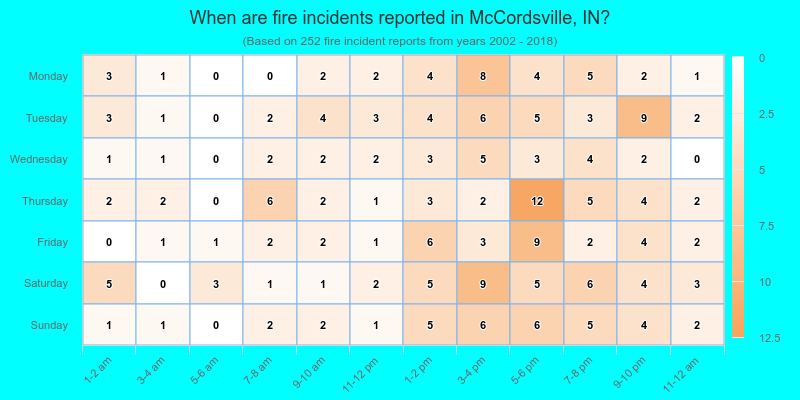
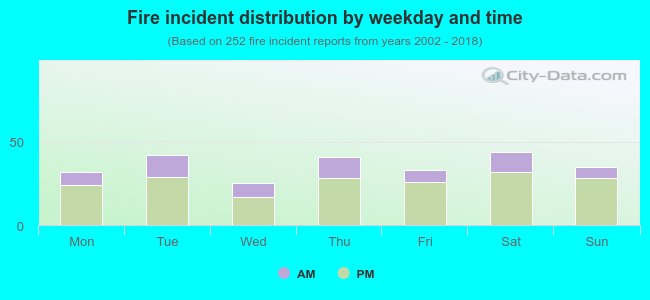 27.0% incidents where reported in the morning and 73.0% in the evening. The most fires (17.5%) took place on Saturday, and the least (9.9%) on Wednesday.
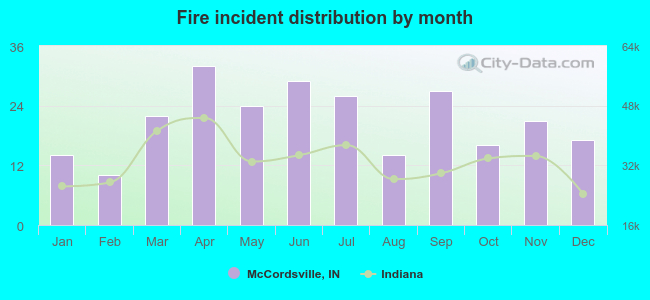 According to the 252 incident reports from years 2002 - 2018 most fires (12.7%) took place during April, and the least (4.0%) in February.
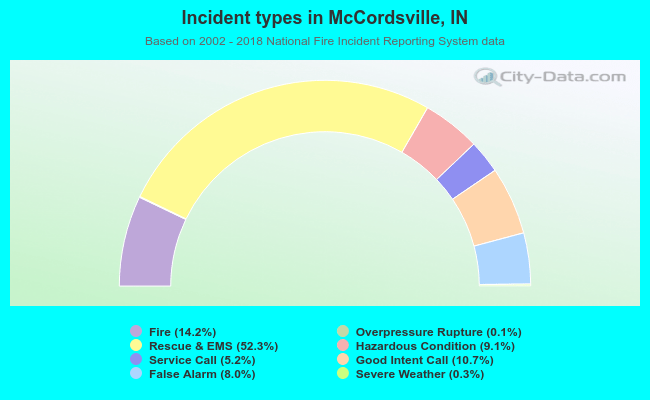 Out of all 1,772 cases reported during the years 2002 - 2018, the most belonged to the categories: Rescue & EMS (52.3%), Fire (14.2%), and Good Intent Call (10.7%).
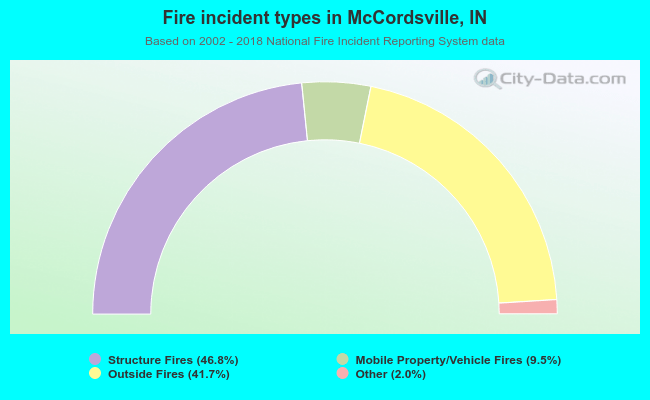 When looking into fire subcategories, the most reports belonged to: Structure Fires (46.8%), and Outside Fires (41.7%).