Beech Grove: Fire Incidents, Indiana (IN)
Where are fire incidents reported in Beech Grove, IN
Something went wrong! Please refresh the page.
| Fire incidents reported | |
|---|---|
| Sreet name | Count |
| ALBANY ST | 86 |
| EMERSON AVE | 64 |
| CHURCHMAN AVE | 48 |
| DIPLOMAT CT | 48 |
| MAIN ST | 44 |
| 9TH. AVE | 42 |
| 2ND. AVE | 34 |
| 465 | 34 |
| 9TH AVE | 30 |
| BETHEL AVE | 28 |
| 6TH. AVE | 22 |
| ELMWOOD AVE | 22 |
| 17TH. AVE | 20 |
| CHURCHMAN PL | 20 |
| MIMI DR | 20 |
| GARSTANG | 18 |
| 5TH AVE | 16 |
| 5TH. AVE | 16 |
| 6TH AVE | 16 |
| 7TH. AVE | 16 |
| 8TH. AVE | 16 |
| 1ST. AVE | 14 |
| 4TH. AVE | 14 |
| 8TH AVE | 14 |
| BYLAND DR | 14 |
| EMERSON AV | 14 |
| GROVEWOOD PL | 14 |
| NIKKI DR | 14 |
| MALDEN LANE | 12 |
| MALDEN LN | 12 |
2002 - 2016 National Fire Incident Reporting System (NFIRS) incidents
- Incident types reported to NFIRS in Beech Grove, IN
- 1,82351.0%Rescue & EMS
- 70119.6%Fire
- 55615.6%Hazardous Condition
- 1905.3%Good Intent Call
- 1674.7%False Alarm
- 1042.9%Service Call
- 140.4%Special Incident
- 120.3%Overpressure Rupture
- 50.1%Severe Weather
- Fire incident types reported to NFIRS in Beech Grove, IN
- 27439.1%Structure Fires
- 23333.2%Outside Fires
- 12918.4%Mobile Property/Vehicle Fires
- 659.3%Other
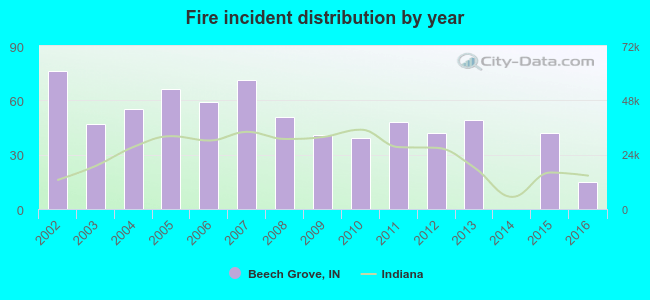 Based on the data from the years 2002 - 2016 the average number of fires per year is 47. The highest number of reported fires - 76 took place in 2002, and the least - 0 in 2014. The data has a declining trend.
The average number of yearly fire incidents per 10k residents in Beech Grove, IN compared to nearest cities:
(Note: Based on data for the last 3 years, including only cities with population 5,000 and above)
| Beech Grove: | 10.3 |
| Indianapolis: | 5.2 |
| Greenwood: | 12.8 |
| Speedway: | 40.2 |
| New Whiteland: | 22.9 |
| Lawrence: | 15.2 |
| Bargersville: | 39.2 |
| McCordsville: | 29.4 |
| Plainfield: | 9.8 |
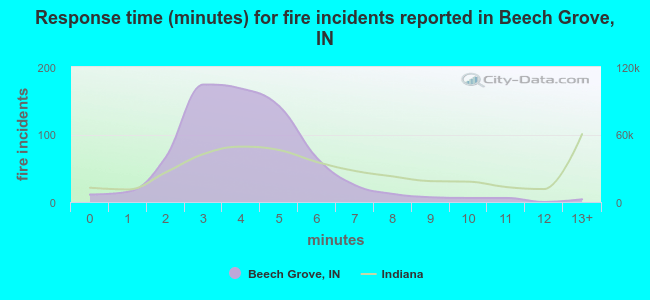 The median response time based on all reported fire incidents is 4 minutes. This is lower than the state median value.
The median response time in Beech Grove, IN compared to nearest cities:
(Note: Based on data for all years, including only cities with at least 500 fire incidents)
| Beech Grove: | 4 minutes |
| Indianapolis: | 6 minutes |
| Greenwood: | 6 minutes |
| New Palestine: | 6 minutes |
| Bargersville: | 7 minutes |
| Fairland: | 8 minutes |
| Plainfield: | 6 minutes |
| Franklin: | 4 minutes |
| Avon: | 7 minutes |
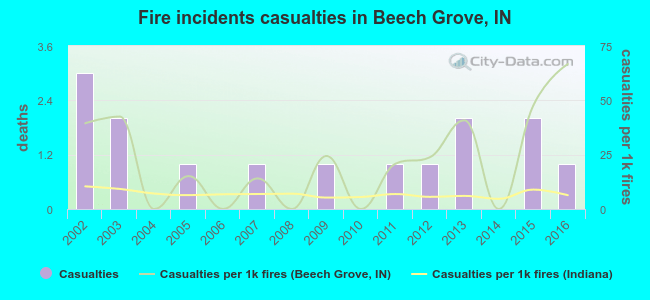 Based on the data from the years 2002 - 2016 the average number of fire-related yearly casualties is 1. The highest number of casualties - 3 took place in 2002, and the lowest - 0 in 2004. The data has a decreasing trend.
The average number of injuries per 1,000 fires is 22. This indicator was the highest - 67 in 2016, and the lowest 0 in 2004. The trend for injuries per 1,000 fire incidents is growing. Compared to the state value the number of casualties per 1,000 incidents is much higher.
Based on the data from the years 2002 - 2016 the average number of fire-related yearly casualties is 1. The highest number of casualties - 3 took place in 2002, and the lowest - 0 in 2004. The data has a decreasing trend.
The average number of injuries per 1,000 fires is 22. This indicator was the highest - 67 in 2016, and the lowest 0 in 2004. The trend for injuries per 1,000 fire incidents is growing. Compared to the state value the number of casualties per 1,000 incidents is much higher.Casualties per 1,000 incidents in Beech Grove, IN compared to nearest cities:
(Note: Based on data for all years, including only cities with at least 500 fire incidents)
| Beech Grove: | 21.4 |
| Indianapolis: | 4.7 |
| Greenwood: | 5.9 |
| New Palestine: | 6.5 |
| Bargersville: | 7.1 |
| Fairland: | 1.6 |
| Plainfield: | 33.4 |
| Franklin: | 0.8 |
| Avon: | 2.4 |
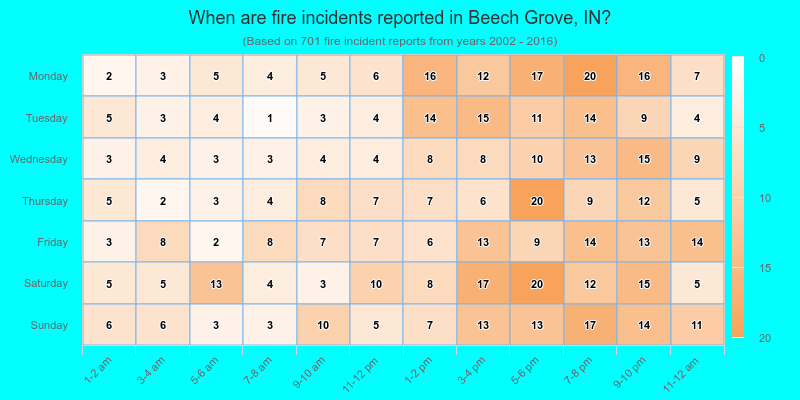
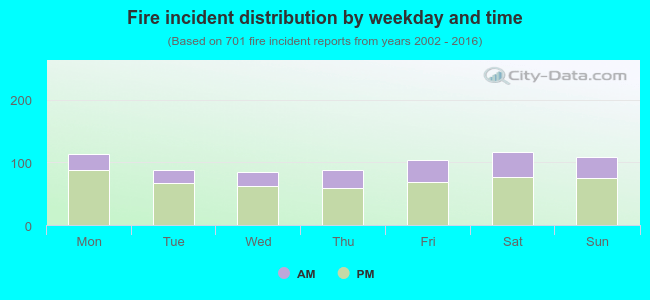 29.0% incidents where reported in the morning and 71.0% in the evening. The most fires (16.7%) took place on Saturday, and the least (12.0%) on Wednesday.
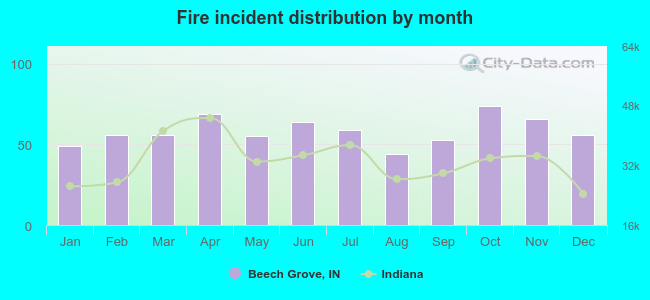 Based on the 701 fires from years 2002 - 2016 most fires (10.6%) took place during October, and the least (6.3%) in August.
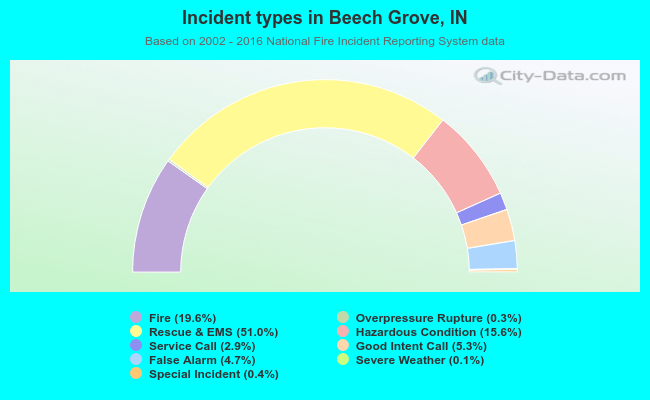 Out of all 3,572 cases reported during the years 2002 - 2016, the most belonged to the categories: Rescue & EMS (51.0%), Fire (19.6%), and Hazardous Condition (15.6%).
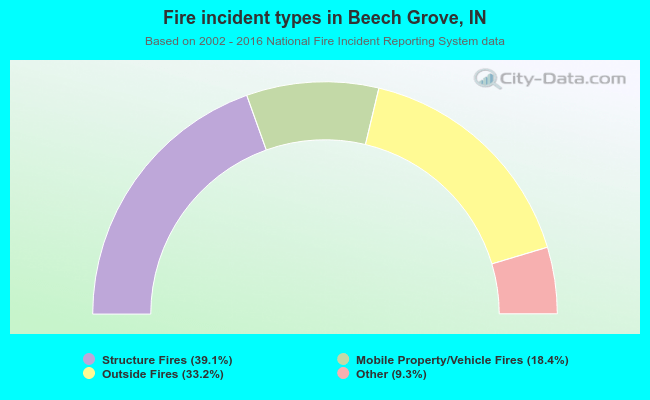 When looking into fire subcategories, the most incidents belonged to: Structure Fires (39.1%), and Outside Fires (33.2%).