Plainfield: Fire Incidents, Indiana (IN)
Where are fire incidents reported in Plainfield, IN
Something went wrong! Please refresh the page.
| Fire incidents reported | |
|---|---|
| Sreet name | Count |
| MAIN ST | 316 |
| PERRY RD | 156 |
| MAIN (PLAINFIELD) ST | 84 |
| SR 267 | 64 |
| MAINPLAINFIELD ST | 52 |
| CAMBRIDGE WAY | 48 |
| CLARKS CREEK RD | 42 |
| AIRWEST BLVD | 40 |
| PINEWOOD DR | 38 |
| CENTER ST | 36 |
| SOUTHFIELD DR | 36 |
| STAFFORD RD | 36 |
| CLOVER DR | 34 |
| MILL RUN DR | 34 |
| GATEWAY DR | 30 |
| AIRTECH PKY | 26 |
| US 40 | 26 |
| I 70 (64 MM) | 24 |
| RONALD REAGAN PKY | 24 |
| CROWN PLAZA BLVD | 22 |
| HARVEST WAY | 20 |
| LARGO LANE | 18 |
| MAIN | 18 |
| VINE ST | 18 |
| BLACK OAK DR | 16 |
| FUTURA PARK WAY | 16 |
| LINCOLN ST | 16 |
| SARATOGA PKY | 16 |
| STANLEY RD | 16 |
| SUGAR LN | 16 |
| Other | 310 |
2002 - 2017 National Fire Incident Reporting System (NFIRS) incidents
- Incident types reported to NFIRS in Plainfield, IN
- 5,22352.6%Rescue & EMS
- 1,64816.6%Fire
- 1,17911.9%Hazardous Condition
- 9339.4%Good Intent Call
- 4955.0%Service Call
- 3923.9%False Alarm
- 210.2%Overpressure Rupture
- 200.2%Severe Weather
- 200.2%Special Incident
- Fire incident types reported to NFIRS in Plainfield, IN
- 71943.6%Structure Fires
- 52631.9%Outside Fires
- 30918.8%Mobile Property/Vehicle Fires
- 945.7%Other
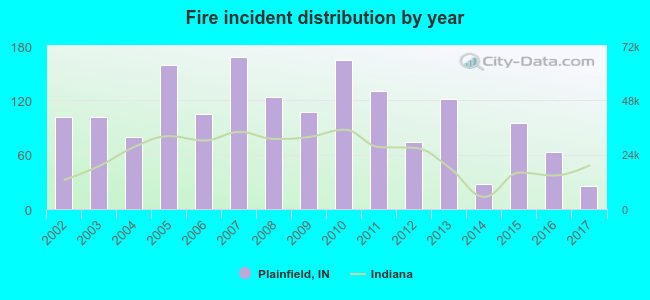 According to the data from the years 2002 - 2017 the average number of fires per year is 103. The highest number of reported fire incidents - 168 took place in 2007, and the least - 25 in 2017. The data has a declining trend.
The average number of yearly fire incidents per 10k residents in Plainfield, IN compared to nearest cities:
(Note: Based on data for the last 3 years, including only cities with population 5,000 and above)
| Plainfield: | 9.8 |
| Avon: | 44.2 |
| Mooresville: | 102.3 |
| Danville: | 44.1 |
| Speedway: | 40.2 |
| Brownsburg: | 19.2 |
| Indianapolis: | 5.2 |
| Greenwood: | 12.8 |
| Beech Grove: | 10.3 |
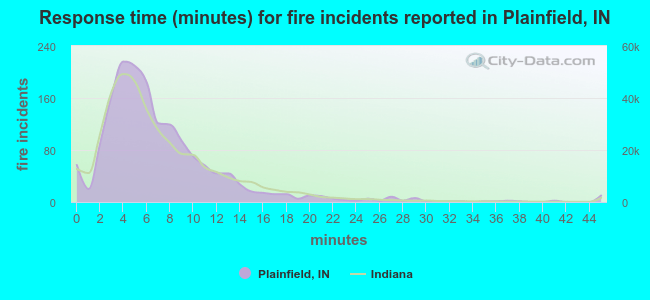 The median response time based on all reported fire incidents is 6 minutes. This is close to the state median value.
The median response time in Plainfield, IN compared to nearest cities:
(Note: Based on data for all years, including only cities with at least 500 fire incidents)
| Plainfield: | 6 minutes |
| Avon: | 7 minutes |
| Mooresville: | 6 minutes |
| Clayton: | 10 minutes |
| Danville: | 8 minutes |
| Brownsburg: | 6 minutes |
| Indianapolis: | 6 minutes |
| Greenwood: | 6 minutes |
| Beech Grove: | 4 minutes |
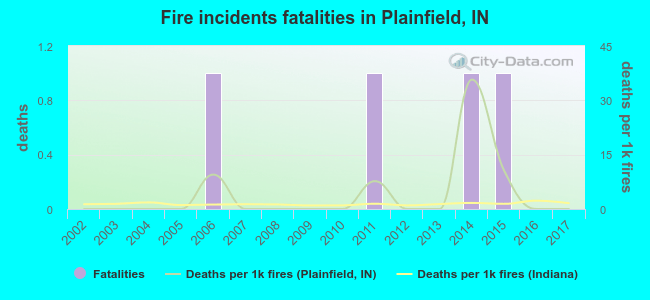 Based on the reports from the years 2002 - 2017 the average number of fire-related fatalities per year is 0. The highest number of deaths - 1 took place in 2006, and the lowest - 0 in 2002. The data has a constant trend.
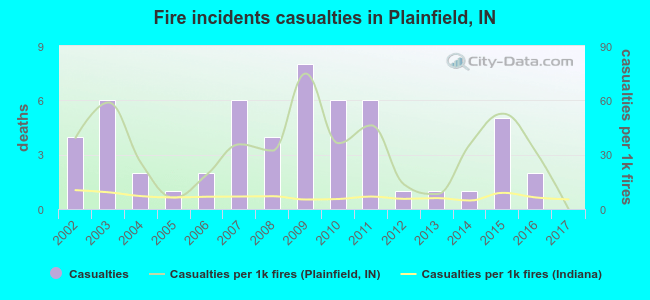 According to the reports from the years 2002 - 2017 the average number of fire-related casualties per year is 3. The highest number of casualties - 8 took place in 2009, and the lowest - 0 in 2017. The data has a dropping trend.
The average number of injuries per 1,000 fire incidents is 32. This indicator was the highest - 75 in 2009, and the lowest 0 in 2017. The trend for casualties per 1,000 fire incidents is dropping. Compared to the state value the number of injuries per 1,000 fires is much higher.
According to the reports from the years 2002 - 2017 the average number of fire-related casualties per year is 3. The highest number of casualties - 8 took place in 2009, and the lowest - 0 in 2017. The data has a dropping trend.
The average number of injuries per 1,000 fire incidents is 32. This indicator was the highest - 75 in 2009, and the lowest 0 in 2017. The trend for casualties per 1,000 fire incidents is dropping. Compared to the state value the number of injuries per 1,000 fires is much higher.Casualties per 1,000 incidents in Plainfield, IN compared to nearest cities:
(Note: Based on data for all years, including only cities with at least 500 fire incidents)
| Plainfield: | 33.4 |
| Avon: | 2.4 |
| Mooresville: | 11.7 |
| Clayton: | 2.4 |
| Danville: | 0.9 |
| Brownsburg: | 22.5 |
| Indianapolis: | 4.7 |
| Greenwood: | 5.9 |
| Beech Grove: | 21.4 |
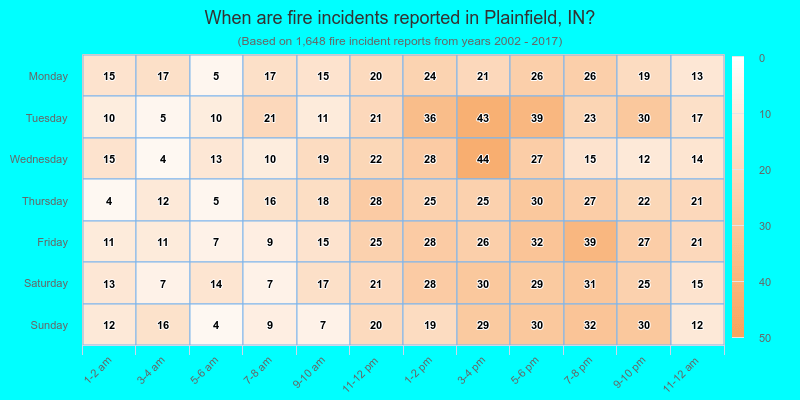
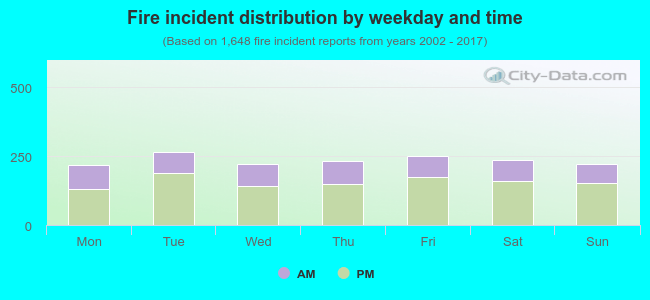 33.9% incidents where reported in the morning and 66.1% in the evening. The most fires (16.1%) took place on Tuesday, and the least (13.2%) on Monday.
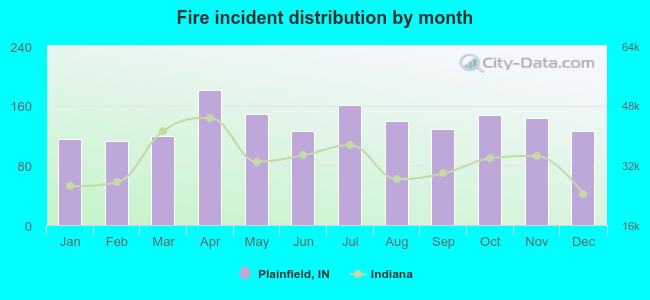 According to the 1,648 reports from years 2002 - 2017 most fires (11.0%) took place during April, and the least (6.8%) in February.
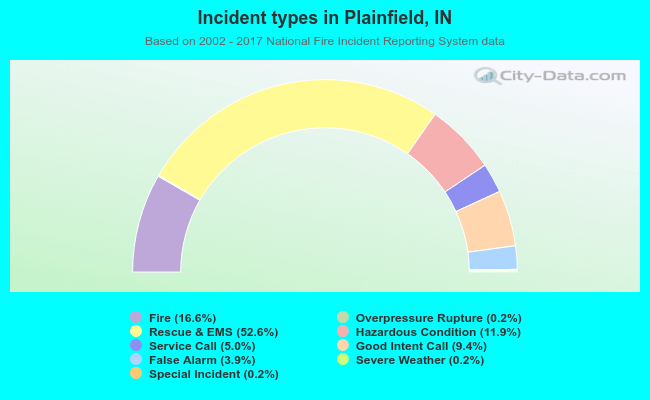 Out of all 9,931 cases reported during the years 2002 - 2017, the most belonged to the categories: Rescue & EMS (52.6%), Fire (16.6%), and Hazardous Condition (11.9%).
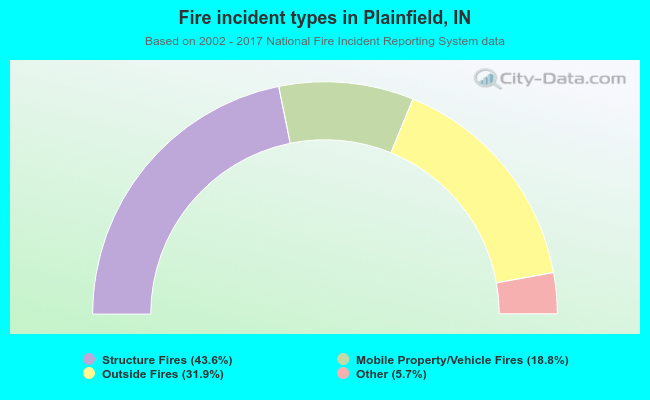 When looking into fire subcategories, the most incidents belonged to: Structure Fires (43.6%), and Outside Fires (31.9%).