McRae: Fire Incidents, Georgia (GA)
Where are fire incidents reported in McRae, GA
Something went wrong! Please refresh the page.
|
| |||||||||||||||||||||||||||||||||||||||||||||||||||||||||||||||||||||||||||||||||||||||||||||||||||||||||||||
| Other | 38 | |||||||||||||||||||||||||||||||||||||||||||||||||||||||||||||||||||||||||||||||||||||||||||||||||||||||||||||
2002 - 2018 National Fire Incident Reporting System (NFIRS) incidents
- Incident types reported to NFIRS in McRae, GA
- 77668.8%Fire
- 20918.5%Rescue & EMS
- 726.4%Hazardous Condition
- 373.3%Good Intent Call
- 242.1%Service Call
- 80.7%False Alarm
- 20.2%Severe Weather
- Fire incident types reported to NFIRS in McRae, GA
- 33142.7%Structure Fires
- 32541.9%Outside Fires
- 10213.1%Mobile Property/Vehicle Fires
- 182.3%Other
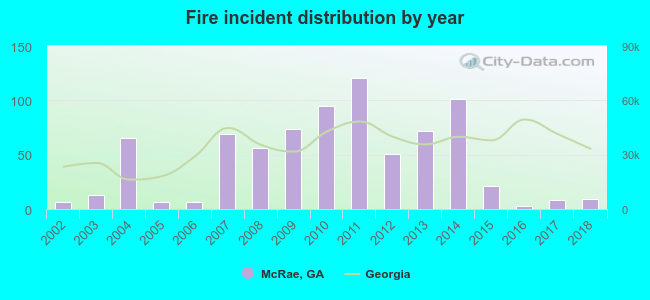 Based on the data from the years 2002 - 2018 the average number of fires per year is 46. The highest number of reported fire incidents - 121 took place in 2011, and the least - 3 in 2016. The data has a growing trend.
The average number of yearly fire incidents per 10k residents in McRae, GA compared to nearest cities:
(Note: Based on data for the last 3 years, including only cities with population 5,000 and above)
| McRae: | 11.2 |
| Eastman: | 244.5 |
| Vidalia: | 35.9 |
| Fitzgerald: | 108.1 |
| Dublin: | 145.0 |
| Hawkinsville: | 147.1 |
| Douglas: | 164.0 |
| Swainsboro: | 191.8 |
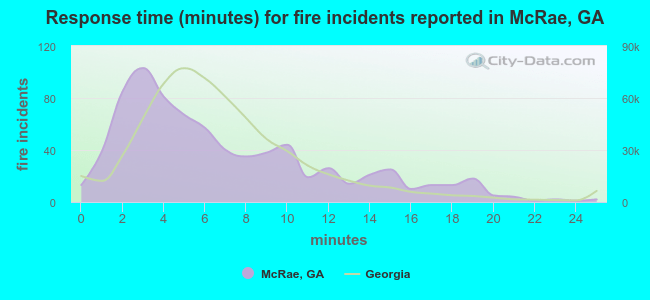 The median response time based on all reported fire incidents is 6 minutes. This is about the same as the Georgia median value.
The median response time in McRae, GA compared to nearest cities:
(Note: Based on data for all years, including only cities with at least 500 fire incidents)
| McRae: | 6 minutes |
| Eastman: | 6 minutes |
| Hazlehurst: | 5 minutes |
| Fitzgerald: | 4 minutes |
| Dublin: | 7 minutes |
| East Dublin: | 7 minutes |
| Cochran: | 7 minutes |
| Lyons: | 9 minutes |
| Hawkinsville: | 7 minutes |
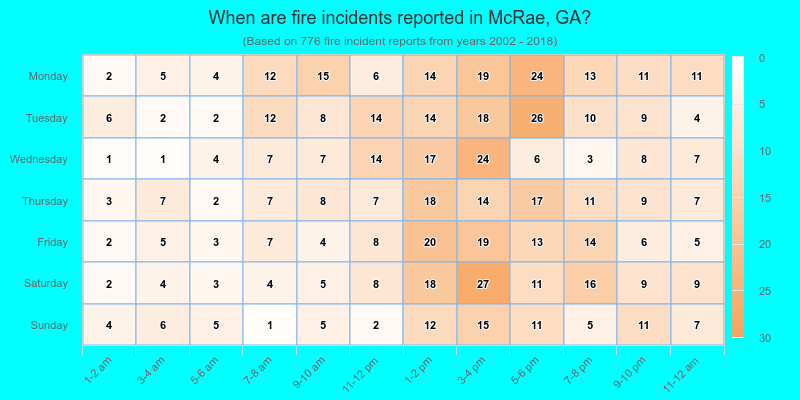
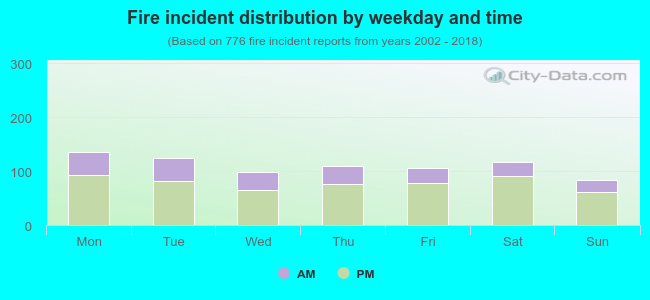 30.2% incidents where reported in the morning and 69.8% in the evening. The most fires (17.5%) took place on Monday, and the least (10.8%) on Sunday.
 Based on the 776 fire incident reports from years 2002 - 2018 most fires (17.0%) took place during March, and the least (5.9%) in July.
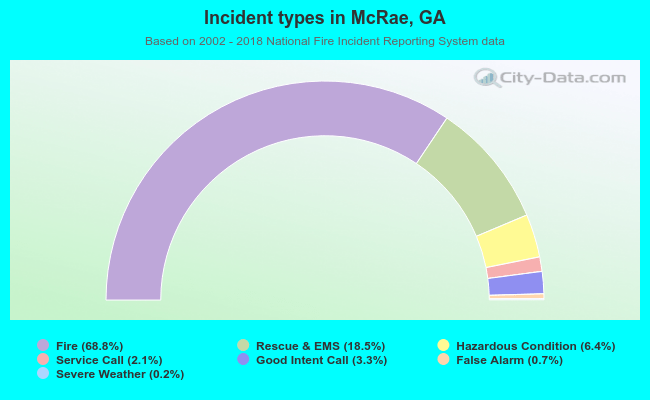 Out of all 1,128 cases reported during the years 2002 - 2018, the most belonged to the categories: Fire (68.8%), Overpressure Rupture (18.5%), and Rescue & EMS (6.4%).
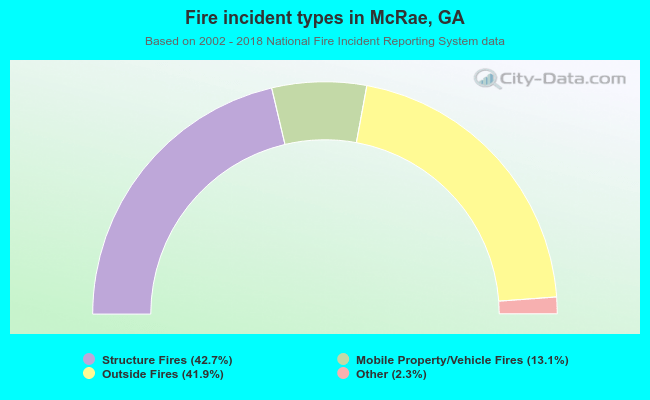 When looking into fire subcategories, the most reports belonged to: Structure Fires (42.7%), and Outside Fires (41.9%).