New Hope: Fire Incidents, Minnesota (MN)
Where are fire incidents reported in New Hope, MN
Something went wrong! Please refresh the page.
| Fire incidents reported | |
|---|---|
| Sreet name | Count |
| WINNETKA AVE | 176 |
| BOONE AVE | 162 |
| BASS LAKE RD | 158 |
| QUEBEC AVE | 80 |
| ZEALAND AVE | 80 |
| OREGON AVE | 76 |
| 36TH AVE | 70 |
| HILLSBORO AVE | 60 |
| 42ND AVE | 54 |
| INDEPENDENCE AVE | 52 |
| XYLON AVE | 52 |
| RHODE ISLAND AVE | 48 |
| 49TH AVE | 40 |
| ENSIGN AVE | 36 |
| WEST BROADWAY AVE | 36 |
| GETTYSBURG AVE | 30 |
| 45TH AVE | 28 |
| 47TH AVE | 26 |
| 60TH AVE | 26 |
| LOUISIANA AVE | 26 |
| FLAG AVE | 24 |
| NEVADA AVE | 24 |
| 46TH AVE | 22 |
| 62ND AVE | 22 |
| MARYLAND AVE | 20 |
| WISCONSIN AVE | 20 |
| AQUILA AVE | 16 |
| JORDAN AVE | 16 |
| VIRGINIA AVE | 16 |
| 56TH AVE | 14 |
2002 - 2018 National Fire Incident Reporting System (NFIRS) incidents
- Incident types reported to NFIRS in New Hope, MN
- 2,13730.6%Rescue & EMS
- 1,63823.5%Hazardous Condition
- 1,09015.6%False Alarm
- 1,00014.3%Fire
- 5898.4%Service Call
- 5067.3%Good Intent Call
- 70.1%Overpressure Rupture
- Fire incident types reported to NFIRS in New Hope, MN
- 64764.7%Structure Fires
- 18718.7%Outside Fires
- 13413.4%Mobile Property/Vehicle Fires
- 323.2%Other
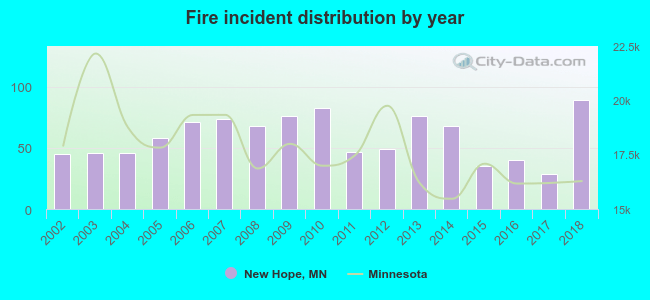 Based on the data from the years 2002 - 2018 the average number of fire incidents per year is 59. The highest number of reported fire incidents - 89 took place in 2018, and the least - 29 in 2017. The data has a growing trend.
The average number of yearly fire incidents per 10k residents in New Hope, MN compared to nearest cities:
(Note: Based on data for the last 3 years, including only cities with population 5,000 and above)
| New Hope: | 25.3 |
| Crystal: | 21.8 |
| Robbinsdale: | 31.4 |
| Golden Valley: | 25.9 |
| Plymouth: | 26.9 |
| Brooklyn Center: | 38.6 |
| Brooklyn Park: | 30.2 |
| Maple Grove: | 9.9 |
| Columbia Heights: | 33.0 |
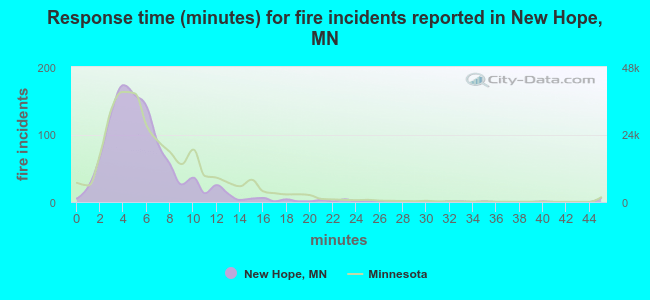 The median response time based on all reported fire incidents is 5 minutes. This is lower than the state median value.
The median response time in New Hope, MN compared to nearest cities:
(Note: Based on data for all years, including only cities with at least 500 fire incidents)
| New Hope: | 5 minutes |
| Crystal: | 5 minutes |
| Robbinsdale: | 6 minutes |
| Golden Valley: | 7 minutes |
| Plymouth: | 8 minutes |
| Brooklyn Center: | 6 minutes |
| Brooklyn Park: | 5 minutes |
| Maple Grove: | 7 minutes |
| St. Louis Park: | 5 minutes |
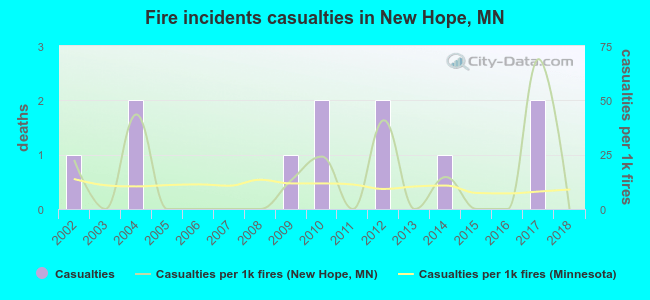 According to the reports from the years 2002 - 2018 the average number of fire-related casualties per year is 1. The highest number of injuries - 2 took place in 2004, and the lowest - 0 in 2003. The data has a decreasing trend.
The average number of injuries per 1,000 fires is 13. This indicator was the highest - 69 in 2017, and the lowest 0 in 2003. The trend for injuries per 1,000 fire incidents is decreasing. Compared to the Minnesota value the number of casualties per 1,000 fires is similar.
According to the reports from the years 2002 - 2018 the average number of fire-related casualties per year is 1. The highest number of injuries - 2 took place in 2004, and the lowest - 0 in 2003. The data has a decreasing trend.
The average number of injuries per 1,000 fires is 13. This indicator was the highest - 69 in 2017, and the lowest 0 in 2003. The trend for injuries per 1,000 fire incidents is decreasing. Compared to the Minnesota value the number of casualties per 1,000 fires is similar.Casualties per 1,000 incidents in New Hope, MN compared to nearest cities:
(Note: Based on data for all years, including only cities with at least 500 fire incidents)
| New Hope: | 11.0 |
| Crystal: | 13.1 |
| Robbinsdale: | 1.7 |
| Golden Valley: | 2.1 |
| Plymouth: | 18.6 |
| Brooklyn Center: | 6.3 |
| Brooklyn Park: | 11.2 |
| Maple Grove: | 26.0 |
| St. Louis Park: | 32.2 |
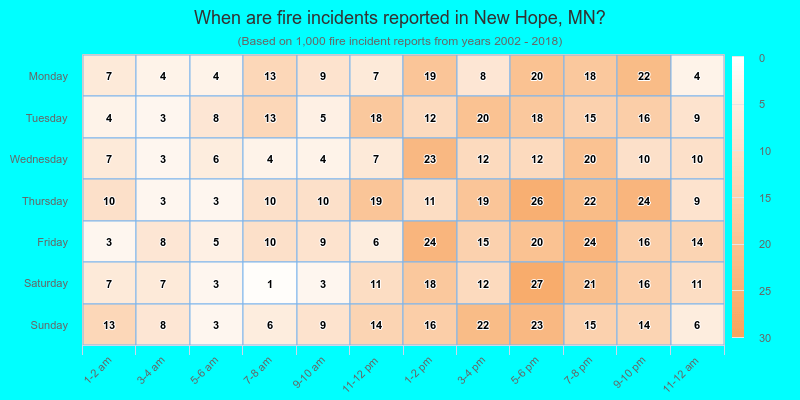
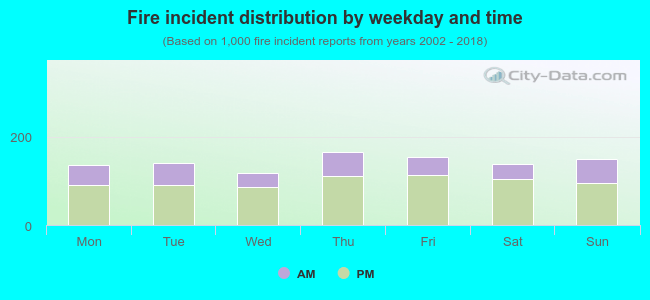 30.7% incidents where reported in the morning and 69.3% in the evening. The most fires (16.6%) took place on Thursday, and the least (11.8%) on Wednesday.
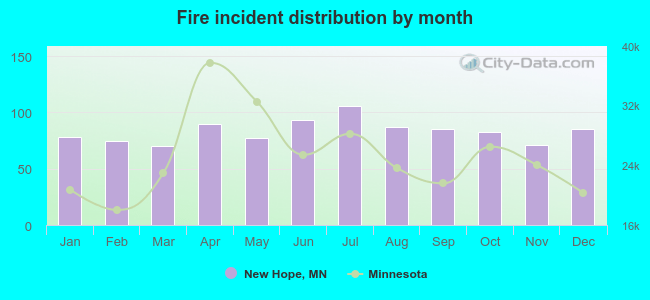 Based on the 1,000 fire incident reports from years 2002 - 2018 most fires (10.6%) took place during July, and the least (7.0%) in March.
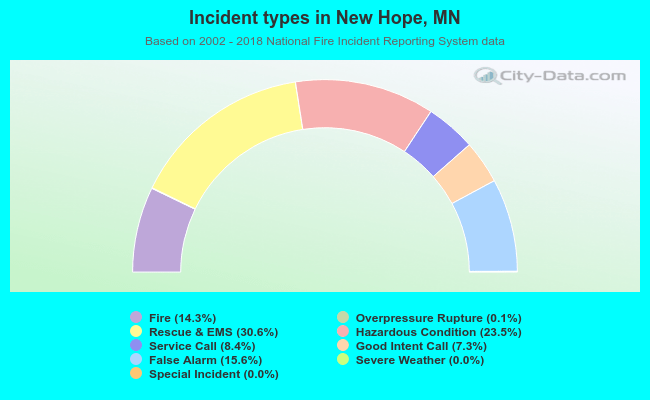 Out of all 6,973 cases reported during the years 2002 - 2018, the most belonged to the categories: Rescue & EMS (30.6%), Hazardous Condition (23.5%), and False Alarm (15.6%).
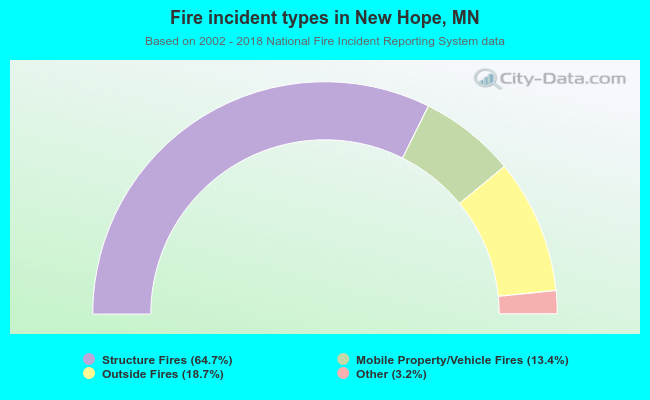 When looking into fire subcategories, the most reports belonged to: Structure Fires (64.7%), and Outside Fires (18.7%).