Brooklyn Park: Fire Incidents, Minnesota (MN)
Where are fire incidents reported in Brooklyn Park, MN
Something went wrong! Please refresh the page.
| Fire incidents reported | |
|---|---|
| Sreet name | Count |
| ZANE AVE | 516 |
| 65TH AVE | 418 |
| 73RD AVE | 404 |
| 73RD AVE | 358 |
| ZANE AVE | 356 |
| 67TH AVE | 236 |
| BROOKLYN BLVD | 188 |
| BOONE AVE | 186 |
| 65TH AVE | 180 |
| 85TH AVE | 150 |
| BOONE AVE | 146 |
| 63RD AVE | 142 |
| 67TH AVE | 136 |
| DOUGLAS DR | 132 |
| DOUGLAS DR | 126 |
| BROOKDALE DR | 114 |
| 69TH AVE | 108 |
| LAKELAND AVE | 98 |
| 69TH AVE | 92 |
| WEST BROADWAY | 90 |
| REGENT AVE | 88 |
| JERSEY AVE | 84 |
| 74TH AVE | 78 |
| HIGHWAY 610 | 78 |
| KENTUCKY AVE | 76 |
| 78TH AVE | 74 |
| 81ST AVE | 74 |
| BROOKDALE DR | 74 |
| HIGHWAY 169 | 72 |
| 78TH AVE | 70 |
| Other | 406 |
2002 - 2018 National Fire Incident Reporting System (NFIRS) incidents
- Incident types reported to NFIRS in Brooklyn Park, MN
- 20,89255.4%Rescue & EMS
- 5,35014.2%Fire
- 3,6629.7%Hazardous Condition
- 3,0828.2%False Alarm
- 2,4906.6%Good Intent Call
- 2,1095.6%Service Call
- 870.2%Overpressure Rupture
- Fire incident types reported to NFIRS in Brooklyn Park, MN
- 3,75670.2%Structure Fires
- 89816.8%Outside Fires
- 66112.4%Mobile Property/Vehicle Fires
- 350.7%Other
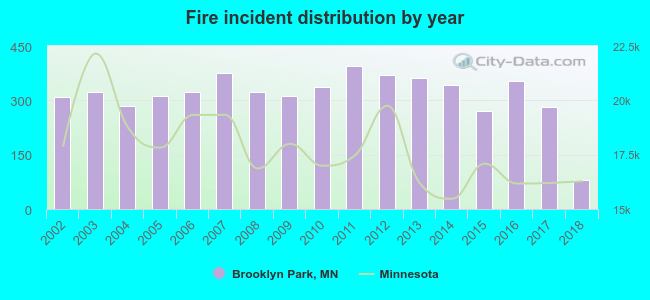 According to the data from the years 2002 - 2018 the average number of fire incidents per year is 315. The highest number of reported fires - 394 took place in 2011, and the least - 79 in 2018. The data has a dropping trend.
The average number of yearly fire incidents per 10k residents in Brooklyn Park, MN compared to nearest cities:
(Note: Based on data for the last 3 years, including only cities with population 5,000 and above)
| Brooklyn Park: | 30.2 |
| Brooklyn Center: | 38.6 |
| Fridley: | 45.8 |
| Crystal: | 21.8 |
| New Hope: | 25.3 |
| Spring Lake Park: | 22.7 |
| Champlin: | 12.0 |
| Maple Grove: | 9.9 |
| Coon Rapids: | 20.4 |
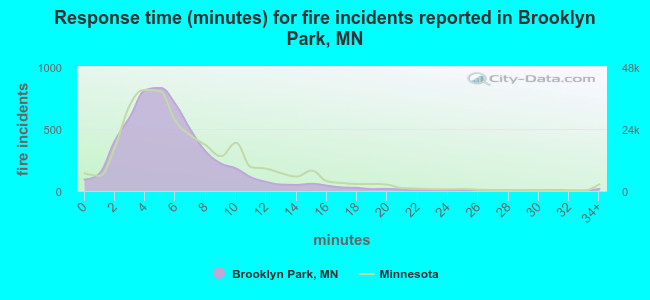 The median response time based on all reported fire incidents is 5 minutes. This is lower compared to the Minnesota median value.
The median response time in Brooklyn Park, MN compared to nearest cities:
(Note: Based on data for all years, including only cities with at least 500 fire incidents)
| Brooklyn Park: | 5 minutes |
| Brooklyn Center: | 6 minutes |
| Fridley: | 7 minutes |
| Crystal: | 5 minutes |
| New Hope: | 5 minutes |
| Champlin: | 9 minutes |
| Maple Grove: | 7 minutes |
| Coon Rapids: | 5 minutes |
| Robbinsdale: | 6 minutes |
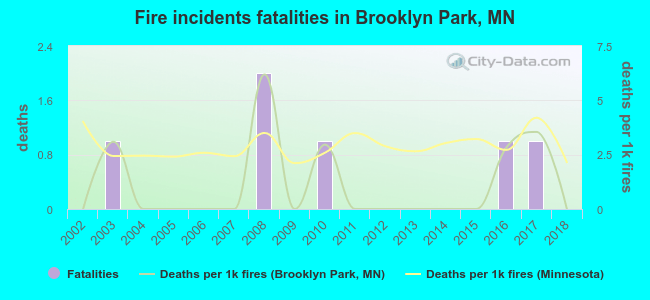 Based on the reports from the years 2002 - 2018 the average number of fire-related yearly deaths is 0. The highest number of deaths - 2 took place in 2008, and the lowest - 0 in 2002. The data has a constant trend.
The average number of deaths per 1,000 fire incidents is 1. This indicator was the highest - 6 in 2008, and the lowest 0 in 2002. The trend for fatalities per 1,000 fire incidents is constant. Compared to the Minnesota value the number of fatalities per 1,000 incidents is much lower.
Based on the reports from the years 2002 - 2018 the average number of fire-related yearly deaths is 0. The highest number of deaths - 2 took place in 2008, and the lowest - 0 in 2002. The data has a constant trend.
The average number of deaths per 1,000 fire incidents is 1. This indicator was the highest - 6 in 2008, and the lowest 0 in 2002. The trend for fatalities per 1,000 fire incidents is constant. Compared to the Minnesota value the number of fatalities per 1,000 incidents is much lower.Deaths per 1,000 incidents in Brooklyn Park, MN compared to nearest cities:
(Note: Based on data for all years, including only cities with at least 2,500 fire incidents)
| Brooklyn Park: | 1.1 |
| Plymouth: | 0.3 |
| Minneapolis: | 3.6 |
| Bloomington: | 1.8 |
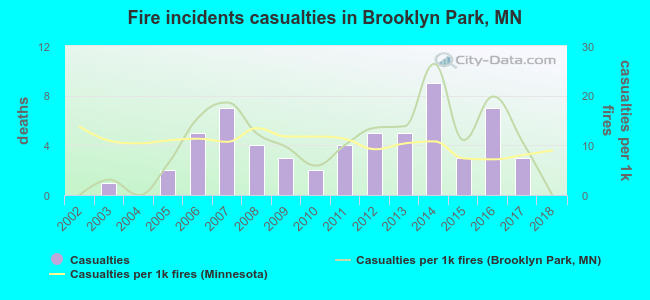 According to the reports from the years 2002 - 2018 the average number of fire-related casualties per year is 4. The highest number of injuries - 9 took place in 2014, and the lowest - 0 in 2002. The data has a constant trend.
The average number of casualties per 1,000 fires is 10. This indicator was the highest - 26 in 2014, and the lowest 0 in 2002. The trend for casualties per 1,000 fire incidents is rising. Compared to the state value the number of injuries per 1,000 incidents is about the same.
According to the reports from the years 2002 - 2018 the average number of fire-related casualties per year is 4. The highest number of injuries - 9 took place in 2014, and the lowest - 0 in 2002. The data has a constant trend.
The average number of casualties per 1,000 fires is 10. This indicator was the highest - 26 in 2014, and the lowest 0 in 2002. The trend for casualties per 1,000 fire incidents is rising. Compared to the state value the number of injuries per 1,000 incidents is about the same.Casualties per 1,000 incidents in Brooklyn Park, MN compared to nearest cities:
(Note: Based on data for all years, including only cities with at least 500 fire incidents)
| Brooklyn Park: | 11.2 |
| Brooklyn Center: | 6.3 |
| Fridley: | 14.3 |
| Crystal: | 13.1 |
| New Hope: | 11.0 |
| Champlin: | 1.9 |
| Maple Grove: | 26.0 |
| Coon Rapids: | 14.4 |
| Robbinsdale: | 1.7 |
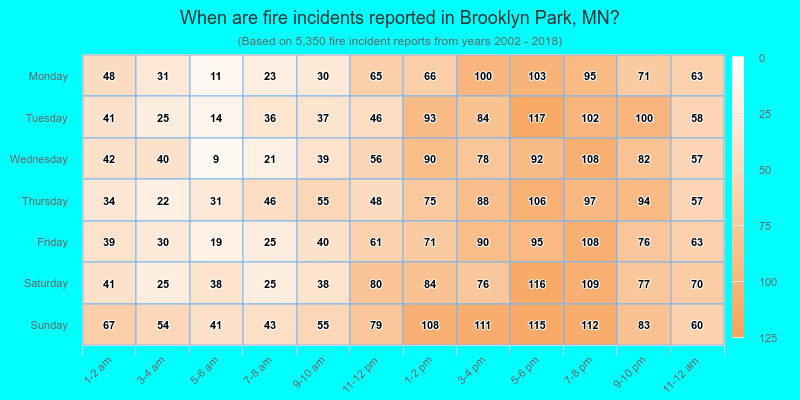
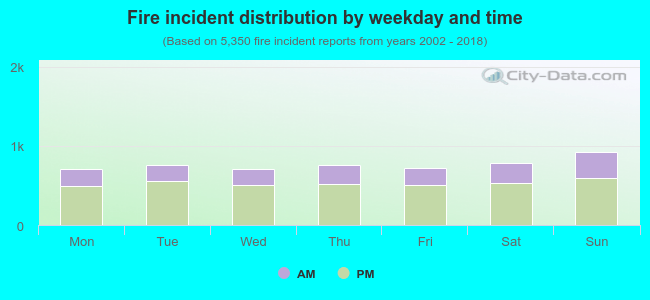 30.8% incidents where reported in the morning and 69.2% in the evening. The most fires (17.3%) took place on Sunday, and the least (13.2%) on Monday.
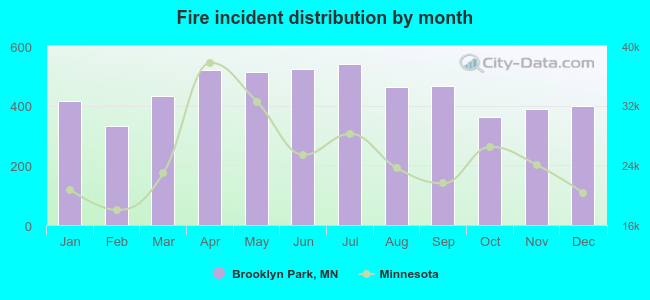 According to the 5,350 fire incident reports from years 2002 - 2018 most fires (10.1%) took place during July, and the least (6.2%) in February.
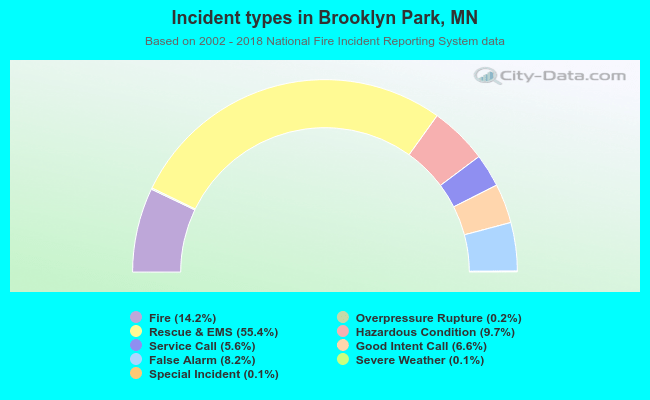 Out of all 37,715 cases reported during the years 2002 - 2018, the most belonged to the categories: Rescue & EMS (55.4%), Fire (14.2%), and Hazardous Condition (9.7%).
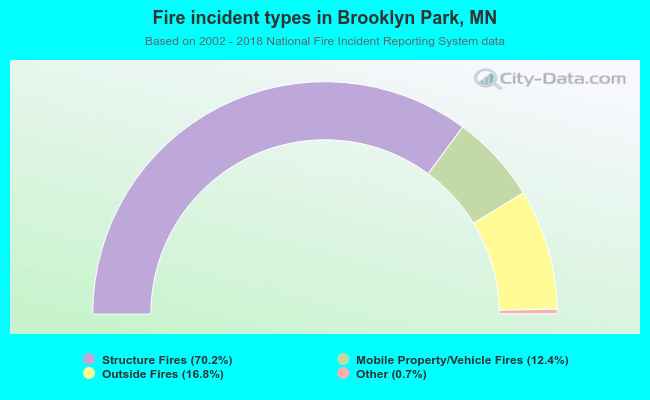 When looking into fire subcategories, the most reports belonged to: Structure Fires (70.2%), and Outside Fires (16.8%).