Brooklyn Park, Minnesota Submit your own pictures of this city and show them to the world
OSM Map
General Map
Google Map
MSN Map
OSM Map
General Map
Google Map
MSN Map
OSM Map
General Map
Google Map
MSN Map
OSM Map
General Map
Google Map
MSN Map
Please wait while loading the map...
Population in 2022: 83,324 (100% urban, 0% rural). Population change since 2000: +23.6%Males: 42,090 Females: 41,234
March 2022 cost of living index in Brooklyn Park: 112.9 (more than average, U.S. average is 100) Percentage of residents living in poverty in 2022: 9.4%for White Non-Hispanic residents , 16.3% for Black residents , 18.2% for Hispanic or Latino residents , 58.2% for American Indian residents , 20.8% for other race residents , 3.4% for two or more races residents )
Profiles of local businesses
Business Search - 14 Million verified businesses
Data:
Median household income ($)
Median household income (% change since 2000)
Household income diversity
Ratio of average income to average house value (%)
Ratio of average income to average rent
Median household income ($) - White
Median household income ($) - Black or African American
Median household income ($) - Asian
Median household income ($) - Hispanic or Latino
Median household income ($) - American Indian and Alaska Native
Median household income ($) - Multirace
Median household income ($) - Other Race
Median household income for houses/condos with a mortgage ($)
Median household income for apartments without a mortgage ($)
Races - White alone (%)
Races - White alone (% change since 2000)
Races - Black alone (%)
Races - Black alone (% change since 2000)
Races - American Indian alone (%)
Races - American Indian alone (% change since 2000)
Races - Asian alone (%)
Races - Asian alone (% change since 2000)
Races - Hispanic (%)
Races - Hispanic (% change since 2000)
Races - Native Hawaiian and Other Pacific Islander alone (%)
Races - Native Hawaiian and Other Pacific Islander alone (% change since 2000)
Races - Two or more races (%)
Races - Two or more races (% change since 2000)
Races - Other race alone (%)
Races - Other race alone (% change since 2000)
Racial diversity
Unemployment (%)
Unemployment (% change since 2000)
Unemployment (%) - White
Unemployment (%) - Black or African American
Unemployment (%) - Asian
Unemployment (%) - Hispanic or Latino
Unemployment (%) - American Indian and Alaska Native
Unemployment (%) - Multirace
Unemployment (%) - Other Race
Population density (people per square mile)
Population - Males (%)
Population - Females (%)
Population - Males (%) - White
Population - Males (%) - Black or African American
Population - Males (%) - Asian
Population - Males (%) - Hispanic or Latino
Population - Males (%) - American Indian and Alaska Native
Population - Males (%) - Multirace
Population - Males (%) - Other Race
Population - Females (%) - White
Population - Females (%) - Black or African American
Population - Females (%) - Asian
Population - Females (%) - Hispanic or Latino
Population - Females (%) - American Indian and Alaska Native
Population - Females (%) - Multirace
Population - Females (%) - Other Race
Coronavirus confirmed cases (Apr 27, 2024)
Deaths caused by coronavirus (Apr 27, 2024)
Coronavirus confirmed cases (per 100k population) (Apr 27, 2024)
Deaths caused by coronavirus (per 100k population) (Apr 27, 2024)
Daily increase in number of cases (Apr 27, 2024)
Weekly increase in number of cases (Apr 27, 2024)
Cases doubled (in days) (Apr 27, 2024)
Hospitalized patients (Apr 18, 2022)
Negative test results (Apr 18, 2022)
Total test results (Apr 18, 2022)
COVID Vaccine doses distributed (per 100k population) (Sep 19, 2023)
COVID Vaccine doses administered (per 100k population) (Sep 19, 2023)
COVID Vaccine doses distributed (Sep 19, 2023)
COVID Vaccine doses administered (Sep 19, 2023)
Likely homosexual households (%)
Likely homosexual households (% change since 2000)
Likely homosexual households - Lesbian couples (%)
Likely homosexual households - Lesbian couples (% change since 2000)
Likely homosexual households - Gay men (%)
Likely homosexual households - Gay men (% change since 2000)
Cost of living index
Median gross rent ($)
Median contract rent ($)
Median monthly housing costs ($)
Median house or condo value ($)
Median house or condo value ($ change since 2000)
Mean house or condo value by units in structure - 1, detached ($)
Mean house or condo value by units in structure - 1, attached ($)
Mean house or condo value by units in structure - 2 ($)
Mean house or condo value by units in structure by units in structure - 3 or 4 ($)
Mean house or condo value by units in structure - 5 or more ($)
Mean house or condo value by units in structure - Boat, RV, van, etc. ($)
Mean house or condo value by units in structure - Mobile home ($)
Median house or condo value ($) - White
Median house or condo value ($) - Black or African American
Median house or condo value ($) - Asian
Median house or condo value ($) - Hispanic or Latino
Median house or condo value ($) - American Indian and Alaska Native
Median house or condo value ($) - Multirace
Median house or condo value ($) - Other Race
Median resident age
Resident age diversity
Median resident age - Males
Median resident age - Females
Median resident age - White
Median resident age - Black or African American
Median resident age - Asian
Median resident age - Hispanic or Latino
Median resident age - American Indian and Alaska Native
Median resident age - Multirace
Median resident age - Other Race
Median resident age - Males - White
Median resident age - Males - Black or African American
Median resident age - Males - Asian
Median resident age - Males - Hispanic or Latino
Median resident age - Males - American Indian and Alaska Native
Median resident age - Males - Multirace
Median resident age - Males - Other Race
Median resident age - Females - White
Median resident age - Females - Black or African American
Median resident age - Females - Asian
Median resident age - Females - Hispanic or Latino
Median resident age - Females - American Indian and Alaska Native
Median resident age - Females - Multirace
Median resident age - Females - Other Race
Commute - mean travel time to work (minutes)
Travel time to work - Less than 5 minutes (%)
Travel time to work - Less than 5 minutes (% change since 2000)
Travel time to work - 5 to 9 minutes (%)
Travel time to work - 5 to 9 minutes (% change since 2000)
Travel time to work - 10 to 19 minutes (%)
Travel time to work - 10 to 19 minutes (% change since 2000)
Travel time to work - 20 to 29 minutes (%)
Travel time to work - 20 to 29 minutes (% change since 2000)
Travel time to work - 30 to 39 minutes (%)
Travel time to work - 30 to 39 minutes (% change since 2000)
Travel time to work - 40 to 59 minutes (%)
Travel time to work - 40 to 59 minutes (% change since 2000)
Travel time to work - 60 to 89 minutes (%)
Travel time to work - 60 to 89 minutes (% change since 2000)
Travel time to work - 90 or more minutes (%)
Travel time to work - 90 or more minutes (% change since 2000)
Marital status - Never married (%)
Marital status - Now married (%)
Marital status - Separated (%)
Marital status - Widowed (%)
Marital status - Divorced (%)
Median family income ($)
Median family income (% change since 2000)
Median non-family income ($)
Median non-family income (% change since 2000)
Median per capita income ($)
Median per capita income (% change since 2000)
Median family income ($) - White
Median family income ($) - Black or African American
Median family income ($) - Asian
Median family income ($) - Hispanic or Latino
Median family income ($) - American Indian and Alaska Native
Median family income ($) - Multirace
Median family income ($) - Other Race
Median year house/condo built
Median year apartment built
Year house built - Built 2005 or later (%)
Year house built - Built 2000 to 2004 (%)
Year house built - Built 1990 to 1999 (%)
Year house built - Built 1980 to 1989 (%)
Year house built - Built 1970 to 1979 (%)
Year house built - Built 1960 to 1969 (%)
Year house built - Built 1950 to 1959 (%)
Year house built - Built 1940 to 1949 (%)
Year house built - Built 1939 or earlier (%)
Average household size
Household density (households per square mile)
Average household size - White
Average household size - Black or African American
Average household size - Asian
Average household size - Hispanic or Latino
Average household size - American Indian and Alaska Native
Average household size - Multirace
Average household size - Other Race
Occupied housing units (%)
Vacant housing units (%)
Owner occupied housing units (%)
Renter occupied housing units (%)
Vacancy status - For rent (%)
Vacancy status - For sale only (%)
Vacancy status - Rented or sold, not occupied (%)
Vacancy status - For seasonal, recreational, or occasional use (%)
Vacancy status - For migrant workers (%)
Vacancy status - Other vacant (%)
Residents with income below the poverty level (%)
Residents with income below 50% of the poverty level (%)
Children below poverty level (%)
Poor families by family type - Married-couple family (%)
Poor families by family type - Male, no wife present (%)
Poor families by family type - Female, no husband present (%)
Poverty status for native-born residents (%)
Poverty status for foreign-born residents (%)
Poverty among high school graduates not in families (%)
Poverty among people who did not graduate high school not in families (%)
Residents with income below the poverty level (%) - White
Residents with income below the poverty level (%) - Black or African American
Residents with income below the poverty level (%) - Asian
Residents with income below the poverty level (%) - Hispanic or Latino
Residents with income below the poverty level (%) - American Indian and Alaska Native
Residents with income below the poverty level (%) - Multirace
Residents with income below the poverty level (%) - Other Race
Air pollution - Air Quality Index (AQI)
Air pollution - CO
Air pollution - NO2
Air pollution - SO2
Air pollution - Ozone
Air pollution - PM10
Air pollution - PM25
Air pollution - Pb
Crime - Murders per 100,000 population
Crime - Rapes per 100,000 population
Crime - Robberies per 100,000 population
Crime - Assaults per 100,000 population
Crime - Burglaries per 100,000 population
Crime - Thefts per 100,000 population
Crime - Auto thefts per 100,000 population
Crime - Arson per 100,000 population
Crime - City-data.com crime index
Crime - Violent crime index
Crime - Property crime index
Crime - Murders per 100,000 population (5 year average)
Crime - Rapes per 100,000 population (5 year average)
Crime - Robberies per 100,000 population (5 year average)
Crime - Assaults per 100,000 population (5 year average)
Crime - Burglaries per 100,000 population (5 year average)
Crime - Thefts per 100,000 population (5 year average)
Crime - Auto thefts per 100,000 population (5 year average)
Crime - Arson per 100,000 population (5 year average)
Crime - City-data.com crime index (5 year average)
Crime - Violent crime index (5 year average)
Crime - Property crime index (5 year average)
1996 Presidential Elections Results (%) - Democratic Party (Clinton)
1996 Presidential Elections Results (%) - Republican Party (Dole)
1996 Presidential Elections Results (%) - Other
2000 Presidential Elections Results (%) - Democratic Party (Gore)
2000 Presidential Elections Results (%) - Republican Party (Bush)
2000 Presidential Elections Results (%) - Other
2004 Presidential Elections Results (%) - Democratic Party (Kerry)
2004 Presidential Elections Results (%) - Republican Party (Bush)
2004 Presidential Elections Results (%) - Other
2008 Presidential Elections Results (%) - Democratic Party (Obama)
2008 Presidential Elections Results (%) - Republican Party (McCain)
2008 Presidential Elections Results (%) - Other
2012 Presidential Elections Results (%) - Democratic Party (Obama)
2012 Presidential Elections Results (%) - Republican Party (Romney)
2012 Presidential Elections Results (%) - Other
2016 Presidential Elections Results (%) - Democratic Party (Clinton)
2016 Presidential Elections Results (%) - Republican Party (Trump)
2016 Presidential Elections Results (%) - Other
2020 Presidential Elections Results (%) - Democratic Party (Biden)
2020 Presidential Elections Results (%) - Republican Party (Trump)
2020 Presidential Elections Results (%) - Other
Ancestries Reported - Arab (%)
Ancestries Reported - Czech (%)
Ancestries Reported - Danish (%)
Ancestries Reported - Dutch (%)
Ancestries Reported - English (%)
Ancestries Reported - French (%)
Ancestries Reported - French Canadian (%)
Ancestries Reported - German (%)
Ancestries Reported - Greek (%)
Ancestries Reported - Hungarian (%)
Ancestries Reported - Irish (%)
Ancestries Reported - Italian (%)
Ancestries Reported - Lithuanian (%)
Ancestries Reported - Norwegian (%)
Ancestries Reported - Polish (%)
Ancestries Reported - Portuguese (%)
Ancestries Reported - Russian (%)
Ancestries Reported - Scotch-Irish (%)
Ancestries Reported - Scottish (%)
Ancestries Reported - Slovak (%)
Ancestries Reported - Subsaharan African (%)
Ancestries Reported - Swedish (%)
Ancestries Reported - Swiss (%)
Ancestries Reported - Ukrainian (%)
Ancestries Reported - United States (%)
Ancestries Reported - Welsh (%)
Ancestries Reported - West Indian (%)
Ancestries Reported - Other (%)
Educational Attainment - No schooling completed (%)
Educational Attainment - Less than high school (%)
Educational Attainment - High school or equivalent (%)
Educational Attainment - Less than 1 year of college (%)
Educational Attainment - 1 or more years of college (%)
Educational Attainment - Associate degree (%)
Educational Attainment - Bachelor's degree (%)
Educational Attainment - Master's degree (%)
Educational Attainment - Professional school degree (%)
Educational Attainment - Doctorate degree (%)
School Enrollment - Nursery, preschool (%)
School Enrollment - Kindergarten (%)
School Enrollment - Grade 1 to 4 (%)
School Enrollment - Grade 5 to 8 (%)
School Enrollment - Grade 9 to 12 (%)
School Enrollment - College undergrad (%)
School Enrollment - Graduate or professional (%)
School Enrollment - Not enrolled in school (%)
School enrollment - Public schools (%)
School enrollment - Private schools (%)
School enrollment - Not enrolled (%)
Median number of rooms in houses and condos
Median number of rooms in apartments
Housing units lacking complete plumbing facilities (%)
Housing units lacking complete kitchen facilities (%)
Density of houses
Urban houses (%)
Rural houses (%)
Households with people 60 years and over (%)
Households with people 65 years and over (%)
Households with people 75 years and over (%)
Households with one or more nonrelatives (%)
Households with no nonrelatives (%)
Population in households (%)
Family households (%)
Nonfamily households (%)
Population in families (%)
Family households with own children (%)
Median number of bedrooms in owner occupied houses
Mean number of bedrooms in owner occupied houses
Median number of bedrooms in renter occupied houses
Mean number of bedrooms in renter occupied houses
Median number of vehichles in owner occupied houses
Mean number of vehichles in owner occupied houses
Median number of vehichles in renter occupied houses
Mean number of vehichles in renter occupied houses
Mortgage status - with mortgage (%)
Mortgage status - with second mortgage (%)
Mortgage status - with home equity loan (%)
Mortgage status - with both second mortgage and home equity loan (%)
Mortgage status - without a mortgage (%)
Average family size
Average family size - White
Average family size - Black or African American
Average family size - Asian
Average family size - Hispanic or Latino
Average family size - American Indian and Alaska Native
Average family size - Multirace
Average family size - Other Race
Geographical mobility - Same house 1 year ago (%)
Geographical mobility - Moved within same county (%)
Geographical mobility - Moved from different county within same state (%)
Geographical mobility - Moved from different state (%)
Geographical mobility - Moved from abroad (%)
Place of birth - Born in state of residence (%)
Place of birth - Born in other state (%)
Place of birth - Native, outside of US (%)
Place of birth - Foreign born (%)
Housing units in structures - 1, detached (%)
Housing units in structures - 1, attached (%)
Housing units in structures - 2 (%)
Housing units in structures - 3 or 4 (%)
Housing units in structures - 5 to 9 (%)
Housing units in structures - 10 to 19 (%)
Housing units in structures - 20 to 49 (%)
Housing units in structures - 50 or more (%)
Housing units in structures - Mobile home (%)
Housing units in structures - Boat, RV, van, etc. (%)
House/condo owner moved in on average (years ago)
Renter moved in on average (years ago)
Year householder moved into unit - Moved in 1999 to March 2000 (%)
Year householder moved into unit - Moved in 1995 to 1998 (%)
Year householder moved into unit - Moved in 1990 to 1994 (%)
Year householder moved into unit - Moved in 1980 to 1989 (%)
Year householder moved into unit - Moved in 1970 to 1979 (%)
Year householder moved into unit - Moved in 1969 or earlier (%)
Means of transportation to work - Drove car alone (%)
Means of transportation to work - Carpooled (%)
Means of transportation to work - Public transportation (%)
Means of transportation to work - Bus or trolley bus (%)
Means of transportation to work - Streetcar or trolley car (%)
Means of transportation to work - Subway or elevated (%)
Means of transportation to work - Railroad (%)
Means of transportation to work - Ferryboat (%)
Means of transportation to work - Taxicab (%)
Means of transportation to work - Motorcycle (%)
Means of transportation to work - Bicycle (%)
Means of transportation to work - Walked (%)
Means of transportation to work - Other means (%)
Working at home (%)
Industry diversity
Most Common Industries - Agriculture, forestry, fishing and hunting, and mining (%)
Most Common Industries - Agriculture, forestry, fishing and hunting (%)
Most Common Industries - Mining, quarrying, and oil and gas extraction (%)
Most Common Industries - Construction (%)
Most Common Industries - Manufacturing (%)
Most Common Industries - Wholesale trade (%)
Most Common Industries - Retail trade (%)
Most Common Industries - Transportation and warehousing, and utilities (%)
Most Common Industries - Transportation and warehousing (%)
Most Common Industries - Utilities (%)
Most Common Industries - Information (%)
Most Common Industries - Finance and insurance, and real estate and rental and leasing (%)
Most Common Industries - Finance and insurance (%)
Most Common Industries - Real estate and rental and leasing (%)
Most Common Industries - Professional, scientific, and management, and administrative and waste management services (%)
Most Common Industries - Professional, scientific, and technical services (%)
Most Common Industries - Management of companies and enterprises (%)
Most Common Industries - Administrative and support and waste management services (%)
Most Common Industries - Educational services, and health care and social assistance (%)
Most Common Industries - Educational services (%)
Most Common Industries - Health care and social assistance (%)
Most Common Industries - Arts, entertainment, and recreation, and accommodation and food services (%)
Most Common Industries - Arts, entertainment, and recreation (%)
Most Common Industries - Accommodation and food services (%)
Most Common Industries - Other services, except public administration (%)
Most Common Industries - Public administration (%)
Occupation diversity
Most Common Occupations - Management, business, science, and arts occupations (%)
Most Common Occupations - Management, business, and financial occupations (%)
Most Common Occupations - Management occupations (%)
Most Common Occupations - Business and financial operations occupations (%)
Most Common Occupations - Computer, engineering, and science occupations (%)
Most Common Occupations - Computer and mathematical occupations (%)
Most Common Occupations - Architecture and engineering occupations (%)
Most Common Occupations - Life, physical, and social science occupations (%)
Most Common Occupations - Education, legal, community service, arts, and media occupations (%)
Most Common Occupations - Community and social service occupations (%)
Most Common Occupations - Legal occupations (%)
Most Common Occupations - Education, training, and library occupations (%)
Most Common Occupations - Arts, design, entertainment, sports, and media occupations (%)
Most Common Occupations - Healthcare practitioners and technical occupations (%)
Most Common Occupations - Health diagnosing and treating practitioners and other technical occupations (%)
Most Common Occupations - Health technologists and technicians (%)
Most Common Occupations - Service occupations (%)
Most Common Occupations - Healthcare support occupations (%)
Most Common Occupations - Protective service occupations (%)
Most Common Occupations - Fire fighting and prevention, and other protective service workers including supervisors (%)
Most Common Occupations - Law enforcement workers including supervisors (%)
Most Common Occupations - Food preparation and serving related occupations (%)
Most Common Occupations - Building and grounds cleaning and maintenance occupations (%)
Most Common Occupations - Personal care and service occupations (%)
Most Common Occupations - Sales and office occupations (%)
Most Common Occupations - Sales and related occupations (%)
Most Common Occupations - Office and administrative support occupations (%)
Most Common Occupations - Natural resources, construction, and maintenance occupations (%)
Most Common Occupations - Farming, fishing, and forestry occupations (%)
Most Common Occupations - Construction and extraction occupations (%)
Most Common Occupations - Installation, maintenance, and repair occupations (%)
Most Common Occupations - Production, transportation, and material moving occupations (%)
Most Common Occupations - Production occupations (%)
Most Common Occupations - Transportation occupations (%)
Most Common Occupations - Material moving occupations (%)
People in Group quarters - Institutionalized population (%)
People in Group quarters - Correctional institutions (%)
People in Group quarters - Federal prisons and detention centers (%)
People in Group quarters - Halfway houses (%)
People in Group quarters - Local jails and other confinement facilities (including police lockups) (%)
People in Group quarters - Military disciplinary barracks (%)
People in Group quarters - State prisons (%)
People in Group quarters - Other types of correctional institutions (%)
People in Group quarters - Nursing homes (%)
People in Group quarters - Hospitals/wards, hospices, and schools for the handicapped (%)
People in Group quarters - Hospitals/wards and hospices for chronically ill (%)
People in Group quarters - Hospices or homes for chronically ill (%)
People in Group quarters - Military hospitals or wards for chronically ill (%)
People in Group quarters - Other hospitals or wards for chronically ill (%)
People in Group quarters - Hospitals or wards for drug/alcohol abuse (%)
People in Group quarters - Mental (Psychiatric) hospitals or wards (%)
People in Group quarters - Schools, hospitals, or wards for the mentally retarded (%)
People in Group quarters - Schools, hospitals, or wards for the physically handicapped (%)
People in Group quarters - Institutions for the deaf (%)
People in Group quarters - Institutions for the blind (%)
People in Group quarters - Orthopedic wards and institutions for the physically handicapped (%)
People in Group quarters - Wards in general hospitals for patients who have no usual home elsewhere (%)
People in Group quarters - Wards in military hospitals for patients who have no usual home elsewhere (%)
People in Group quarters - Juvenile institutions (%)
People in Group quarters - Long-term care (%)
People in Group quarters - Homes for abused, dependent, and neglected children (%)
People in Group quarters - Residential treatment centers for emotionally disturbed children (%)
People in Group quarters - Training schools for juvenile delinquents (%)
People in Group quarters - Short-term care, detention or diagnostic centers for delinquent children (%)
People in Group quarters - Type of juvenile institution unknown (%)
People in Group quarters - Noninstitutionalized population (%)
People in Group quarters - College dormitories (includes college quarters off campus) (%)
People in Group quarters - Military quarters (%)
People in Group quarters - On base (%)
People in Group quarters - Barracks, unaccompanied personnel housing (UPH), (Enlisted/Officer), ;and similar group living quarters for military personnel (%)
People in Group quarters - Transient quarters for temporary residents (%)
People in Group quarters - Military ships (%)
People in Group quarters - Group homes (%)
People in Group quarters - Homes or halfway houses for drug/alcohol abuse (%)
People in Group quarters - Homes for the mentally ill (%)
People in Group quarters - Homes for the mentally retarded (%)
People in Group quarters - Homes for the physically handicapped (%)
People in Group quarters - Other group homes (%)
People in Group quarters - Religious group quarters (%)
People in Group quarters - Dormitories (%)
People in Group quarters - Agriculture workers' dormitories on farms (%)
People in Group quarters - Job Corps and vocational training facilities (%)
People in Group quarters - Other workers' dormitories (%)
People in Group quarters - Crews of maritime vessels (%)
People in Group quarters - Other nonhousehold living situations (%)
People in Group quarters - Other noninstitutional group quarters (%)
Residents speaking English at home (%)
Residents speaking English at home - Born in the United States (%)
Residents speaking English at home - Native, born elsewhere (%)
Residents speaking English at home - Foreign born (%)
Residents speaking Spanish at home (%)
Residents speaking Spanish at home - Born in the United States (%)
Residents speaking Spanish at home - Native, born elsewhere (%)
Residents speaking Spanish at home - Foreign born (%)
Residents speaking other language at home (%)
Residents speaking other language at home - Born in the United States (%)
Residents speaking other language at home - Native, born elsewhere (%)
Residents speaking other language at home - Foreign born (%)
Class of Workers - Employee of private company (%)
Class of Workers - Self-employed in own incorporated business (%)
Class of Workers - Private not-for-profit wage and salary workers (%)
Class of Workers - Local government workers (%)
Class of Workers - State government workers (%)
Class of Workers - Federal government workers (%)
Class of Workers - Self-employed workers in own not incorporated business and Unpaid family workers (%)
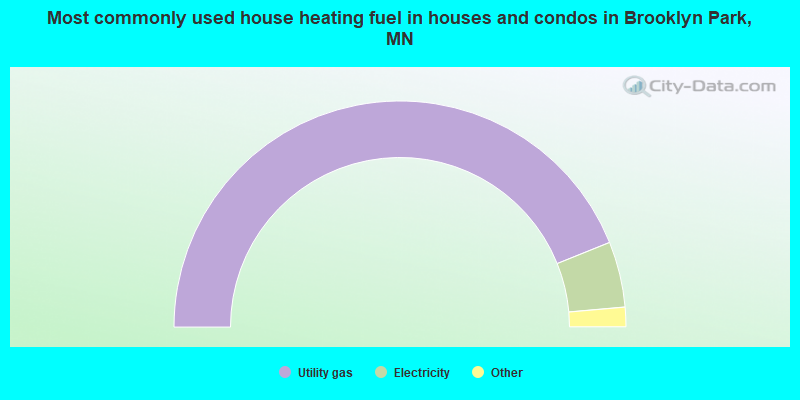
House heating fuel used in houses and condos - Utility gas (%)
House heating fuel used in houses and condos - Bottled, tank, or LP gas (%)
House heating fuel used in houses and condos - Electricity (%)
House heating fuel used in houses and condos - Fuel oil, kerosene, etc. (%)
House heating fuel used in houses and condos - Coal or coke (%)
House heating fuel used in houses and condos - Wood (%)
House heating fuel used in houses and condos - Solar energy (%)
House heating fuel used in houses and condos - Other fuel (%)
House heating fuel used in houses and condos - No fuel used (%)
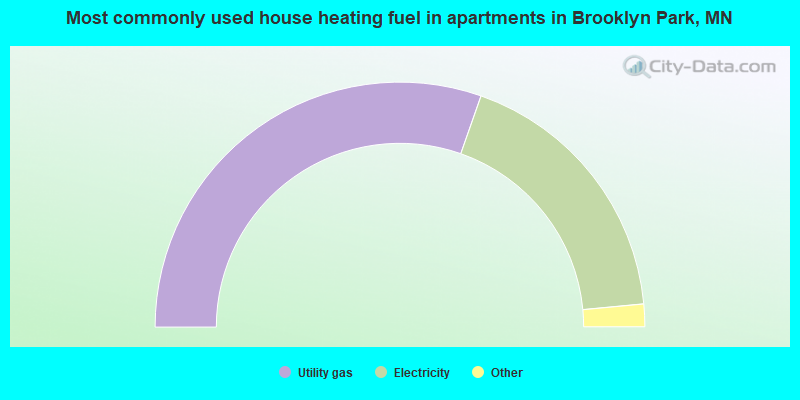
House heating fuel used in apartments - Utility gas (%)
House heating fuel used in apartments - Bottled, tank, or LP gas (%)
House heating fuel used in apartments - Electricity (%)
House heating fuel used in apartments - Fuel oil, kerosene, etc. (%)
House heating fuel used in apartments - Coal or coke (%)
House heating fuel used in apartments - Wood (%)
House heating fuel used in apartments - Solar energy (%)
House heating fuel used in apartments - Other fuel (%)
House heating fuel used in apartments - No fuel used (%)
Armed forces status - In Armed Forces (%)
Armed forces status - Civilian (%)
Armed forces status - Civilian - Veteran (%)
Armed forces status - Civilian - Nonveteran (%)
Fatal accidents locations in years 2005-2021
Fatal accidents locations in 2005
Fatal accidents locations in 2006
Fatal accidents locations in 2007
Fatal accidents locations in 2008
Fatal accidents locations in 2009
Fatal accidents locations in 2010
Fatal accidents locations in 2011
Fatal accidents locations in 2012
Fatal accidents locations in 2013
Fatal accidents locations in 2014
Fatal accidents locations in 2015
Fatal accidents locations in 2016
Fatal accidents locations in 2017
Fatal accidents locations in 2018
Fatal accidents locations in 2019
Fatal accidents locations in 2020
Fatal accidents locations in 2021
Alcohol use - People drinking some alcohol every month (%)
Alcohol use - People not drinking at all (%)
Alcohol use - Average days/month drinking alcohol
Alcohol use - Average drinks/week
Alcohol use - Average days/year people drink much
Audiometry - Average condition of hearing (%)
Audiometry - People that can hear a whisper from across a quiet room (%)
Audiometry - People that can hear normal voice from across a quiet room (%)
Audiometry - Ears ringing, roaring, buzzing (%)
Audiometry - Had a job exposure to loud noise (%)
Audiometry - Had off-work exposure to loud noise (%)
Blood Pressure & Cholesterol - Has high blood pressure (%)
Blood Pressure & Cholesterol - Checking blood pressure at home (%)
Blood Pressure & Cholesterol - Frequently checking blood cholesterol (%)
Blood Pressure & Cholesterol - Has high cholesterol level (%)
Consumer Behavior - Money monthly spent on food at supermarket/grocery store
Consumer Behavior - Money monthly spent on food at other stores
Consumer Behavior - Money monthly spent on eating out
Consumer Behavior - Money monthly spent on carryout/delivered foods
Consumer Behavior - Income spent on food at supermarket/grocery store (%)
Consumer Behavior - Income spent on food at other stores (%)
Consumer Behavior - Income spent on eating out (%)
Consumer Behavior - Income spent on carryout/delivered foods (%)
Current Health Status - General health condition (%)
Current Health Status - Blood donors (%)
Current Health Status - Has blood ever tested for HIV virus (%)
Current Health Status - Left-handed people (%)
Dermatology - People using sunscreen (%)
Diabetes - Diabetics (%)
Diabetes - Had a blood test for high blood sugar (%)
Diabetes - People taking insulin (%)
Diet Behavior & Nutrition - Diet health (%)
Diet Behavior & Nutrition - Milk product consumption (# of products/month)
Diet Behavior & Nutrition - Meals not home prepared (#/week)
Diet Behavior & Nutrition - Meals from fast food or pizza place (#/week)
Diet Behavior & Nutrition - Ready-to-eat foods (#/month)
Diet Behavior & Nutrition - Frozen meals/pizza (#/month)
Drug Use - People that ever used marijuana or hashish (%)
Drug Use - Ever used hard drugs (%)
Drug Use - Ever used any form of cocaine (%)
Drug Use - Ever used heroin (%)
Drug Use - Ever used methamphetamine (%)
Health Insurance - People covered by health insurance (%)
Kidney Conditions-Urology - Avg. # of times urinating at night
Medical Conditions - People with asthma (%)
Medical Conditions - People with anemia (%)
Medical Conditions - People with psoriasis (%)
Medical Conditions - People with overweight (%)
Medical Conditions - Elderly people having difficulties in thinking or remembering (%)
Medical Conditions - People who ever received blood transfusion (%)
Medical Conditions - People having trouble seeing even with glass/contacts (%)
Medical Conditions - People with arthritis (%)
Medical Conditions - People with gout (%)
Medical Conditions - People with congestive heart failure (%)
Medical Conditions - People with coronary heart disease (%)
Medical Conditions - People with angina pectoris (%)
Medical Conditions - People who ever had heart attack (%)
Medical Conditions - People who ever had stroke (%)
Medical Conditions - People with emphysema (%)
Medical Conditions - People with thyroid problem (%)
Medical Conditions - People with chronic bronchitis (%)
Medical Conditions - People with any liver condition (%)
Medical Conditions - People who ever had cancer or malignancy (%)
Mental Health - People who have little interest in doing things (%)
Mental Health - People feeling down, depressed, or hopeless (%)
Mental Health - People who have trouble sleeping or sleeping too much (%)
Mental Health - People feeling tired or having little energy (%)
Mental Health - People with poor appetite or overeating (%)
Mental Health - People feeling bad about themself (%)
Mental Health - People who have trouble concentrating on things (%)
Mental Health - People moving or speaking slowly or too fast (%)
Mental Health - People having thoughts they would be better off dead (%)
Oral Health - Average years since last visit a dentist
Oral Health - People embarrassed because of mouth (%)
Oral Health - People with gum disease (%)
Oral Health - General health of teeth and gums (%)
Oral Health - Average days a week using dental floss/device
Oral Health - Average days a week using mouthwash for dental problem
Oral Health - Average number of teeth
Pesticide Use - Households using pesticides to control insects (%)
Pesticide Use - Households using pesticides to kill weeds (%)
Physical Activity - People doing vigorous-intensity work activities (%)
Physical Activity - People doing moderate-intensity work activities (%)
Physical Activity - People walking or bicycling (%)
Physical Activity - People doing vigorous-intensity recreational activities (%)
Physical Activity - People doing moderate-intensity recreational activities (%)
Physical Activity - Average hours a day doing sedentary activities
Physical Activity - Average hours a day watching TV or videos
Physical Activity - Average hours a day using computer
Physical Functioning - People having limitations keeping them from working (%)
Physical Functioning - People limited in amount of work they can do (%)
Physical Functioning - People that need special equipment to walk (%)
Physical Functioning - People experiencing confusion/memory problems (%)
Physical Functioning - People requiring special healthcare equipment (%)
Prescription Medications - Average number of prescription medicines taking
Preventive Aspirin Use - Adults 40+ taking low-dose aspirin (%)
Reproductive Health - Vaginal deliveries (%)
Reproductive Health - Cesarean deliveries (%)
Reproductive Health - Deliveries resulted in a live birth (%)
Reproductive Health - Pregnancies resulted in a delivery (%)
Reproductive Health - Women breastfeeding newborns (%)
Reproductive Health - Women that had a hysterectomy (%)
Reproductive Health - Women that had both ovaries removed (%)
Reproductive Health - Women that have ever taken birth control pills (%)
Reproductive Health - Women taking birth control pills (%)
Reproductive Health - Women that have ever used Depo-Provera or injectables (%)
Reproductive Health - Women that have ever used female hormones (%)
Sexual Behavior - People 18+ that ever had sex (vaginal, anal, or oral) (%)
Sexual Behavior - Males 18+ that ever had vaginal sex with a woman (%)
Sexual Behavior - Males 18+ that ever performed oral sex on a woman (%)
Sexual Behavior - Males 18+ that ever had anal sex with a woman (%)
Sexual Behavior - Males 18+ that ever had any sex with a man (%)
Sexual Behavior - Females 18+ that ever had vaginal sex with a man (%)
Sexual Behavior - Females 18+ that ever performed oral sex on a man (%)
Sexual Behavior - Females 18+ that ever had anal sex with a man (%)
Sexual Behavior - Females 18+ that ever had any kind of sex with a woman (%)
Sexual Behavior - Average age people first had sex
Sexual Behavior - Average number of female sex partners in lifetime (males 18+)
Sexual Behavior - Average number of female vaginal sex partners in lifetime (males 18+)
Sexual Behavior - Average age people first performed oral sex on a woman (18+)
Sexual Behavior - Average number of woman performed oral sex on in lifetime (18+)
Sexual Behavior - Average number of male sex partners in lifetime (males 18+)
Sexual Behavior - Average number of male anal sex partners in lifetime (males 18+)
Sexual Behavior - Average age people first performed oral sex on a man (18+)
Sexual Behavior - Average number of male oral sex partners in lifetime (18+)
Sexual Behavior - People using protection when performing oral sex (%)
Sexual Behavior - Average number of times people have vaginal or anal sex a year
Sexual Behavior - People having sex without condom (%)
Sexual Behavior - Average number of male sex partners in lifetime (females 18+)
Sexual Behavior - Average number of male vaginal sex partners in lifetime (females 18+)
Sexual Behavior - Average number of female sex partners in lifetime (females 18+)
Sexual Behavior - Circumcised males 18+ (%)
Sleep Disorders - Average hours sleeping at night
Sleep Disorders - People that has trouble sleeping (%)
Smoking-Cigarette Use - People smoking cigarettes (%)
Taste & Smell - People 40+ having problems with smell (%)
Taste & Smell - People 40+ having problems with taste (%)
Taste & Smell - People 40+ that ever had wisdom teeth removed (%)
Taste & Smell - People 40+ that ever had tonsils teeth removed (%)
Taste & Smell - People 40+ that ever had a loss of consciousness because of a head injury (%)
Taste & Smell - People 40+ that ever had a broken nose or other serious injury to face or skull (%)
Taste & Smell - People 40+ that ever had two or more sinus infections (%)
Weight - Average height (inches)
Weight - Average weight (pounds)
Weight - Average BMI
Weight - People that are obese (%)
Weight - People that ever were obese (%)
Weight - People trying to lose weight (%)
The City-Data.com crime index weighs serious crimes and violent crimes more heavily. Higher means more crime, U.S. average is 246.1. It adjusts for the number of visitors and daily workers commuting into cities.
- means the value is smaller than the state average.
- means the value is about the same as the state average.
- means the value is bigger than the state average.
- means the value is much bigger than the state average.
Crime rate in Brooklyn Park detailed stats: murders, rapes, robberies, assaults, burglaries, thefts, arson Officers per 1,000 residents here:
1.23Minnesota average:
1.76
Latest news from Brooklyn Park, MN collected exclusively by city-data.com from local newspapers, TV, and radio stations
Brooklyn Park, MN City Guides: Ancestries: Liberian (7.4%), German (6.8%), African (4.6%), American (3.4%), Ethiopian (3.0%), Nigerian (2.3%).
Current Local Time:
Land area: 26.1 square miles.
Population density: 3,198 people per square mile (average).
21,650 residents are foreign born (12.2% Africa , 8.5% Asia , 2.9% Latin America ).
This city:
25.7%Minnesota:
8.5%
Median real estate property taxes paid for housing units with mortgages in 2022: $3,389 (1.1%)Median real estate property taxes paid for housing units with no mortgage in 2022: $3,406 (1.1%)
Nearest city with pop. 200,000+: Minneapolis, MN
Nearest city with pop. 1,000,000+: Chicago, IL
Nearest cities:
Latitude: 45.10 N, Longitude: 93.35 W
Daytime population change due to commuting: -9,290 (-11.1%)Workers who live and work in this city: 11,671 (28.0%)
Area code commonly used in this area: 763
Single-family new house construction building permits:
2022: 16 buildings , average cost: $308,4002021: 74 buildings , average cost: $284,3002020: 62 buildings , average cost: $274,2002019: 99 buildings , average cost: $267,2002018: 124 buildings , average cost: $258,5002017: 116 buildings , average cost: $257,6002016: 135 buildings , average cost: $252,3002015: 134 buildings , average cost: $243,4002014: 114 buildings , average cost: $224,5002013: 130 buildings , average cost: $222,1002012: 146 buildings , average cost: $225,7002011: 77 buildings , average cost: $221,6002010: 53 buildings , average cost: $193,5002009: 109 buildings , average cost: $199,4002008: 118 buildings , average cost: $183,8002007: 133 buildings , average cost: $221,3002006: 428 buildings , average cost: $218,2002005: 448 buildings , average cost: $214,2002004: 503 buildings , average cost: $203,2002003: 444 buildings , average cost: $152,9002002: 252 buildings , average cost: $128,7002001: 272 buildings , average cost: $121,0002000: 293 buildings , average cost: $111,1001999: 409 buildings , average cost: $116,3001998: 307 buildings , average cost: $117,2001997: 332 buildings , average cost: $107,600Unemployment in December 2023:
Population change in the 1990s: +10,938 (+19.4%).
Most common occupations in Brooklyn Park, MN (%)
Both Males Females
Other management occupations, except farmers and farm managers (4.8%)
Assemblers and fabricators (4.8%)
Nursing, psychiatric, and home health aides (4.7%)
Cooks and food preparation workers (4.4%)
Other production occupations, including supervisors (4.1%)
Computer specialists (3.8%)
Building and grounds cleaning and maintenance occupations (3.1%)
Assemblers and fabricators (5.9%)
Other management occupations, except farmers and farm managers (5.7%)
Computer specialists (5.4%)
Other production occupations, including supervisors (4.8%)
Material recording, scheduling, dispatching, and distributing workers (3.9%)
Cooks and food preparation workers (3.7%)
Metal workers and plastic workers (3.4%)
Nursing, psychiatric, and home health aides (6.5%)
Cooks and food preparation workers (5.1%)
Information and record clerks, except customer service representatives (4.3%)
Secretaries and administrative assistants (4.1%)
Other management occupations, except farmers and farm managers (4.0%)
Assemblers and fabricators (3.7%)
Other office and administrative support workers, including supervisors (3.4%)
Tornado activity:
Brooklyn Park-area historical tornado activity is slightly above Minnesota state average. It is 25% greater than the overall U.S. average.
On 5/6/1965, a category F4 (max. wind speeds 207-260 mph) tornado 5.9 miles away from the Brooklyn Park city center killed 3 people and injured 175 people and caused between $5,000,000 and $50,000,000 in damages.
On 6/19/1951, a category F4 tornado 8.2 miles away from the city center killed one person and injured 20 people and caused between $500,000 and $5,000,000 in damages.
Earthquake activity:
Brooklyn Park-area historical earthquake activity is significantly above Minnesota state average. It is 55% smaller than the overall U.S. average. On 7/9/1975 at 14:54:15, a magnitude 4.6 (4.6 MB, Class: Light, Intensity: IV - V) earthquake occurred 136.6 miles away from Brooklyn Park center On 6/5/1993 at 01:24:53, a magnitude 4.1 (4.1 LG, Depth: 6.2 mi) earthquake occurred 148.5 miles away from Brooklyn Park center On 3/4/1983 at 06:32:18, a magnitude 4.6 (4.4 MB, 4.6 LG, 4.4 ML) earthquake occurred 304.4 miles away from the city center On 10/20/1995 at 15:57:18, a magnitude 3.7 (3.7 LG, Depth: 3.1 mi, Class: Light, Intensity: II - III) earthquake occurred 177.1 miles away from the city center On 2/9/1994 at 08:45:35, a magnitude 3.1 (3.1 LG, Depth: 3.1 mi) earthquake occurred 81.1 miles away from the city center On 11/3/2002 at 20:41:56, a magnitude 4.3 (4.3 MB, Depth: 3.1 mi) earthquake occurred 319.9 miles away from Brooklyn Park center Magnitude types: regional Lg-wave magnitude (LG), body-wave magnitude (MB), local magnitude (ML) Natural disasters: The number of natural disasters in Hennepin County (17) is near the US average (15).Major Disasters (Presidential) Declared: 12Emergencies Declared: 4Floods: 11, Storms: 8, Tornadoes: 4, Winds: 3, Drought: 1, Hurricane: 1, Landslide: 1, Mudslide: 1, Other: 2 (Note: some incidents may be assigned to more than one category). Main business address for: WILSONS THE LEATHER EXPERTS INC RETAIL-FAMILY CLOTHING STORES ).
Hospitals and medical centers in Brooklyn Park: DCI EDGEWOOD (6525 EDGEWOOD AVE NO) HOMEWARD BOUND BROOKLYN PARK (7839 BROOKLYN BLVD) SHINGLE CREEK OPTION (5624 73RD AVE NO) HENNEPIN HOME HEALTH CARE INC (8590 EDINBURGH CENTER DRIVE, SUITE 350)
INTEGRATED NURSING AND HEALTH SERVICES INC (7100 NORTHLAND CIRCLE SUITE 119A)
UNIVERSAL PEDIATRIC SERV INC (7100 NORTHLAND CIRCLE SUITE 117)
VIZION ONE INC (6001 78TH AVENUE NORTH STE 206)
Amtrak station near Brooklyn Park: 13 miles: ST. PAUL/MINNEAPOLIS (ST. PAUL, 730 TRANSFER RD.) Services: ticket office, fully wheelchair accessible, enclosed waiting area, public restrooms, public payphones, vending machines, free short-term parking, free long-term parking, call for car rental service, taxi stand.
Colleges/Universities in Brooklyn Park: North Hennepin Community College Full-time enrollment: 4,943; Location: 7411 85th Ave N; Public; Website: www.nhcc.edu)
Hennepin Technical College Full-time enrollment: 4,515; Location: 9000 Brooklyn Blvd; Public; Website: www.hennepintech.edu)
Other colleges/universities with over 2000 students near Brooklyn Park:
Anoka-Ramsey Community College (about 5 miles; Coon Rapids, MN ; Full-time enrollment: 5,918)
Walden University (about 10 miles; Minneapolis, MN ; FT enrollment: 62,473)
Minneapolis Community and Technical College (about 10 miles; Minneapolis, MN ; FT enrollment: 6,726)
Capella University (about 10 miles; Minneapolis, MN ; FT enrollment: 21,718)
Bethel University (about 10 miles; Saint Paul, MN ; FT enrollment: 4,061)
University of Northwestern-St Paul (about 10 miles; Saint Paul, MN ; FT enrollment: 2,680)
University of Minnesota-Twin Cities (about 11 miles; Minneapolis, MN ; FT enrollment: 43,506)
Biggest public high schools in Brooklyn Park: HENNEPIN TECHNICAL PATHWAYS Location: 9000 BROOKLYN BLVD, Grades: 7-12)ALC BROOKLYN PARK CAMPUS - IS Location: 9000 BROOKLYN BLVD, Grades: 9-12)
OFF CAMPUS CTE Location: 9000 BROOKLYN BLVD, Grades: 10-12)
4126 - PRAIRIE SEEDS ACADEMY - IS Location: 6200 WEST BROADWAY AVE, Grades: 9-12)HENNEPIN GATEWAY TO COLLEGE Location: 9000 BROOKLYN BLVD, Grades: 9-12)
SAGE ACADEMY CHARTER SCHOOL Location: 3900 85TH AVE N, Grades: 9-12, Charter school )PRAIRIE SEEDS HIGH SCHOOL ACADEMY Location: 6200 W. BROADWAY AVE. N., Grades: 9-12, Charter school )BROOKLYN JUNIOR HIGH Location: 7377 NOBLE AVE N, Grades: 7-9)NORTH VIEW IB WORLD SCHOOL Location: 5869 69TH AVE N, Grades: 7-9)PARK CENTER IB WORLD SCHOOL Location: 7300 BROOKLYN BLVD, Grades: 10-12)Private high school in Brooklyn Park: MARANATHA CHRISTIAN ACADEMY Students: 662, Location: 9201 75TH AVE N, Grades: PK-12)
Biggest public elementary/middle schools in Brooklyn Park: ATHLOS LEADERSHIP ACADEMY Location: 10100 NOBLE PARKWAY NORTH, Grades: PK-8, Charter school )
EXCELL ACADEMY CHARTER Location: 6510 ZANE AVE N STE 107, Grades: PK-8, Charter school )PRAIRIE SEEDS EL SCHOOL ACADEMY Location: 6200 WEST BROADWAY AVE N, Grades: KG-5, Charter school )
PRAIRIE SEEDS MIDDLE SCHOOL ACADEMY Location: 6200 W. BROADWAY AVE. N., Grades: 6-8, Charter school )
MONROE ELEMENTARY Location: 901 BROOKDALE DR N, Grades: KG-5)
BIRCH GROVE SCHOOL FOR THE ARTS Location: 4690 BROOKDALE DR N, Grades: KG-6)CREST VIEW ELEMENTARY Location: 8200 ZANE AVE N, Grades: PK-6)FAIR OAKS ELEMENTARY Location: 5600 65TH AVE N, Grades: PK-4)PALMER LAKE ELEMENTARY Location: 7300 W PALMER LAKE DR, Grades: KG-6)PARK BROOK ELEMENTARY Location: 7400 HAMPSHIRE AVE N, Grades: KG-6)Private elementary/middle school in Brooklyn Park:
See full list of schools located in Brooklyn Park User-submitted facts and corrections:
Former home of professional wrestler, Mayor of Brooklyn Park and Governor of Minnsota Jesse (The Body) Ventura.
Notable locations in Brooklyn Park: (A) , Edinburgh Golf Course (B) , Brooklyn Park Golf Course (C) , Brooklyn Park Fire Department Station 1 East (D) , Brooklyn Park Fire Department Station 3 West (E) , Brooklyn Park Fire Department Station 4 North (F) , Brooklyn Park Fire Department Station 2 Central (G) , Brooklyn Park Library (H) , Brooklyn Park City Hall (I) , Brooklyn Park Chamber of Commerce (J) , Brooklyn Park Activity Center (K) . Display/hide their locations on the map
Shopping Centers: (1) , Creekside Plaza Shopping Center (2) , Edinburgh Center Shopping Center (3) , Northwind Plaza Shopping Center (4) , Park Commons Shopping Center (5) , Park East Shopping Center (6) , Park Place Centre Shopping Center (7) , Park Square Shopping Center (8) , Starlite Shopping Center (9) . Display/hide their locations on the map
Churches in Brooklyn Park include: (A) , Brooklyn Park Church (B) , West River Road Baptist Church (C) , The Church in Brooklyn Park (D) , Shiloh Temple of Brooklyn Park (E) , Saint Gerard Church (F) , Resurrecting Faith Ministries Church (G) , Promised Land Church (H) , Pine Grove Bible Church (I) . Display/hide their locations on the map
Cemetery: (1) . Display/hide its location on the map
Lake: (A) . Display/hide its location on the map
Creeks: (A) , Bass Creek (B) . Display/hide their locations on the map
Parks in Brooklyn Park include: (1) , Hartkopf Park (2) , Newton Park (3) , River Park (4) , Shingle Creek Park (5) , Striefel Park (6) , Sunny Lane Park (7) , Willowstone Park (8) , Zanewood Park (9) . Display/hide their locations on the map
Birthplace of: Krissy Wendell-Pohl - Ice hockey player, Travis Morin - Ice hockey player, Brandon Smith - College basketball player (Minnesota Golden Gophers), Joshua Okoampa - Soccer player, Miles Webb - College basketball player (Minnesota Golden Gophers).
Hennepin County has a predicted average indoor radon screening level greater than 4 pCi/L (pico curies per liter) - Highest Potential Drinking water stations with addresses in Brooklyn Park and their reported violations in the past:
SPLIT RIDGE CAMPGROUND (Serves WI, Population served: 25, Groundwater):
Past health violations:
MCL, Monthly (TCR) - In MAY-2011, Contaminant: Coliform. Follow-up actions: St Public Notif requested (JUN-01-2011), St Other (JUN-01-2011), St Violation/Reminder Notice (JUN-01-2011), St Public Notif received (JUN-13-2011), St Other (JUN-23-2011), St Compliance achieved (JUN-23-2011)
Drinking water stations with addresses in Brooklyn Park that have no violations reported:
BROOKLYN PARK (Address: 5200 85th Avenue North Population served: 74,500, Primary Water Source Type: Groundwater)
Average household size: This city:
2.9 peopleMinnesota:
2.5 people
Percentage of family households: This city:
71.5%Whole state:
64.6%
Percentage of households with unmarried partners: This city:
7.2%Whole state:
6.9%
Likely homosexual households (counted as self-reported same-sex unmarried-partner households)
Lesbian couples: 0.4% of all households Gay men: 0.3% of all households
People in group quarters in Brooklyn Park in 2010:
176 people in group homes intended for adults
12 people in residential treatment centers for adults
9 people in group homes for juveniles (non-correctional)
8 people in nursing facilities/skilled-nursing facilities
4 people in other noninstitutional facilities
People in group quarters in Brooklyn Park in 2000:
181 people in homes for the mentally retarded
15 people in nursing homes
8 people in homes for the mentally ill
5 people in other noninstitutional group quarters
3 people in homes or halfway houses for drug/alcohol abuse
3 people in other group homes
3 people in religious group quarters
Banks with branches in Brooklyn Park (2011 data):
TCF National Bank: Brooklyn Park Branch, Brooklyn Park Cub Branch, Brooklyn Park North Cub Branch. Info updated 2009/11/23: Bank assets: $19,007.0 mil, Deposits: $12,377.0 mil, headquarters in Sioux Falls, SD, positive income , Commercial Lending Specialization, 441 total offices , Holding Company: Tcf Financial Corporation
Wells Fargo Bank, National Association: Brooklyn Park Branch at 8460 Zane Avenue North, branch established on 1981/04/06; Brooklyn Boulevard Branch at 8041 Brooklyn Boulevard, branch established on 1988/05/23. Info updated 2011/04/05: Bank assets: $1,161,490.0 mil, Deposits: $905,653.0 mil, headquarters in Sioux Falls, SD, positive income , 6395 total offices , Holding Company: Wells Fargo & Company
BMO Harris Bank National Association: Brooklyn Park Branch at 9600 Colorado Lane, branch established on 2008/05/05. Info updated 2011/07/14: Bank assets: $97,264.0 mil, Deposits: $75,624.6 mil, headquarters in Chicago, IL, positive income , 717 total offices , Holding Company: Bank Of Montreal
U.S. Bank National Association: Brooklyn Park Branch at 7600 West Broadway Avenue North, branch established on 1980/09/15. Info updated 2012/01/30: Bank assets: $330,470.8 mil, Deposits: $236,091.5 mil, headquarters in Cincinnati, OH, positive income , 3121 total offices , Holding Company: U.S. Bancorp
Bremer Bank, National Association: Brooklyn Park Branch at 8535 Edinburgh Drive, branch established on 1997/06/18. Info updated 2006/11/03: Bank assets: $2,725.5 mil, Deposits: $2,268.8 mil, headquarters in South St. Paul, MN, positive income , Commercial Lending Specialization, 29 total offices , Holding Company: Otto Bremer Foundation
Citizens Community Federal: Brooklyn Park at 8000 Lakeland Ave, branch established on 2008/07/30. Info updated 2011/07/21: Bank assets: $530.8 mil, Deposits: $444.7 mil, headquarters in Eau Claire, WI, positive income , Mortgage Lending Specialization, 28 total offices
For population 15 years and over in Brooklyn Park:
Never married: 34.2%Now married: 50.7%Separated: 1.2%Widowed: 5.7%Divorced: 8.2% For population 25 years and over in Brooklyn Park:
High school or higher: 88.8%Bachelor's degree or higher: 32.9%Graduate or professional degree: 10.2%Unemployed: 2.6%Mean travel time to work (commute): 17.0 minutes
Education Gini index (Inequality in education) Here:
14.2Minnesota average:
10.9
Religion statistics for Brooklyn Park, MN (based on Hennepin County data)
Religion Adherents Congregations Catholic 215,205 74 Mainline Protestant 193,498 234 Evangelical Protestant 162,094 393 Other 41,287 110 Black Protestant 10,812 21 Orthodox 3,337 6 None 526,192 -
Source: Clifford Grammich, Kirk Hadaway, Richard Houseal, Dale E.Jones, Alexei Krindatch, Richie Stanley and Richard H.Taylor. 2012. 2010 U.S.Religion Census: Religious Congregations & Membership Study. Association of Statisticians of American Religious Bodies. Jones, Dale E., et al. 2002. Congregations and Membership in the United States 2000. Nashville, TN: Glenmary Research Center. Graphs represent county-level data
Food Environment Statistics: Number of grocery stores : 203This county :
1.79 / 10,000 pop.Minnesota :
1.83 / 10,000 pop.
Number of supercenters and club stores : 14Hennepin County :
0.12 / 10,000 pop.Minnesota :
0.13 / 10,000 pop.
Number of convenience stores (no gas) : 78Hennepin County :
0.69 / 10,000 pop.State :
0.49 / 10,000 pop.
Number of convenience stores (with gas) : 283Hennepin County :
2.50 / 10,000 pop.State :
3.90 / 10,000 pop.
Number of full-service restaurants : 807Hennepin County :
7.13 / 10,000 pop.Minnesota :
6.98 / 10,000 pop.
Adult diabetes rate : This county :
5.8%State :
6.5%
Adult obesity rate : Hennepin County :
22.8%State :
25.9%
Low-income preschool obesity rate : This county :
15.2%Minnesota :
13.0%
Health and Nutrition: Healthy diet rate : Brooklyn Park:
48.3%State:
50.6%
Average overall health of teeth and gums : Here:
45.3%Minnesota:
48.4%
People feeling badly about themselves : Brooklyn Park:
21.6%Minnesota:
21.0%
People not drinking alcohol at all : Brooklyn Park:
10.9%Minnesota:
9.8%
Average hours sleeping at night : Overweight people : This city:
32.5%Minnesota:
33.5%
General health condition : Brooklyn Park:
56.2%Minnesota:
57.7%
Average condition of hearing : Brooklyn Park:
80.9%Minnesota:
79.3%
More about Health and Nutrition of Brooklyn Park, MN Residents
Local government employment and payroll (March 2022)
Function
Full-time employees
Monthly full-time payroll
Average yearly full-time wage
Part-time employees
Monthly part-time payroll
Police Protection - Officers
91 $784,055 $103,392 0 $0 Streets and Highways
37 $265,997 $86,269 15 $22,371 Other and Unallocable
31 $184,751 $71,517 35 $27,459 Health
29 $183,325 $75,859 6 $7,369 Police - Other
20 $128,302 $76,981 39 $53,539 Parks and Recreation
19 $138,734 $87,621 100 $61,627 Financial Administration
18 $130,020 $86,680 0 $0 Sewerage
14 $109,553 $93,903 0 $0 Water Supply
11 $75,656 $82,534 0 $0 Housing and Community Development (Local)
11 $73,612 $80,304 0 $0 Firefighters
9 $77,646 $103,528 244 $195,309 Other Government Administration
7 $76,474 $131,098 0 $0 Solid Waste Management
4 $28,407 $85,221 0 $0 Fire - Other
3 $13,770 $55,080 0 $0 Judicial and Legal
0 $0 4 $4,991
Totals for Government
304 $2,270,302 $89,617 443 $372,665
Brooklyn Park government finances - Expenditure in 2021 (per resident):
Construction - Regular Highways: $24,990,000 ($299.91)
Current Operations - Police Protection: $25,940,000 ($311.31)
Water Utilities: $18,014,000 ($216.19)General - Other: $17,798,000 ($213.60)Parks and Recreation: $12,259,000 ($147.12)Local Fire Protection: $6,399,000 ($76.80)Regular Highways: $6,337,000 ($76.05)Housing and Community Development: $1,854,000 ($22.25)Financial Administration: $1,533,000 ($18.40)Central Staff Services: $239,000 ($2.87)General - Interest on Debt: $1,747,000 ($20.97)
Other Capital Outlay - Regular Highways: $6,165,000 ($73.99)
Parks and Recreation: $2,933,000 ($35.20)Water Utilities: $1,782,000 ($21.39)General - Other: $538,000 ($6.46)Local Fire Protection: $49,000 ($0.59)Water Utilities - Interest on Debt: $414,000 ($4.97)
Brooklyn Park government finances - Revenue in 2021 (per resident):
Charges - Regular Highways: $5,251,000 ($63.02)
Parks and Recreation: $3,884,000 ($46.61)Other: $1,797,000 ($21.57)Federal Intergovernmental - Highways: $21,436,000 ($257.26)
Health and Hospitals: $6,189,000 ($74.28)Housing and Community Development: $221,000 ($2.65)Local Intergovernmental - Other: $2,657,000 ($31.89)
Miscellaneous - Interest Earnings: $4,884,000 ($58.61)
General Revenue - Other: $1,871,000 ($22.45)Special Assessments: $1,247,000 ($14.97)Fines and Forfeits: $300,000 ($3.60)Revenue - Water Utilities: $20,537,000 ($246.47)
State Intergovernmental - Other: $7,869,000 ($94.44)
General Local Government Support: $1,430,000 ($17.16)Water Utilities: $125,000 ($1.50)Tax - Property: $49,554,000 ($594.71)
Public Utilities Sales: $6,133,000 ($73.60)Other License: $2,547,000 ($30.57)Other Selective Sales: $10,000 ($0.12)
Brooklyn Park government finances - Debt in 2021 (per resident):
Long Term Debt - Beginning Outstanding - Unspecified Public Purpose: $38,299,000 ($459.64)
Outstanding Unspecified Public Purpose: $34,945,000 ($419.39)Beginning Outstanding - Public Debt for Private Purpose: $27,202,000 ($326.46)Outstanding Nonguaranteed - Industrial Revenue: $26,371,000 ($316.49)Retired Unspecified Public Purpose: $3,369,000 ($40.43)Retired Nonguaranteed - Public Debt for Private Purpose: $831,000 ($9.97)Issue, Unspecified Public Purpose: $15,000 ($0.18)
Brooklyn Park government finances - Cash and Securities in 2021 (per resident):
Other Funds - Cash and Securities: $55,352,000 ($664.30)
Sinking Funds - Cash and Securities: $26,371,000 ($316.49)
6.75% of this county's 2021 resident taxpayers lived in other counties in 2020 ($70,758 average adjusted gross income )
Here:
6.75%Minnesota average:
7.43%
0.00% of residents moved from foreign countries ($39 average AGI )Hennepin County:
0.00%Minnesota average:
0.00%
Top counties from which taxpayers relocated into this county between 2020 and 2021:
8.44% of this county's 2020 resident taxpayers moved to other counties in 2021 ($85,733 average adjusted gross income )
Here:
8.44%Minnesota average:
7.79%
0.01% of residents moved to foreign countries ($68 average AGI )Hennepin County:
0.01%Minnesota average:
0.00%
Top counties to which taxpayers relocated from this county between 2020 and 2021:
Businesses in Brooklyn Park, MN
Name Count Name Count
ALDI 1 LA Fitness 1 Ace Hardware 1 La Quinta 1 Arby's 1 Little Caesars Pizza 2 AutoZone 1 MasterBrand Cabinets 1 Bakers Square 1 McDonald's 3 Blockbuster 1 Menards 1 Brunswick Bowling & Billiards 1 Nissan 1 Burger King 2 OfficeMax 1 CVS 1 Papa John's Pizza 1 Caribou Coffee 3 Penske 1 Chipotle 1 Pizza Hut 1 Curves 1 Sprint Nextel 2 Dairy Queen 2 Starbucks 1 Discount Tire 1 Subaru 1 Domino's Pizza 2 T-Mobile 2 Fashion Bug 1 T.J.Maxx 1 FedEx 3 Taco Bell 2 Firestone Complete Auto Care 1 Target 1 GNC 2 The Room Place 1 GameStop 1 U-Haul 1 H&R Block 1 UPS 2 Home Depot 1 Volkswagen 1 Hyundai 1 Walgreens 2 Jimmy John's 2 Walmart 1 Jones New York 1 Wendy's 1 KFC 2
Strongest AM radio stations in Brooklyn Park:
WCCO (830 AM; 50 kW; MINNEAPOLIS, MN; Owner: INFINITY MEDIA CORPORATION)
KLBP (1470 AM; 5 kW; BROOKLYN PARK, MN; Owner: 1400, INC.)
KSTP (1500 AM; 50 kW; ST. PAUL, MN; Owner: KSTP-AM, LLC (DELAWARE))
KTIS (900 AM; 25 kW; MINNEAPOLIS, MN; Owner: NORTHWESTERN COLLEGE)
WCTS (1030 AM; 50 kW; MAPLEWOOD, MN; Owner: CNTL. BAPT. THEO/AL SEMI MINNEAPOLIS)
KDIZ (1440 AM; 5 kW; GOLDEN VALLEY, MN; Owner: KQRS, INC.)
KUOM (770 AM; daytime; 5 kW; MINNEAPOLIS, MN)
KFAN (1130 AM; 50 kW; MINNEAPOLIS, MN; Owner: AMFM RADIO LICENSES, L.L.C.)
WWTC (1280 AM; 5 kW; MINNEAPOLIS, MN; Owner: SCA LICENSE CORPORATION)
KYCR (1570 AM; 4 kW; GOLDEN VALLEY, MN; Owner: COMMON GROUND BROADCASTING COMPANY,)
KFXN (690 AM; 0 kW; MINNEAPOLIS, MN; Owner: AMFM RADIO LICENSES, L.L.C.)
WMNN (1330 AM; 10 kW; MINNEAPOLIS, MN; Owner: MINNESOTA PUBLIC RADIO.)
KSMM (1530 AM; 9 kW; SHAKOPEE, MN; Owner: STARBOARD BROADCASTING, INC.)
Strongest FM radio stations in Brooklyn Park:
KTCZ-FM (97.1 FM; MINNEAPOLIS, MN; Owner: AMFM RADIO LICENSES, L.L.C.)
KQQL (107.9 FM; ANOKA, MN; Owner: AMFM RADIO LICENSES, L.L.C.)
KNOW-FM (91.1 FM; MINNEAPOLIS-ST. PAUL, MN; Owner: MINNESOTA PUBLIC RADIO)
WLTE (102.9 FM; MINNEAPOLIS, MN; Owner: INFINITY MEDIA CORPORATION)
KSTP-FM (94.5 FM; ST. PAUL, MN; Owner: KSTP-FM, LLC, A DELAWARE LLC)
KEEY-FM (102.1 FM; ST. PAUL, MN; Owner: AMFM RADIO LICENSES, L.L.C.)
KTIS-FM (98.5 FM; MINNEAPOLIS, MN; Owner: NORTHWESTERN COLLEGE)
KDWB-FM (101.3 FM; RICHFIELD, MN; Owner: AMFM RADIO LICENSES, L.L.C.)
KQRS-FM (92.5 FM; GOLDEN VALLEY, MN; Owner: KQRS, Inc.)
KSJN (99.5 FM; MINNEAPOLIS, MN; Owner: MINNESOTA PUBLIC RADIO)
KXXR (93.7 FM; MINNEAPOLIS, MN; Owner: KQRS, INC.)
K214DF (90.7 FM; GOLDEN VALLEY, MN; Owner: EDUCATIONAL MEDIA FOUNDATION)
KJZI (100.3 FM; MINNEAPOLIS, MN; Owner: AMFM RADIO LICENSES, L.L.C.)
KFAI (90.3 FM; MINNEAPOLIS, MN; Owner: FRESH AIR, INC.)
KBEM-FM (88.5 FM; MINNEAPOLIS, MN; Owner: BD. OF EDUCATION, S.S.D. NO. 1)
WFMP (107.1 FM; COON RAPIDS, MN; Owner: WFMP-FM, LLC)
WXPT (104.1 FM; ST. LOUIS PARK, MN; Owner: THE AUDIO HOUSE, INC.)
WGVZ (105.7 FM; EDEN PRAIRIE, MN; Owner: KQRS, INC.)
KNOF (95.3 FM; ST. PAUL, MN; Owner: SELBY GOSPEL BROADCASTING CORPORATION)
WCAL (89.3 FM; NORTHFIELD, MN; Owner: ST. OLAF COLLEGE)
TV broadcast stations around Brooklyn Park:
KARE (Channel 11; MINNEAPOLIS, MN; Owner: MULTIMEDIA HOLDINGS CORPORATION)
KSTP-TV (Channel 5; ST. PAUL, MN; Owner: HUBBARD BROADCASTING, INC.)
KMSP-TV (Channel 9; MINNEAPOLIS, MN; Owner: FOX TELEVISION STATIONS, INC.)
KTCA-TV (Channel 2; ST. PAUL, MN; Owner: TWIN CITIES PUBLIC TELEVISION, INC.)
WCCO-TV (Channel 4; MINNEAPOLIS, MN; Owner: CBS BROADCASTING INC.)
KSTC-TV (Channel 45; MINNEAPOLIS, MN; Owner: HUBBARD BROADCASTING, INC.)
K07UI (Channel 7; MINNEAPOLIS, ETC., MN; Owner: WORD OF GOD FELLOWSHIP, INC.)
KTCI-TV (Channel 17; ST. PAUL, MN; Owner: TWIN CITIES PUBLIC TELEVISION, INC.)
KMWB (Channel 23; MINNEAPOLIS, MN; Owner: KLGT LICENSEE, LLC)
WFTC (Channel 29; MINNEAPOLIS, MN; Owner: FOX TELEVISION STATIONS, INC.)
K58BS (Channel 58; MINNEAPOLIS, MN; Owner: TRINITY BROADCASTING NETWORK)
K67HG (Channel 67; MINNEAPOLIS, MN; Owner: VENTANA TELEVISION, INC.)
K19ER (Channel 19; ST. PAUL, MN; Owner: CATHOLIC VIEWS BROADCASTS, INC.)
W62BD (Channel 62; MINNEAPOLIS, MN; Owner: WORD OF GOD FELLOWSHIP, INC.)
K14KH (Channel 14; MINNEAPOLIS, MN; Owner: THREE ANGELS BROADCASTING NETWORK)
WBWX-CA (Channel 13; MINNEAPOLIS, MN; Owner: THE BOX WORLDWIDE LLC)
KPXM (Channel 41; ST. CLOUD, MN; Owner: PAXSON MINNEAPOLIS LICENSE, INC.)
National Bridge Inventory (NBI) Statistics 78 Number of bridges1,352ft / 412m Total length $840,000,000 Total costs2,686,360 Total average daily traffic116,143 Total average daily truck traffic
New bridges - historical statistics
12 1980-1989 28 1990-1999 32 2000-2009 4 2010-2019 2 2020-2022
See full National Bridge Inventory statistics for Brooklyn Park, MN
Home Mortgage Disclosure Act Aggregated Statistics For Year 2009(Based on 12 full tracts) A) FHA, FSA/RHS & VA B) Conventional C) Refinancings D) Home Improvement Loans E) Loans on Dwellings For 5+ Families F) Non-occupant Loans on G) Loans On Manufactured Number Average Value Number Average Value Number Average Value Number Average Value Number Average Value Number Average Value Number Average Value
LOANS ORIGINATED 857 $157,113 453 $145,328 1,433 $181,307 62 $66,113 0 $0 143 $110,537 2 $50,000 APPLICATIONS APPROVED, NOT ACCEPTED 49 $144,733 32 $134,906 135 $177,917 9 $42,556 0 $0 13 $88,768 0 $0 APPLICATIONS DENIED 145 $154,425 82 $137,755 650 $198,304 72 $41,764 1 $185,000 50 $101,738 2 $105,500 APPLICATIONS WITHDRAWN 72 $148,068 47 $110,104 390 $184,708 26 $86,958 0 $0 20 $106,646 0 $0 FILES CLOSED FOR INCOMPLETENESS 17 $177,115 12 $84,831 129 $168,378 10 $106,598 0 $0 5 $61,196 0 $0
Aggregated Statistics For Year 2008(Based on 12 full tracts) A) FHA, FSA/RHS & VA B) Conventional C) Refinancings D) Home Improvement Loans E) Loans on Dwellings For 5+ Families F) Non-occupant Loans on G) Loans On Manufactured Number Average Value Number Average Value Number Average Value Number Average Value Number Average Value Number Average Value Number Average Value
LOANS ORIGINATED 474 $178,530 537 $175,647 744 $171,430 92 $57,086 4 $7,893,240 98 $130,108 1 $41,000 APPLICATIONS APPROVED, NOT ACCEPTED 30 $187,395 83 $213,782 180 $193,414 28 $63,641 1 $3,975,000 8 $180,125 0 $0 APPLICATIONS DENIED 86 $182,997 209 $193,122 785 $195,292 172 $53,237 1 $194,000 57 $156,031 12 $42,500 APPLICATIONS WITHDRAWN 81 $173,502 69 $178,042 261 $192,495 33 $92,485 1 $80,000 23 $141,258 0 $0 FILES CLOSED FOR INCOMPLETENESS 10 $193,296 26 $187,152 112 $184,123 22 $56,409 0 $0 7 $160,851 0 $0
Aggregated Statistics For Year 2007(Based on 12 full tracts) A) FHA, FSA/RHS & VA B) Conventional C) Refinancings D) Home Improvement Loans E) Loans on Dwellings For 5+ Families F) Non-occupant Loans on G) Loans On Manufactured Number Average Value Number Average Value Number Average Value Number Average Value Number Average Value Number Average Value Number Average Value
LOANS ORIGINATED 75 $192,679 1,115 $187,539 1,355 $160,758 208 $55,739 5 $2,368,588 144 $169,231 1 $15,000 APPLICATIONS APPROVED, NOT ACCEPTED 6 $156,167 152 $198,418 346 $173,058 56 $58,268 0 $0 23 $151,388 3 $27,000 APPLICATIONS DENIED 10 $218,896 542 $216,194 1,335 $193,747 201 $73,690 0 $0 112 $188,229 20 $42,448 APPLICATIONS WITHDRAWN 10 $193,193 193 $198,184 521 $184,875 51 $92,900 0 $0 39 $152,609 1 $14,000 FILES CLOSED FOR INCOMPLETENESS 1 $194,000 81 $232,949 180 $195,616 6 $68,493 0 $0 18 $202,887 0 $0
Aggregated Statistics For Year 2006(Based on 12 full tracts) A) FHA, FSA/RHS & VA B) Conventional C) Refinancings D) Home Improvement Loans E) Loans on Dwellings For 5+ Families F) Non-occupant Loans on G) Loans On Manufactured Number Average Value Number Average Value Number Average Value Number Average Value Number Average Value Number Average Value Number Average Value
LOANS ORIGINATED 66 $177,876 2,117 $166,919 1,851 $160,428 292 $57,920 3 $3,325,000 247 $149,364 1 $12,000 APPLICATIONS APPROVED, NOT ACCEPTED 1 $195,000 501 $160,996 526 $165,605 58 $65,705 0 $0 74 $163,728 3 $38,333 APPLICATIONS DENIED 11 $168,273 980 $173,975 1,329 $179,267 195 $64,501 0 $0 154 $184,911 13 $31,691 APPLICATIONS WITHDRAWN 6 $164,333 382 $164,890 900 $183,106 58 $105,256 2 $1,143,000 93 $152,330 0 $0 FILES CLOSED FOR INCOMPLETENESS 1 $180,000 154 $184,308 285 $198,514 6 $143,500 0 $0 14 $183,499 0 $0
Aggregated Statistics For Year 2005(Based on 12 full tracts) A) FHA, FSA/RHS & VA B) Conventional C) Refinancings D) Home Improvement Loans E) Loans on Dwellings For 5+ Families F) Non-occupant Loans on G) Loans On Manufactured Number Average Value Number Average Value Number Average Value Number Average Value Number Average Value Number Average Value Number Average Value
LOANS ORIGINATED 73 $181,680 2,574 $163,274 2,313 $164,479 267 $65,003 7 $1,664,000 292 $154,008 0 $0 APPLICATIONS APPROVED, NOT ACCEPTED 5 $208,000 455 $144,507 463 $162,910 47 $66,680 1 $66,000 62 $143,659 4 $39,248 APPLICATIONS DENIED 7 $194,847 827 $157,431 1,358 $176,964 232 $71,310 0 $0 106 $160,729 27 $30,037 APPLICATIONS WITHDRAWN 10 $188,197 443 $166,679 989 $182,348 92 $102,596 0 $0 102 $172,830 2 $204,975 FILES CLOSED FOR INCOMPLETENESS 1 $213,000 170 $160,619 452 $197,477 18 $100,944 0 $0 26 $122,383 0 $0
Aggregated Statistics For Year 2004(Based on 12 full tracts) A) FHA, FSA/RHS & VA B) Conventional C) Refinancings D) Home Improvement Loans E) Loans on Dwellings For 5+ Families F) Non-occupant Loans on G) Loans On Manufactured Number Average Value Number Average Value Number Average Value Number Average Value Number Average Value Number Average Value Number Average Value
LOANS ORIGINATED 150 $176,760 2,047 $171,475 2,598 $159,479 302 $66,612 3 $3,161,000 247 $162,420 1 $134,000 APPLICATIONS APPROVED, NOT ACCEPTED 3 $181,310 307 $160,510 489 $157,058 51 $51,470 0 $0 47 $149,227 3 $48,663 APPLICATIONS DENIED 11 $192,727 493 $157,578 1,218 $166,652 261 $51,095 0 $0 86 $144,670 18 $41,778 APPLICATIONS WITHDRAWN 13 $167,231 225 $162,707 819 $169,333 74 $53,959 0 $0 43 $160,203 0 $0 FILES CLOSED FOR INCOMPLETENESS 2 $229,000 86 $172,671 397 $176,956 20 $99,900 0 $0 12 $168,575 0 $0
Aggregated Statistics For Year 2003(Based on 12 full tracts) A) FHA, FSA/RHS & VA B) Conventional C) Refinancings D) Home Improvement Loans E) Loans on Dwellings For 5+ Families F) Non-occupant Loans on Number Average Value Number Average Value Number Average Value Number Average Value Number Average Value Number Average Value
LOANS ORIGINATED 250 $165,053 1,608 $172,047 5,889 $139,645 304 $35,555 3 $693,333 213 $141,085 APPLICATIONS APPROVED, NOT ACCEPTED 6 $161,000 174 $171,469 639 $141,674 64 $36,968 0 $0 37 $154,968 APPLICATIONS DENIED 18 $174,549 249 $154,956 1,481 $140,620 168 $37,969 0 $0 60 $143,996 APPLICATIONS WITHDRAWN 9 $149,778 168 $156,835 1,228 $144,556 26 $33,922 0 $0 41 $161,552 FILES CLOSED FOR INCOMPLETENESS 7 $164,853 42 $188,806 297 $146,018 12 $32,083 0 $0 10 $149,689
Aggregated Statistics For Year 2002(Based on 8 full tracts) A) FHA, FSA/RHS & VA B) Conventional C) Refinancings D) Home Improvement Loans E) Loans on Dwellings For 5+ Families F) Non-occupant Loans on Number Average Value Number Average Value Number Average Value Number Average Value Number Average Value Number Average Value
LOANS ORIGINATED 281 $153,142 764 $138,884 2,511 $119,300 166 $27,529 4 $1,765,000 109 $128,451 APPLICATIONS APPROVED, NOT ACCEPTED 5 $143,600 79 $137,338 384 $116,540 40 $24,174 0 $0 6 $137,817 APPLICATIONS DENIED 15 $160,000 104 $131,312 799 $115,854 181 $21,513 0 $0 18 $101,881 APPLICATIONS WITHDRAWN 11 $143,361 84 $143,210 670 $124,019 25 $22,839 0 $0 8 $139,108 FILES CLOSED FOR INCOMPLETENESS 2 $167,000 31 $127,255 241 $125,278 1 $25,000 0 $0 7 $171,846
Aggregated Statistics For Year 2001(Based on 8 full tracts) A) FHA, FSA/RHS & VA B) Conventional C) Refinancings D) Home Improvement Loans E) Loans on Dwellings For 5+ Families F) Non-occupant Loans on Number Average Value Number Average Value Number Average Value Number Average Value Number Average Value Number Average Value
LOANS ORIGINATED 325 $141,357 652 $122,087 2,386 $106,439 250 $22,859 12 $1,576,417 76 $105,927 APPLICATIONS APPROVED, NOT ACCEPTED 5 $116,400 45 $114,573 257 $96,962 48 $16,333 0 $0 8 $87,618 APPLICATIONS DENIED 12 $117,746 83 $105,552 890 $91,710 185 $18,615 0 $0 21 $86,897 APPLICATIONS WITHDRAWN 19 $136,785 69 $135,099 632 $107,958 61 $21,343 0 $0 13 $96,229 FILES CLOSED FOR INCOMPLETENESS 6 $136,495 14 $123,071 146 $116,269 18 $33,111 0 $0 4 $119,485
Aggregated Statistics For Year 2000(Based on 8 full tracts) A) FHA, FSA/RHS & VA B) Conventional C) Refinancings D) Home Improvement Loans E) Loans on Dwellings For 5+ Families F) Non-occupant Loans on Number Average Value Number Average Value Number Average Value Number Average Value Number Average Value Number Average Value
LOANS ORIGINATED 307 $120,149 657 $108,027 680 $77,850 256 $19,081 1 $149,000 42 $105,542 APPLICATIONS APPROVED, NOT ACCEPTED 10 $113,095 69 $92,346 129 $82,121 62 $18,306 0 $0 3 $119,000 APPLICATIONS DENIED 18 $121,774 188 $79,870 527 $69,231 186 $22,032 1 $10,000 16 $82,245 APPLICATIONS WITHDRAWN 6 $104,333 41 $104,656 299 $86,793 45 $28,444 0 $0 12 $77,748 FILES CLOSED FOR INCOMPLETENESS 8 $114,125 16 $111,747 152 $101,582 5 $28,598 0 $0 1 $43,000
Aggregated Statistics For Year 1999(Based on 10 full tracts) A) FHA, FSA/RHS & VA B) Conventional C) Refinancings D) Home Improvement Loans E) Loans on Dwellings For 5+ Families F) Non-occupant Loans on Number Average Value Number Average Value Number Average Value Number Average Value Number Average Value Number Average Value
LOANS ORIGINATED 470 $114,363 1,167 $110,285 1,474 $84,363 318 $20,402 3 $2,141,983 66 $68,497 APPLICATIONS APPROVED, NOT ACCEPTED 12 $122,143 108 $94,769 321 $79,353 83 $18,999 0 $0 2 $61,150 APPLICATIONS DENIED 42 $105,663 295 $65,233 715 $70,559 226 $18,649 1 $19,780 22 $82,897 APPLICATIONS WITHDRAWN 12 $108,538 104 $95,996 460 $85,508 39 $43,060 0 $0 3 $99,400 FILES CLOSED FOR INCOMPLETENESS 5 $97,624 32 $73,922 186 $88,678 2 $8,490 0 $0 7 $70,383
Detailed mortgage data for all 12 tracts in Brooklyn Park, MN
Private Mortgage Insurance Companies Aggregated Statistics For Year 2009(Based on 12 full tracts) A) Conventional B) Refinancings C) Non-occupant Loans on Number Average Value Number Average Value Number Average Value
LOANS ORIGINATED 84 $190,677 30 $223,067 2 $89,000 APPLICATIONS APPROVED, NOT ACCEPTED 33 $182,999 15 $243,400 0 $0 APPLICATIONS DENIED 14 $140,643 7 $215,143 0 $0 APPLICATIONS WITHDRAWN 14 $160,571 5 $172,600 0 $0 FILES CLOSED FOR INCOMPLETENESS 5 $151,200 3 $190,640 0 $0
Aggregated Statistics For Year 2008(Based on 12 full tracts) A) Conventional B) Refinancings C) Non-occupant Loans on Number Average Value Number Average Value Number Average Value
LOANS ORIGINATED 230 $191,471 90 $224,653 15 $146,663 APPLICATIONS APPROVED, NOT ACCEPTED 104 $218,594 55 $227,307 9 $224,994 APPLICATIONS DENIED 25 $216,956 6 $206,333 4 $236,750 APPLICATIONS WITHDRAWN 21 $203,950 10 $214,992 6 $164,167 FILES CLOSED FOR INCOMPLETENESS 20 $177,447 6 $244,162 12 $163,078
Aggregated Statistics For Year 2007(Based on 12 full tracts) A) Conventional B) Refinancings C) Non-occupant Loans on Number Average Value Number Average Value Number Average Value
LOANS ORIGINATED 420 $212,983 157 $230,919 19 $162,784 APPLICATIONS APPROVED, NOT ACCEPTED 63 $218,707 36 $250,106 3 $317,667 APPLICATIONS DENIED 9 $210,333 10 $274,292 1 $206,000 APPLICATIONS WITHDRAWN 19 $210,626 13 $257,225 2 $93,000 FILES CLOSED FOR INCOMPLETENESS 2 $186,000 4 $295,750 0 $0
Aggregated Statistics For Year 2006(Based on 12 full tracts) A) Conventional B) Refinancings C) Non-occupant Loans on D) Loans On Manufactured Number Average Value Number Average Value Number Average Value Number Average Value
LOANS ORIGINATED 212 $211,180 101 $213,711 7 $177,710 0 $0 APPLICATIONS APPROVED, NOT ACCEPTED 23 $202,689 17 $206,116 2 $202,500 0 $0 APPLICATIONS DENIED 3 $264,320 2 $278,000 0 $0 1 $175,000 APPLICATIONS WITHDRAWN 9 $245,111 10 $237,297 0 $0 0 $0 FILES CLOSED FOR INCOMPLETENESS 1 $206,000 2 $212,000 0 $0 0 $0
Aggregated Statistics For Year 2005(Based on 12 full tracts) A) Conventional B) Refinancings C) Non-occupant Loans on Number Average Value Number Average Value Number Average Value
LOANS ORIGINATED 218 $214,046 113 $205,704 8 $179,618 APPLICATIONS APPROVED, NOT ACCEPTED 28 $240,314 29 $223,479 2 $215,480 APPLICATIONS DENIED 2 $166,500 1 $196,000 0 $0 APPLICATIONS WITHDRAWN 19 $217,997 12 $217,327 1 $144,000 FILES CLOSED FOR INCOMPLETENESS 0 $0 0 $0 0 $0
Aggregated Statistics For Year 2004(Based on 12 full tracts) A) Conventional B) Refinancings C) Non-occupant Loans on Number Average Value Number Average Value Number Average Value
LOANS ORIGINATED 387 $201,393 166 $193,473 27 $206,399 APPLICATIONS APPROVED, NOT ACCEPTED 75 $199,008 68 $192,702 11 $192,715 APPLICATIONS DENIED 14 $199,926 5 $216,800 2 $203,500 APPLICATIONS WITHDRAWN 21 $199,950 32 $206,152 16 $181,498 FILES CLOSED FOR INCOMPLETENESS 1 $198,000 20 $225,322 0 $0
Aggregated Statistics For Year 2003(Based on 12 full tracts) A) Conventional B) Refinancings C) Non-occupant Loans on Number Average Value Number Average Value Number Average Value
LOANS ORIGINATED 583 $191,122 465 $175,186 37 $164,888 APPLICATIONS APPROVED, NOT ACCEPTED 65 $180,321 171 $177,373 12 $155,417 APPLICATIONS DENIED 9 $198,889 10 $197,192 5 $174,600 APPLICATIONS WITHDRAWN 21 $213,331 39 $167,405 7 $263,709 FILES CLOSED FOR INCOMPLETENESS 5 $208,000 8 $152,496 2 $144,500
Aggregated Statistics For Year 2002(Based on 8 full tracts) A) Conventional B) Refinancings C) Non-occupant Loans on Number Average Value Number Average Value Number Average Value
LOANS ORIGINATED 320 $157,977 247 $156,736 40 $139,844 APPLICATIONS APPROVED, NOT ACCEPTED 32 $151,370 65 $147,994 2 $112,000 APPLICATIONS DENIED 6 $141,662 6 $132,318 3 $133,657 APPLICATIONS WITHDRAWN 13 $159,302 30 $164,059 2 $135,485 FILES CLOSED FOR INCOMPLETENESS 1 $81,000 0 $0 0 $0
Aggregated Statistics For Year 2001(Based on 8 full tracts) A) Conventional B) Refinancings C) Non-occupant Loans on Number Average Value Number Average Value Number Average Value
LOANS ORIGINATED 277 $145,733 246 $143,735 16 $134,246 APPLICATIONS APPROVED, NOT ACCEPTED 28 $131,780 46 $130,471 3 $98,000 APPLICATIONS DENIED 3 $165,667 7 $126,853 0 $0 APPLICATIONS WITHDRAWN 6 $133,497 14 $138,711 0 $0 FILES CLOSED FOR INCOMPLETENESS 2 $115,000 1 $102,000 0 $0
Aggregated Statistics For Year 2000(Based on 8 full tracts) A) Conventional B) Refinancings C) Non-occupant Loans on Number Average Value Number Average Value Number Average Value
LOANS ORIGINATED 239 $123,545 69 $119,737 10 $105,299 APPLICATIONS APPROVED, NOT ACCEPTED 22 $125,086 14 $114,991 5 $134,386 APPLICATIONS DENIED 10 $110,099 11 $128,634 1 $122,000 APPLICATIONS WITHDRAWN 6 $109,832 1 $97,000 1 $131,000 FILES CLOSED FOR INCOMPLETENESS 0 $0 0 $0 0 $0
Aggregated Statistics For Year 1999(Based on 10 full tracts) A) Conventional B) Refinancings C) Non-occupant Loans on Number Average Value Number Average Value Number Average Value
LOANS ORIGINATED 446 $127,187 222 $117,250 16 $93,213 APPLICATIONS APPROVED, NOT ACCEPTED 31 $143,858 35 $125,738 0 $0 APPLICATIONS DENIED 18 $124,292 5 $106,022 4 $106,428 APPLICATIONS WITHDRAWN 8 $120,179 9 $102,732 0 $0 FILES CLOSED FOR INCOMPLETENESS 2 $128,730 2 $89,885 0 $0
Brooklyn Park compared to Minnesota state average:
Unemployed percentage significantly below state average. Black race population percentage significantly above state average. Median age significantly below state average. Foreign-born population percentage significantly above state average. Brooklyn Park on our top lists :
#10 on the list of "Top 101 cities with the coldest winters (population 50,000+)"
#14 on the list of "Top 101 cities with the largest temperature differences during a year (population 50,000+)"
#15 on the list of "Top 101 cities with largest percentage of females in industries: administrative and support and waste management services (population 50,000+)"
#16 on the list of "Top 101 cities with the lowest average temperatures (population 50,000+)"
#19 on the list of "Top 101 cities with the lowest daily low temperatures (population 50,000+)"
#25 on the list of "Top 101 cities with the most residents born in Western Africa (population 500+)"
#32 on the list of "Top 101 cities with largest percentage of males in occupations: production occupations (population 50,000+)"
#32 on the list of "Top 101 cities with largest percentage of females in occupations: production occupations (population 50,000+)"
#34 on the list of "Top 101 cities with largest percentage of males in occupations: office and administrative support occupations (population 50,000+)"
#34 on the list of "Top 101 cities with the most residents born in Laos (population 500+)"
#38 on the list of "Top 101 cities with largest percentage of females in industries: utilities (population 50,000+)"
#42 on the list of "Top 101 cities with largest percentage of males in industries: administrative and support and waste management services (population 50,000+)"
#44 on the list of "Top 101 cities with the highest number of rapes per 100,000 residents, excludes tourist destinations and others with a lot of outsiders visiting based on city industries data (population 50,000+)"
#44 on the list of "Top 101 cities with the most residents born in Africa (population 500+)"
#56 on the list of "Top 101 cities with largest percentage of females in occupations: healthcare support occupations (population 50,000+)"
#57 on the list of "Top 101 cities with the largest city-data.com crime index increase from 2002 to 2012 (population 50,000+)"
#58 on the list of "Top 101 cities with largest percentage of males in industries: manufacturing (population 50,000+)"
#58 on the list of "Top 101 cities with the smallest household incomes disparities (population 50,000+)"
#62 on the list of "Top 100 cities with highest median household income and median resident age less than 35 (pop. 50,000+)"
#65 on the list of "Top 101 cities with largest percentage of females in occupations: construction and extraction occupations (population 50,000+)"
#52 (55443) on the list of "Top 101 zip codes with the largest percentage of Swedish first ancestries (pop 5,000+)"
#4 on the list of "Top 101 counties with the most Mainline Protestant adherents"
#7 on the list of "Top 101 counties with the highest percentage of residents that exercised in the past month"
#10 on the list of "Top 101 counties with the most Mainline Protestant congregations"
#15 on the list of "Top 101 counties with the highest percentage of residents that visited a dentist within the past year"
#28 on the list of "Top 101 counties with the best general health status score of residents (1-5), 3 years of data"
Top Patent Applicants
Jason P. Hill (43)
Steven J. Eickhoff (40)
Randy L. Morningstar (29)
James K. Carney (25)
Kyle P. Taylor (25)
Leonard B. Richardson (24)
William C. Phillips (23)
Steven Mcclurg (17)
Vladimir Grubac (15)
David W. Meyers (15)
Total of 1210 patent applications in 2008-2024.


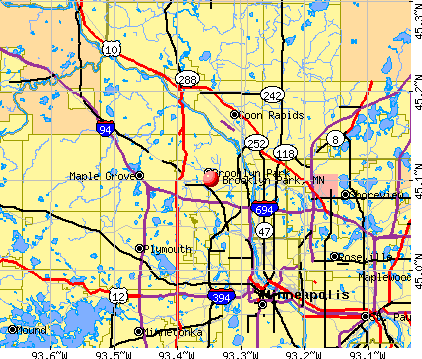


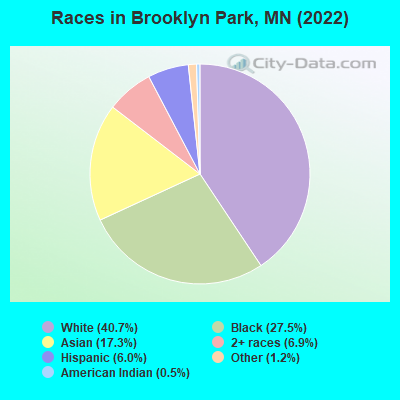
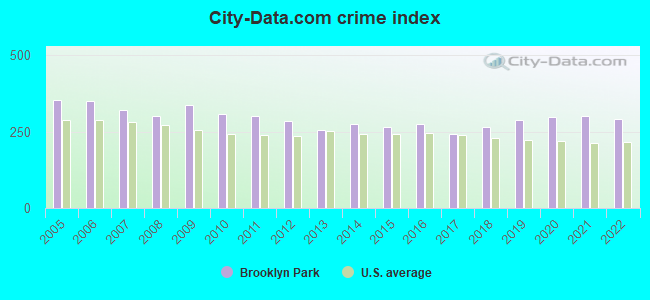
 Recent articles from our blog. Our writers, many of them Ph.D. graduates or candidates, create easy-to-read articles on a wide variety of topics.

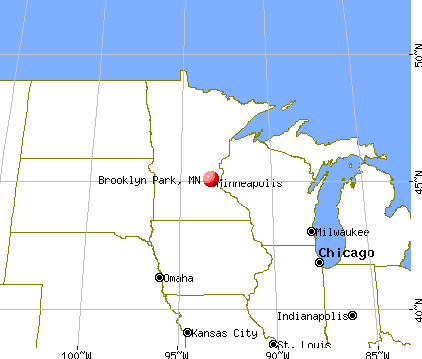
 (10.2 miles
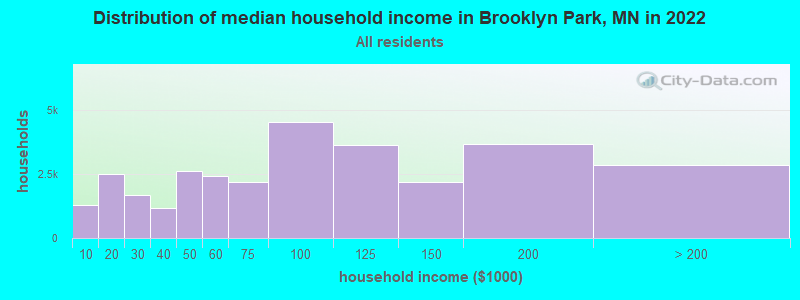
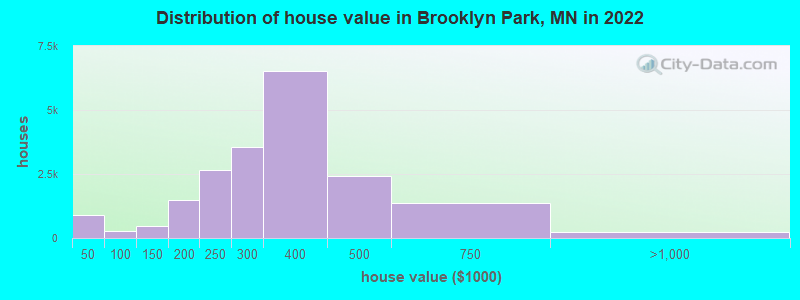
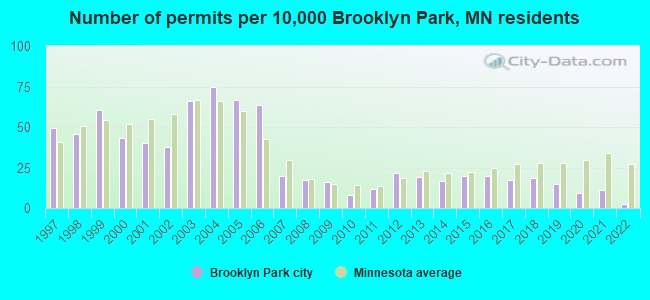
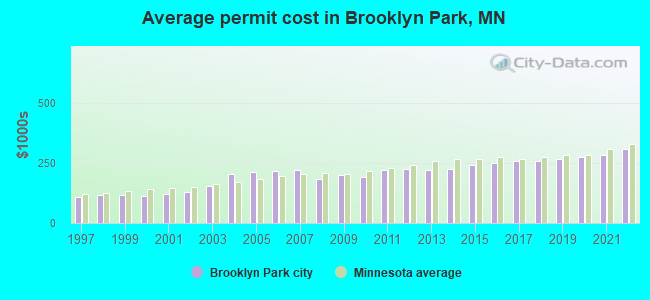
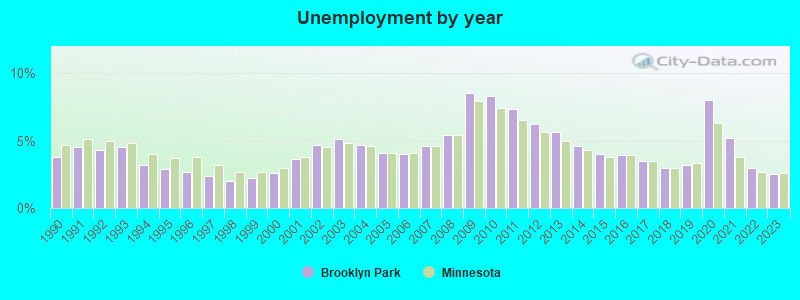
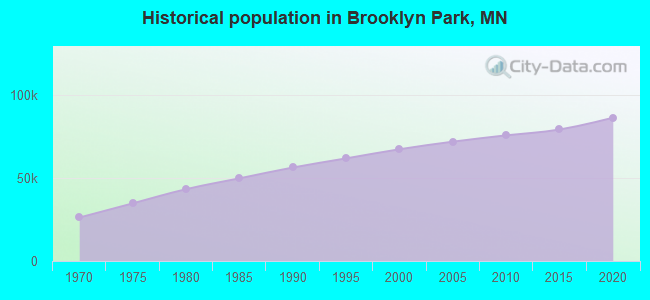
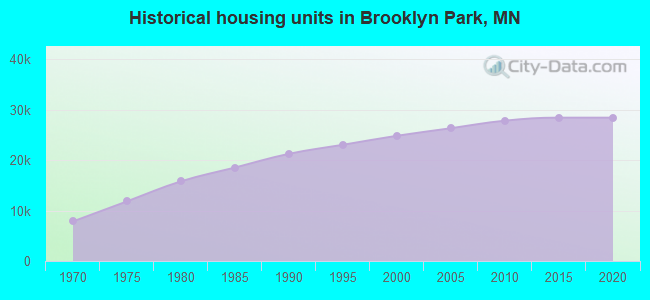
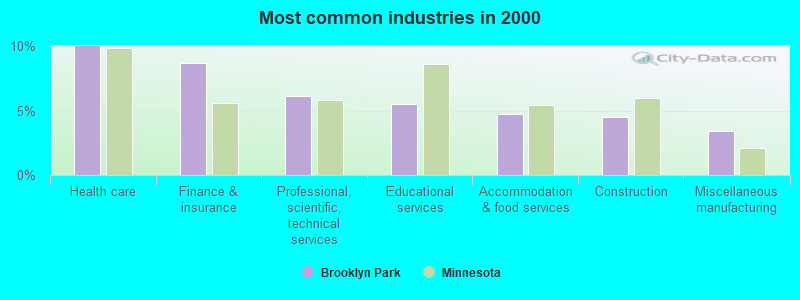
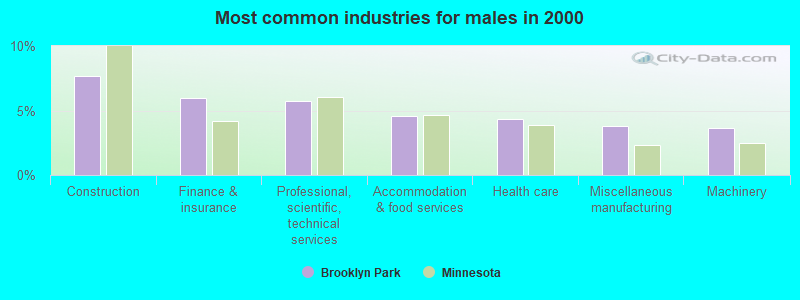
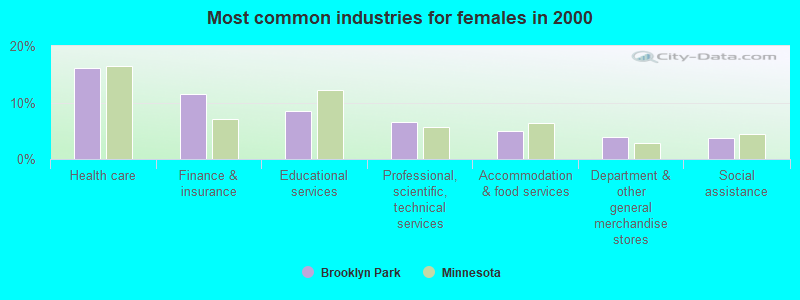
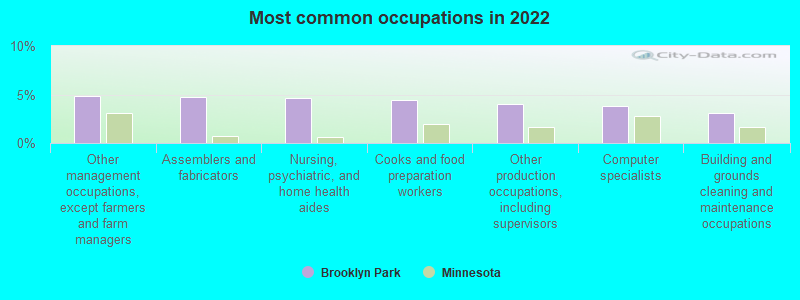
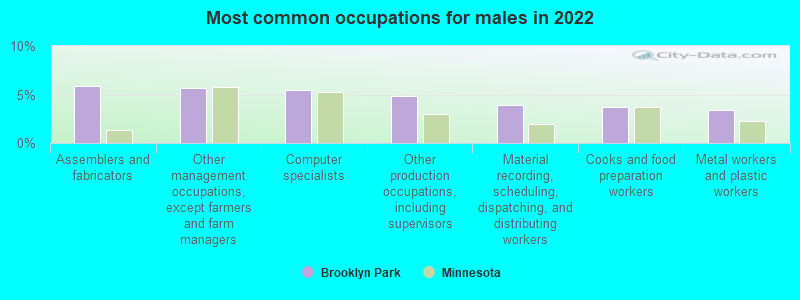
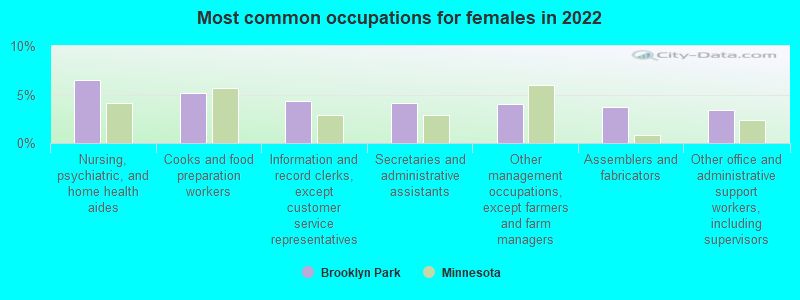
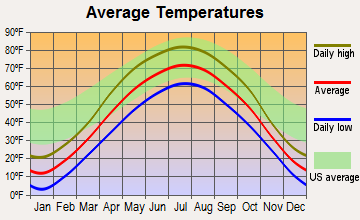
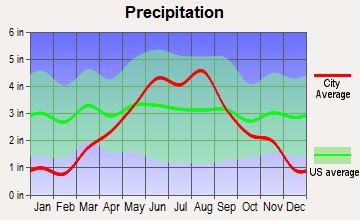
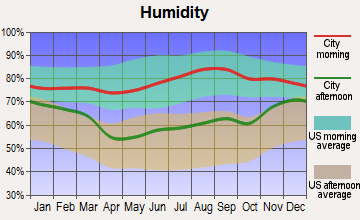
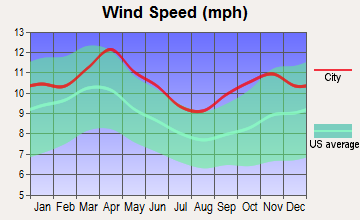
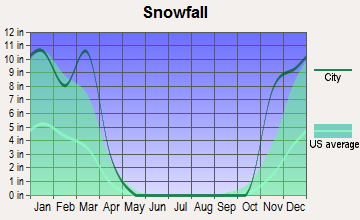
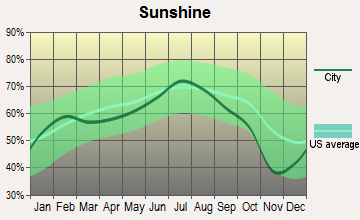
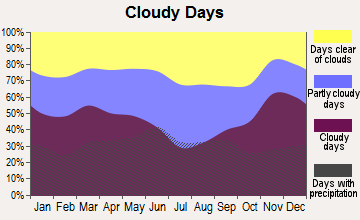
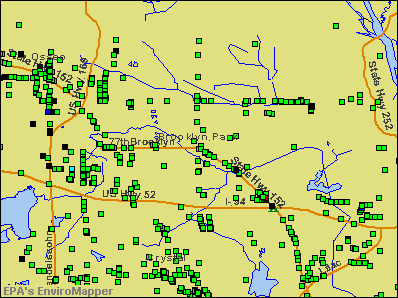

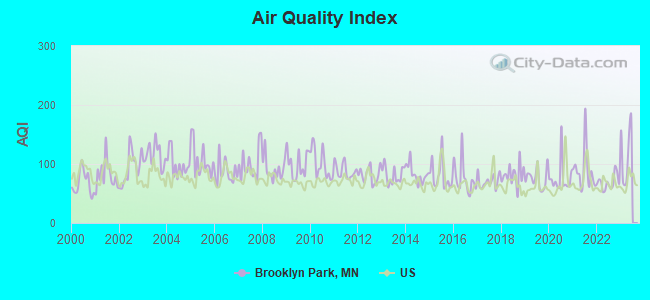
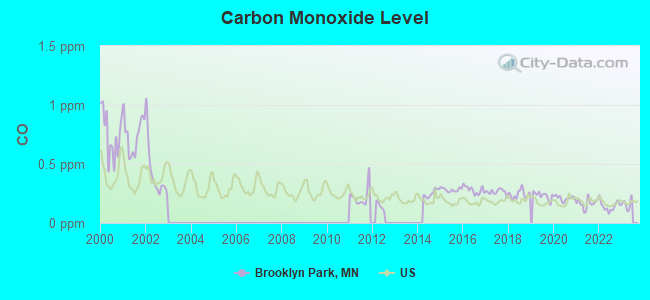
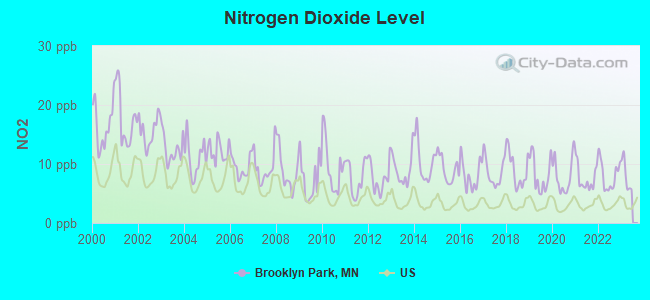
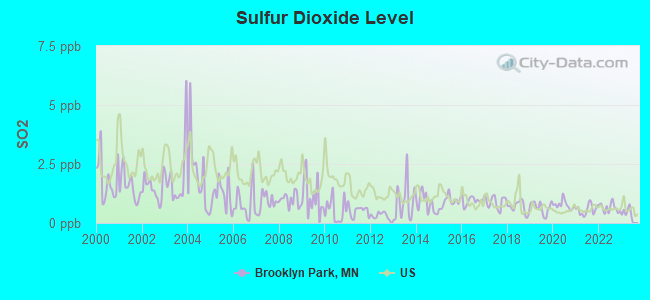

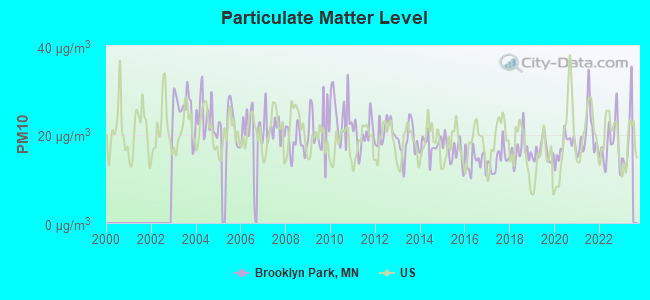
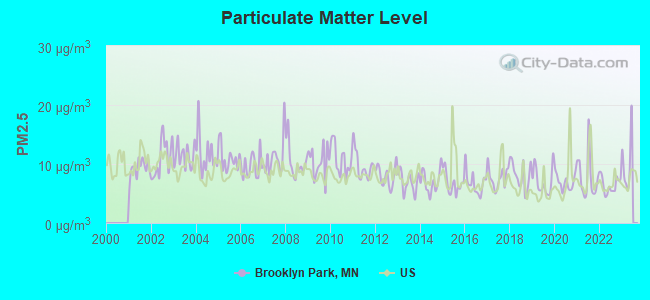
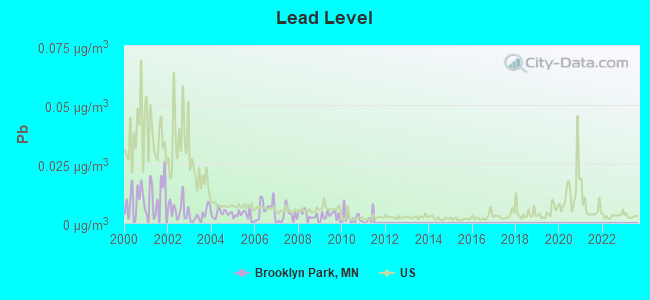
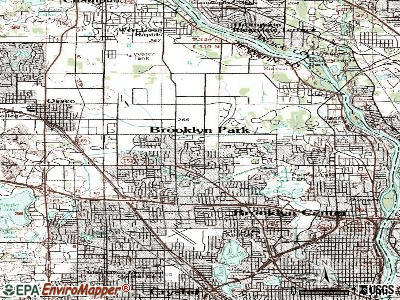
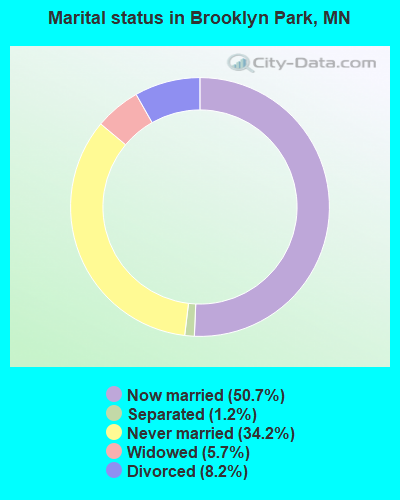
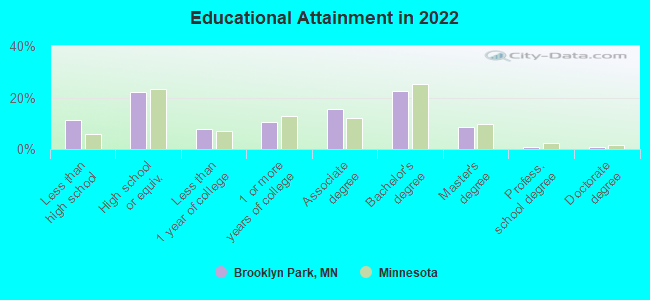
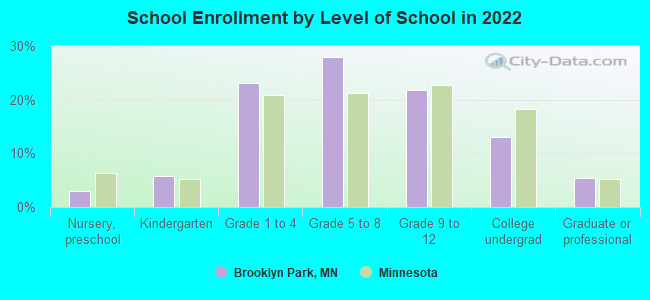
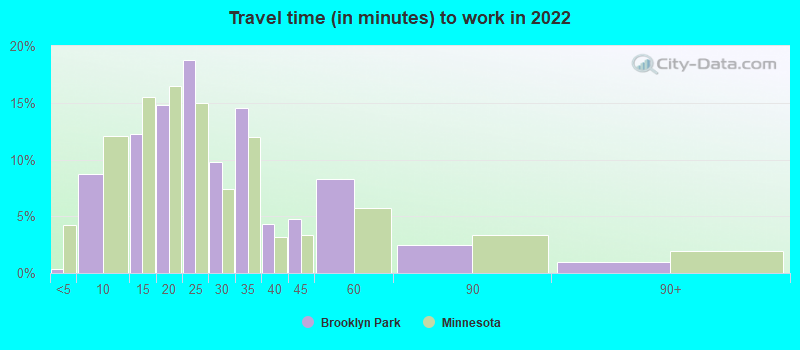
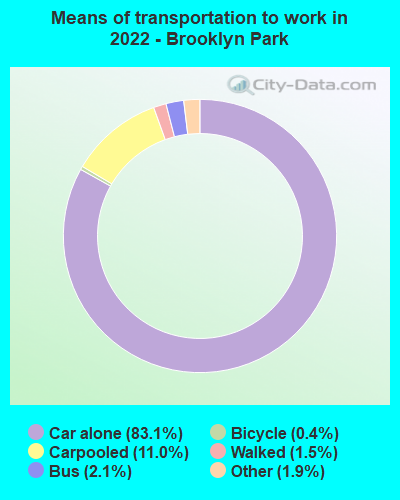
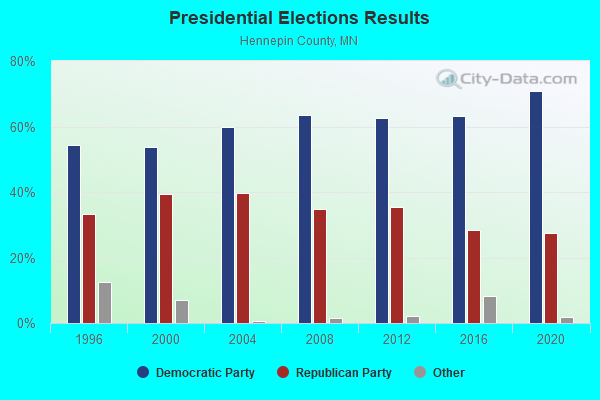
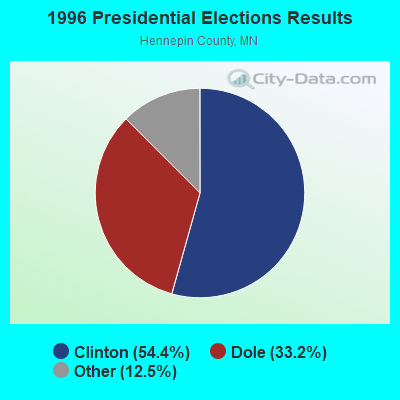
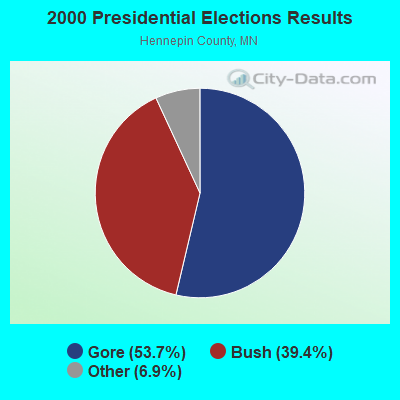
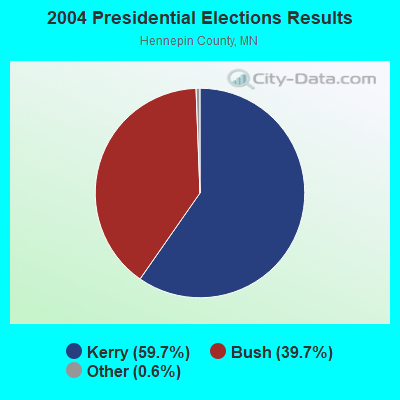
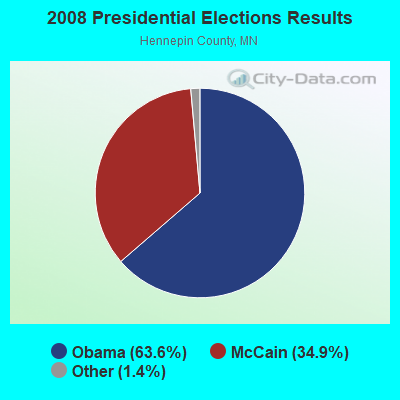
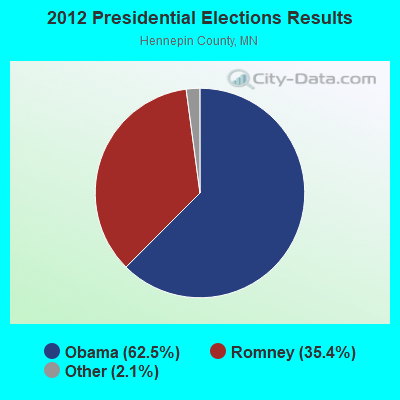
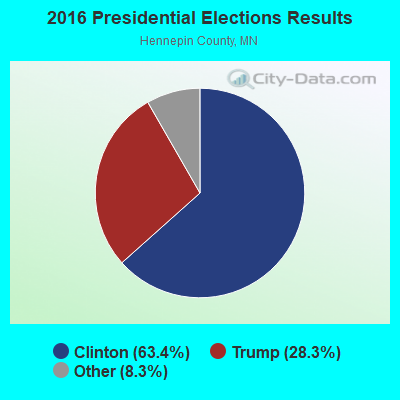
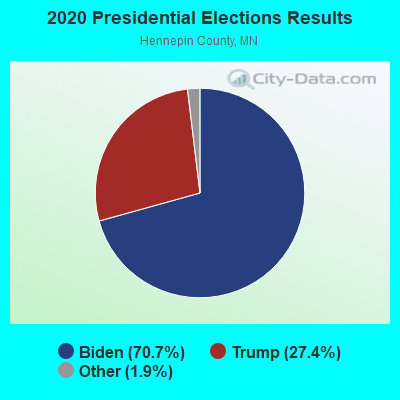
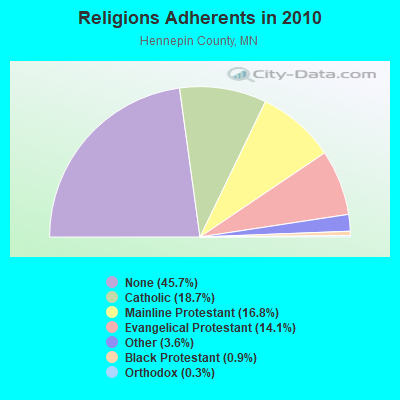
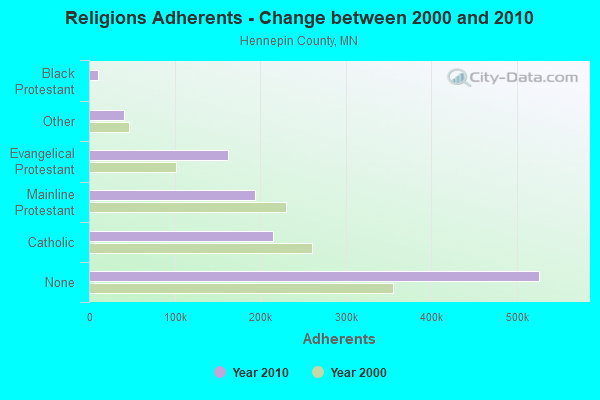
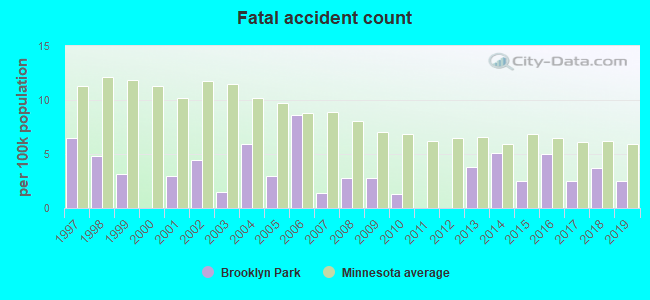
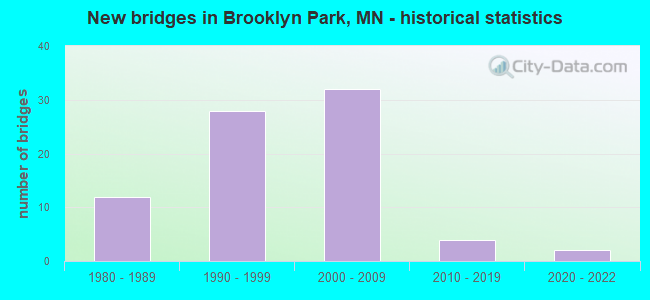
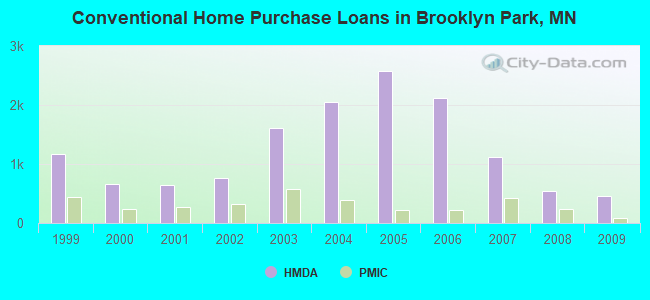
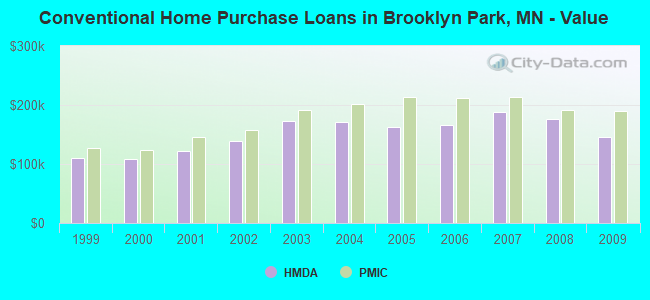
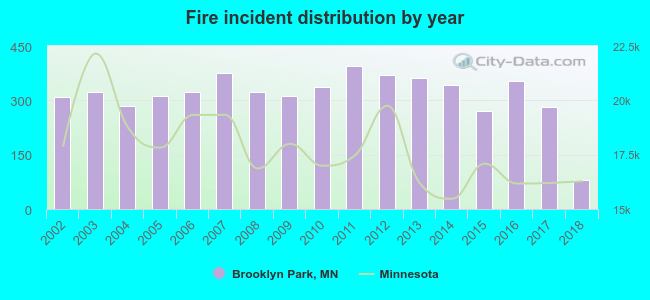 Based on the data from the years 2002 - 2018 the average number of fires per year is 315. The highest number of reported fires - 394 took place in 2011, and the least - 79 in 2018. The data has a dropping trend.
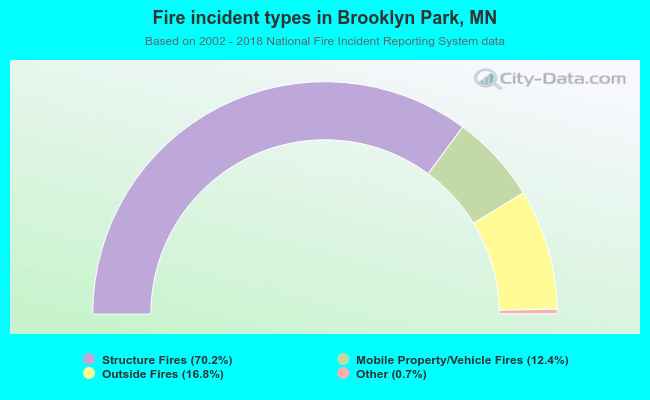 When looking into fire subcategories, the most incidents belonged to: Structure Fires (70.2%), and Outside Fires (16.8%).