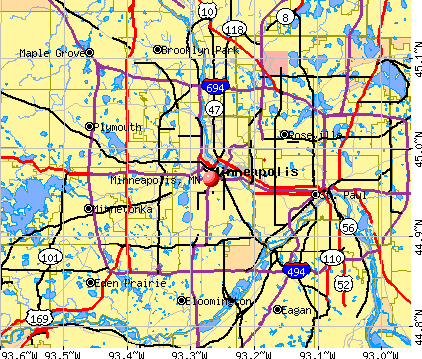
Minneapolis, Minnesota

Minneapolis: Minehaha falls2

Minneapolis: Paddleboad waiting for hire. Boom Island, Minneapolis, Mn

Minneapolis: Downtown Minneapolis from the Franklin Ave. bridge

Minneapolis: Downtown: Night view

Minneapolis: Autumn Walk Near the Mississippi River

Minneapolis: The skyline of Minneapolis from the U fo M

Minneapolis: traffic at night

Minneapolis: Minehaha falls

Minneapolis: Minneapolis from the Southwest with Lake Calhoun & Harriett

Minneapolis: minneapolis from above

Minneapolis: Downtown Minneapolis in Summer
- see
124
more - add
your
Submit your own pictures of this city and show them to the world
- OSM Map
- General Map
- Google Map
- MSN Map
Population change since 2000: +11.1%
 |
| Males: 216,264 | |
| Females: 208,832 |
| Median resident age: | 33.3 years |
| Minnesota median age: | 39.0 years |
Zip codes: 55401, 55402, 55403, 55404, 55405, 55406, 55407, 55408, 55409, 55412, 55413, 55414, 55415, 55417, 55418, 55419, 55450, 55454, 55455.
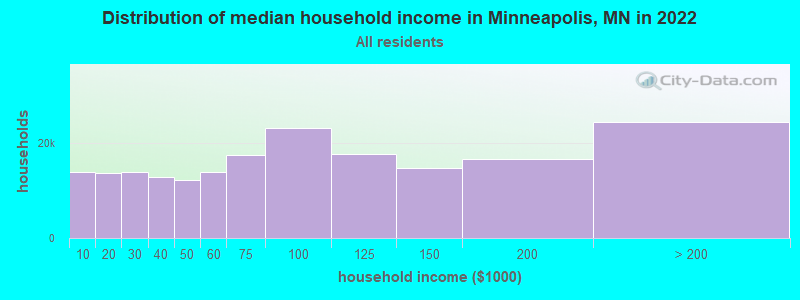
Minneapolis Zip Code Map| Minneapolis: | $74,473 |
| MN: | $82,338 |
Estimated per capita income in 2022: $49,617 (it was $22,685 in 2000)
Minneapolis city income, earnings, and wages data
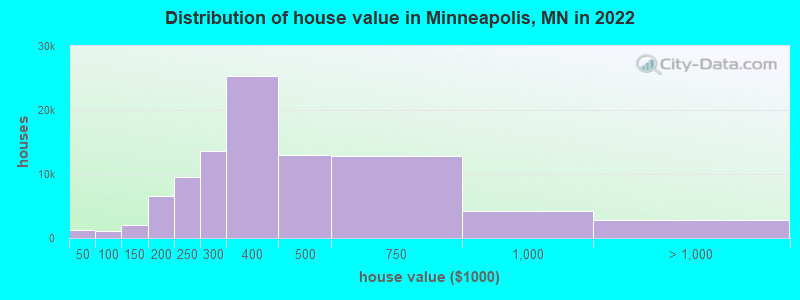
Estimated median house or condo value in 2022: $347,300 (it was $113,700 in 2000)
| Minneapolis: | $347,300 |
| MN: | $314,600 |
Mean prices in 2022: all housing units: $440,835; detached houses: $445,552; townhouses or other attached units: $435,272; in 2-unit structures: $420,759; in 3-to-4-unit structures: $431,923; in 5-or-more-unit structures: $417,671; mobile homes: $204,481
Median gross rent in 2022: $1,265.
(10.4% for White Non-Hispanic residents, 31.2% for Black residents, 24.4% for Hispanic or Latino residents, 41.0% for American Indian residents, 43.1% for Native Hawaiian and other Pacific Islander residents, 21.3% for other race residents, 17.2% for two or more races residents)
Detailed information about poverty and poor residents in Minneapolis, MN


- 249,11558.6%White alone
- 81,89719.3%Black alone
- 41,0809.7%Hispanic
- 25,6476.0%Two or more races
- 21,9155.2%Asian alone
- 2,8310.7%American Indian alone
- 2,4880.6%Other race alone
- 1310.03%Native Hawaiian and Other
Pacific Islander alone
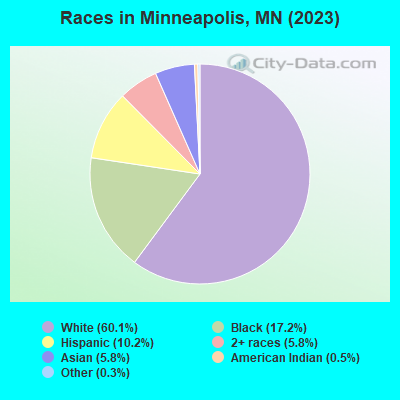
Races in Minneapolis detailed stats: ancestries, foreign born residents, place of birth
According to our research of Minnesota and other state lists, there were 184 registered sex offenders living in Minneapolis, Minnesota as of April 27, 2024.
The ratio of all residents to sex offenders in Minneapolis is 2,248 to 1.
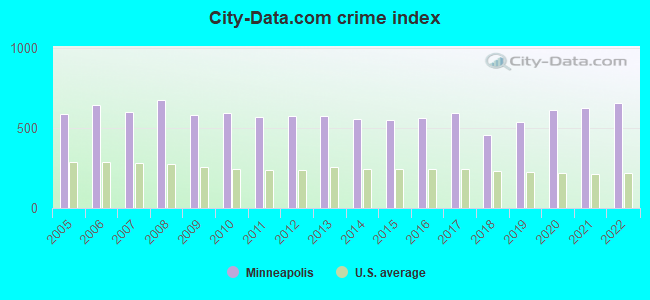
The City-Data.com crime index weighs serious crimes and violent crimes more heavily. Higher means more crime, U.S. average is 246.1. It adjusts for the number of visitors and daily workers commuting into cities.
- means the value is about the same as the state average.- means the value is bigger than the state average.
- means the value is much bigger than the state average.
Crime rate in Minneapolis detailed stats: murders, rapes, robberies, assaults, burglaries, thefts, arson
Full-time law enforcement employees in 2021, including police officers: 774 (648 officers - 546 male; 102 female).
| Officers per 1,000 residents here: | 1.48 |
| Minnesota average: | 1.76 |
 Recent articles from our blog. Our writers, many of them Ph.D. graduates or candidates, create easy-to-read articles on a wide variety of topics.


Latest news from Minneapolis, MN collected exclusively by city-data.com from local newspapers, TV, and radio stations
Ancestries: Somali (10.9%), German (9.8%), Norwegian (5.1%), Irish (3.8%), European (3.4%), American (2.7%).
Current Local Time: CST time zone
Incorporated on 03/01/1856
Elevation: 820 feet
Land area: 54.9 square miles.
Population density: 7,744 people per square mile (high).

63,948 residents are foreign born (5.9% Africa, 3.8% Latin America, 3.5% Asia).
| This city: | 15.1% |
| Minnesota: | 8.5% |
Median real estate property taxes paid for housing units with mortgages in 2022: $3,962 (1.1%)
Median real estate property taxes paid for housing units with no mortgage in 2022: $3,962 (1.2%)
Nearest city with pop. 1,000,000+: Chicago, IL  (354.2 miles , pop. 2,896,016).
Nearest cities:
), ), ), ), ), )Latitude: 44.96 N, Longitude: 93.27 W
Daytime population change due to commuting: +62,546 (+14.7%)
Workers who live and work in this city: 140,223 (58.0%)

Detailed articles:
- Minneapolis: Introduction
- Minneapolis Basic Facts
- Minneapolis: Communications
- Minneapolis: Convention Facilities
- Minneapolis: Economy
- Minneapolis: Education and Research
- Minneapolis: Geography and Climate
- Minneapolis: Health Care
- Minneapolis: History
- Minneapolis: Municipal Government
- Minneapolis: Population Profile
- Minneapolis: Recreation
- Minneapolis: Transportation
Minneapolis tourist attractions:
- Aloft Minneapolis offers guests a place to stay, dine, re-fuel and be connected
- American Airlines C.R. Smith Museum is a window seat look at the world of flight
- American Swedish Institute exhibits the life of Swedish in America
- Bakken Library and Museum is the only museum dedicated to medical electricity
- Basilica of St. Mary was the first Basilica built in America
- Bell Museum of Natural History is located on the University of Minnesota campus
- Bryant-Lake Bowl is the place to dine, bowl and party in Minneapolis
- Calhoun Square offers shopping and dining in the heart of uptown Minneapolis
- Crowne Plaza Downtown offers the comforts of home
- Doubletree Guest Suites Minneapolis has a boutique charm in the shopping and theater district
- Eloise Butler Wildflower Garden is the oldest public garden in the United States
- Foshay Tower was the first skyscraper in Minneapolis
- Frederick R. Weisman Art Museum features a diverse selection of contemporary art
- Grand Hotel Minneapolis is a classic spa hotel
- Graves 601 Minneapolis is a high end hotel
- Guthrie Theater is a center for performances, production, education and training
- Hilton Minneapolis is a hotel to suit any taste and budget in downtown Minneapolis
- Hotel Ivy is a historic landmark hotel
- Hyatt Regency Minneapolis is a convention center hotel
- IDS Building is the tallest building in Minnesota
- Lake Harriet Band Shell is located in the Lake Harriet city park and hosts over 200 free performances per year
- Lake Harriet Rose Garden is located in Lyndale Park
- Lake Harriet is a picturesque lake that is part of the Chain of Lakes
- Lake of the Isles is part of the Chain of Lakes Regional Park
- Loring Park is the largest park in central Minneapolis
- Lyndale Park Rose Garden is a 1.5 acre garden with over 3,000 plants on show
- Marriott Minneapolis City Center is a sophisticated hotel with a contemporary design
- Mercado Central is a member-owned cooperative
- Metrodome in Minneapolis, Minnesota
- Midtown Global Market is an internationally themed market selling fresh food, arts and crafts along with restaurants
- Mill City Farmers Market is the place for fresh fruit, produce and to enjoy a coffee and light meal
- Mill City Museum is built into the ruins of what was the largest flour mill of its time
- Millennium Hotel Minneapolis is close to dining, entertainment and shopping
- Minneapolis Convention Center is located in a convenient location for guests to host meetings or events
- Minneapolis Farmers Market are held each Saturday and are a tradition for visitors
- Minneapolis Institute of Arts, Minneapolis, MN
- Minneapolis Planetarium is on a mission to make contact with the stars
- Minneapolis Sculpture Garden is a sculpture garden and an icon on Minnesota
- Minnehaha Park is one of the oldest parks in Minneapolis
- Minnesota Orchestra is one of the United States' top symphonic ensembles
- Nicollet Avenue is a pedestrian transit mall
- Orpheum Theatre is located in downtown Minneapolis
- Radisson Plaza Hotel Minneapolis offers warm hospitality and stylish guest rooms
- Radisson University Hotel is located on the University of Minnesota Campus
- Riverview Theater is a 1950's style theater
- Sheraton Bloomington Hotel Minneapolis South is close to the airport and Mall of America
- St. Anthony Falls was the only natural waterfall on the Upper Mississippi River
- Stone Arch Bridge is known for graceful arches and views
- Target Center, Minneapolis, Minnesota
- The Depot Minneapolis is a Renaissance Hotel in Minneapolis
- The Depot Skating Rink is located in the historic train shed, The Depot
- The Hotel Minneapolis - a Doubletree Hotel is a mix of business savvy and leisure
- The Marquette offers accommodation for business or pleasure travelers
- The Westin Minneapolis, Minneapolis is located on the historic site of Farmers & Mechanics Bank Building
- Uptown neighborhood is a commercial and residential community
- W Minneapolis - The Foshay is a hotel located in the historic skyscraper building
- Walker Art Center allows creative expression by the community
- Warehouse District is the place to visit for a bite to eat, enjoy live music or shop
- Water Park at the Depot is located within the historic railway station, The Depot
- Wells Fargo Tower is a landmark redefining the Minneapolis Skyline
Minneapolis, Minnesota accommodation & food services, waste management - Economy and Business Data
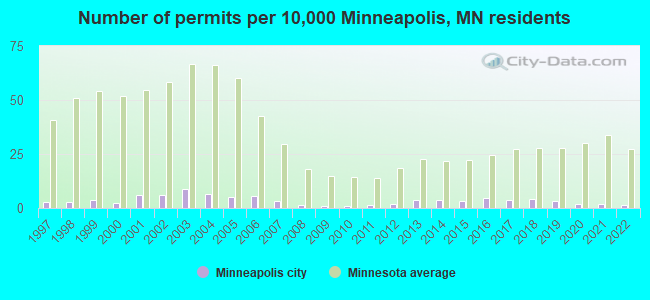
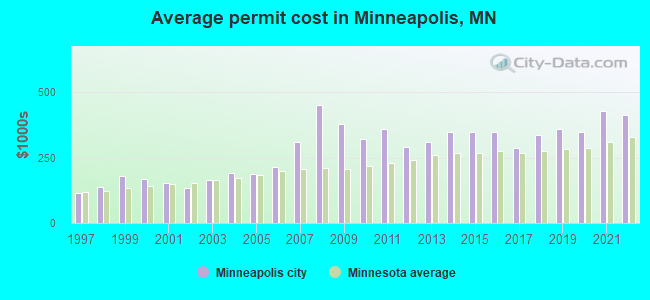
Single-family new house construction building permits:
- 2022: 55 buildings, average cost: $412,300
- 2021: 63 buildings, average cost: $427,300
- 2020: 79 buildings, average cost: $348,100
- 2019: 122 buildings, average cost: $361,100
- 2018: 162 buildings, average cost: $336,000
- 2017: 137 buildings, average cost: $285,600
- 2016: 169 buildings, average cost: $348,900
- 2015: 122 buildings, average cost: $347,400
- 2014: 138 buildings, average cost: $347,600
- 2013: 146 buildings, average cost: $308,500
- 2012: 76 buildings, average cost: $290,000
- 2011: 49 buildings, average cost: $359,900
- 2010: 41 buildings, average cost: $322,100
- 2009: 28 buildings, average cost: $379,000
- 2008: 45 buildings, average cost: $451,300
- 2007: 115 buildings, average cost: $309,700
- 2006: 218 buildings, average cost: $212,500
- 2005: 198 buildings, average cost: $189,300
- 2004: 250 buildings, average cost: $189,900
- 2003: 331 buildings, average cost: $166,200
- 2002: 237 buildings, average cost: $134,100
- 2001: 226 buildings, average cost: $153,200
- 2000: 95 buildings, average cost: $168,100
- 1999: 144 buildings, average cost: $178,400
- 1998: 110 buildings, average cost: $139,400
- 1997: 109 buildings, average cost: $116,400
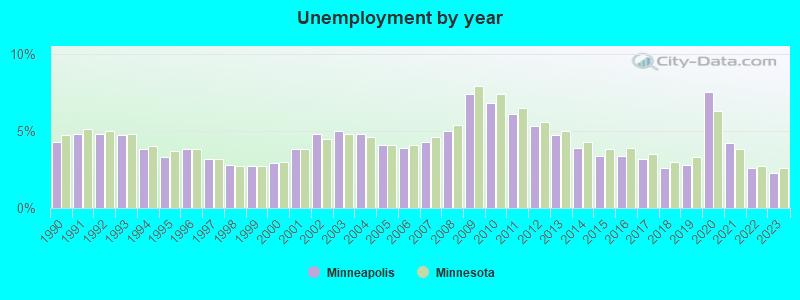
| Here: | 2.3% |
| Minnesota: | 2.6% |
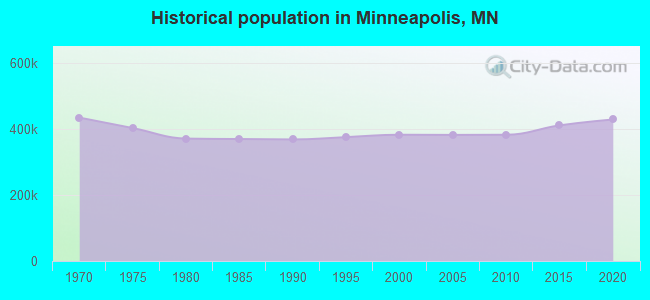
Population change in the 1990s: +13,814 (+3.7%).
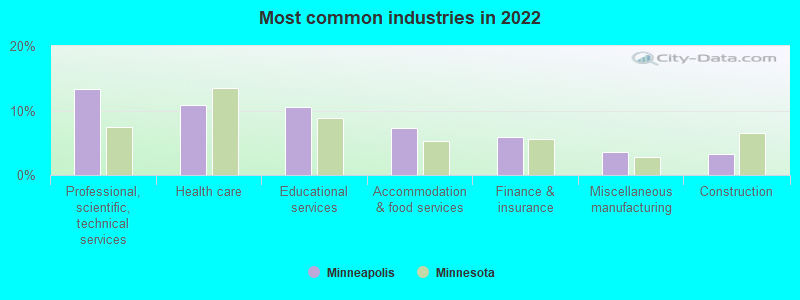
- Professional, scientific, technical services (13.4%)
- Health care (10.9%)
- Educational services (10.5%)
- Accommodation & food services (7.2%)
- Finance & insurance (5.9%)
- Miscellaneous manufacturing (3.5%)
- Construction (3.2%)
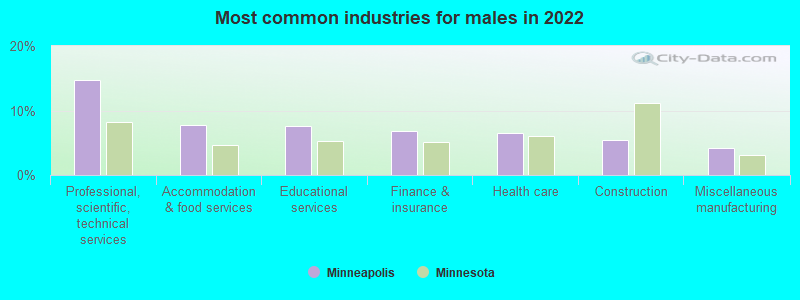
- Professional, scientific, technical services (14.7%)
- Accommodation & food services (7.7%)
- Educational services (7.6%)
- Finance & insurance (6.9%)
- Health care (6.5%)
- Construction (5.5%)
- Miscellaneous manufacturing (4.2%)
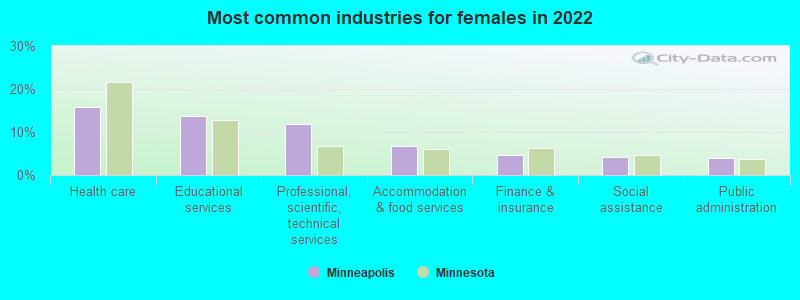
- Health care (15.7%)
- Educational services (13.8%)
- Professional, scientific, technical services (12.0%)
- Accommodation & food services (6.7%)
- Finance & insurance (4.7%)
- Social assistance (4.2%)
- Public administration (3.9%)

- Other management occupations, except farmers and farm managers (7.0%)
- Cooks and food preparation workers (5.8%)
- Computer specialists (4.9%)
- Laborers and material movers, hand (2.7%)
- Engineers (2.3%)
- Nursing, psychiatric, and home health aides (2.1%)
- Retail sales workers, except cashiers (2.1%)

- Computer specialists (8.0%)
- Other management occupations, except farmers and farm managers (6.1%)
- Cooks and food preparation workers (5.9%)
- Engineers (3.6%)
- Laborers and material movers, hand (3.5%)
- Retail sales workers, except cashiers (2.5%)
- Driver/sales workers and truck drivers (2.3%)

- Other management occupations, except farmers and farm managers (8.0%)
- Cooks and food preparation workers (5.6%)
- Registered nurses (3.3%)
- Other office and administrative support workers, including supervisors (3.0%)
- Counselors, social workers, and other community and social service specialists (2.8%)
- Nursing, psychiatric, and home health aides (2.7%)
- Other financial specialists (2.6%)
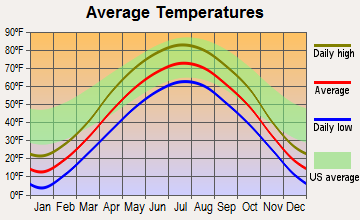
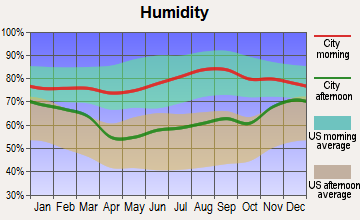
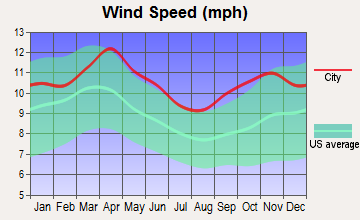
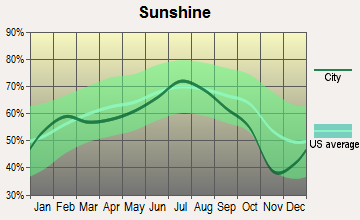
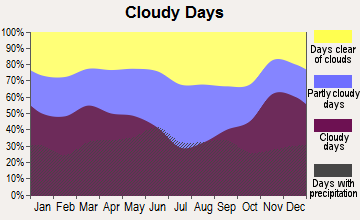
Average climate in Minneapolis, Minnesota
Based on data reported by over 4,000 weather stations


|
|

(lower is better)
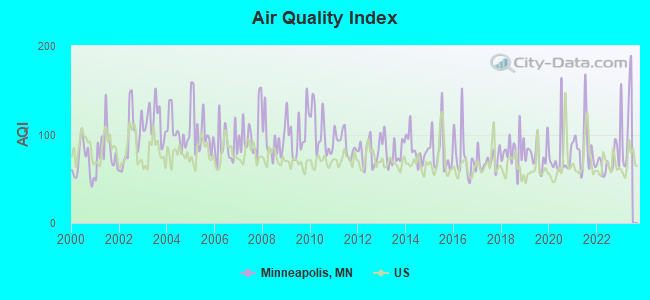
Air Quality Index (AQI) level in 2022 was 68.4. This is about average.
| City: | 68.4 |
| U.S.: | 72.6 |
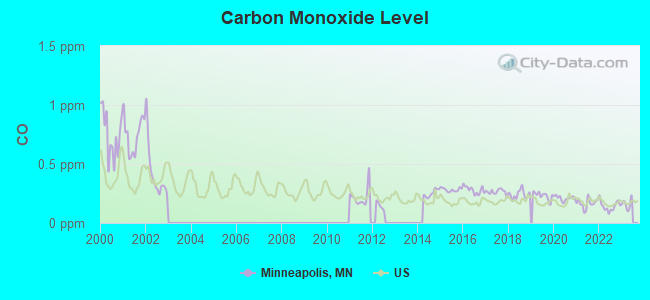
Carbon Monoxide (CO) [ppm] level in 2022 was 0.144. This is significantly better than average. Closest monitor was 0.0 miles away from the city center.
| City: | 0.144 |
| U.S.: | 0.251 |
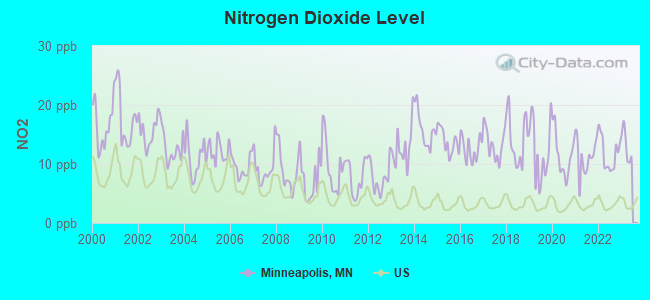
Nitrogen Dioxide (NO2) [ppb] level in 2022 was 11.7. This is significantly worse than average. Closest monitor was 0.7 miles away from the city center.
| City: | 11.7 |
| U.S.: | 5.1 |
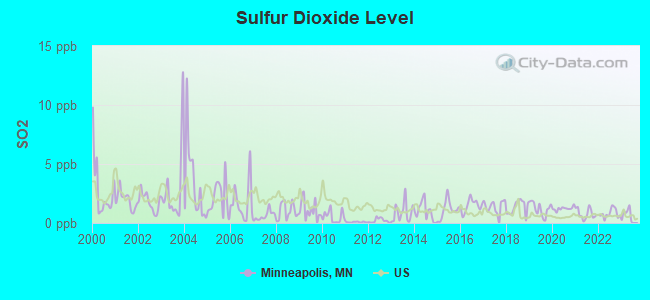
Sulfur Dioxide (SO2) [ppb] level in 2022 was 0.804. This is significantly better than average. Closest monitor was 0.0 miles away from the city center.
| City: | 0.804 |
| U.S.: | 1.515 |
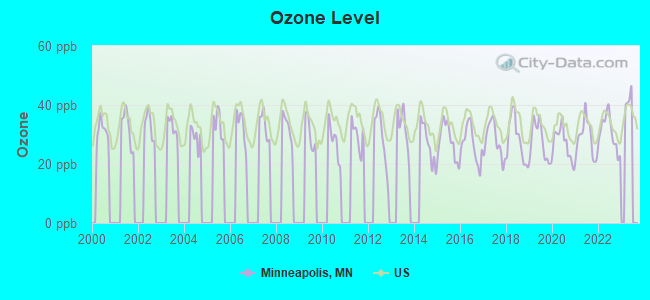
Ozone [ppb] level in 2022 was 30.7. This is about average. Closest monitor was 1.0 miles away from the city center.
| City: | 30.7 |
| U.S.: | 33.3 |
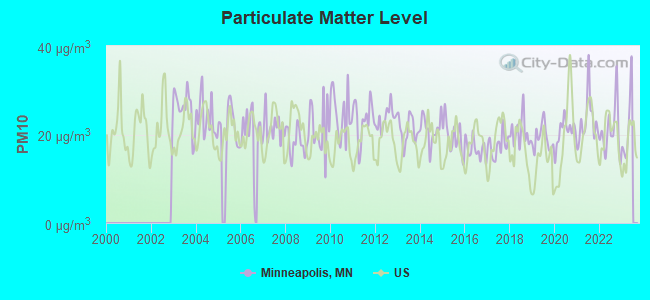
Particulate Matter (PM10) [µg/m3] level in 2022 was 20.8. This is about average. Closest monitor was 0.7 miles away from the city center.
| City: | 20.8 |
| U.S.: | 19.2 |
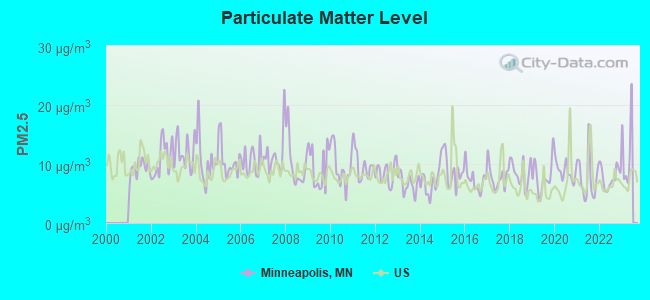
Particulate Matter (PM2.5) [µg/m3] level in 2022 was 7.75. This is about average. Closest monitor was 0.7 miles away from the city center.
| City: | 7.75 |
| U.S.: | 8.11 |
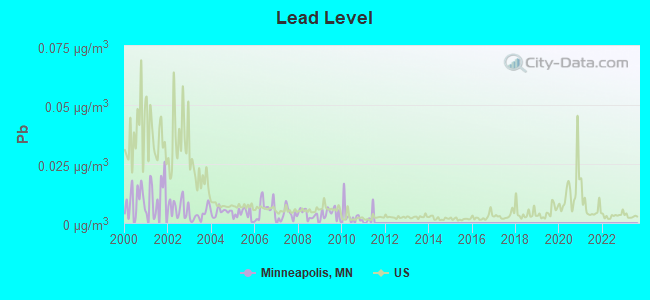
Lead (Pb) [µg/m3] level in 2010 was 0.00287. This is significantly better than average. Closest monitor was 0.4 miles away from the city center.
| City: | 0.00287 |
| U.S.: | 0.00931 |
Tornado activity:
Minneapolis-area historical tornado activity is slightly above Minnesota state average. It is 30% greater than the overall U.S. average.
On 5/6/1965, a category F4 (max. wind speeds 207-260 mph) tornado 4.6 miles away from the Minneapolis city center killed 3 people and injured 175 people and caused between $5,000,000 and $50,000,000 in damages.
On 5/6/1965, a category F4 tornado 5.6 miles away from the city center killed 6 people and injured 158 people and caused between $5,000,000 and $50,000,000 in damages.
Earthquake activity:
Minneapolis-area historical earthquake activity is significantly above Minnesota state average. It is 56% smaller than the overall U.S. average.On 7/9/1975 at 14:54:15, a magnitude 4.6 (4.6 MB, Class: Light, Intensity: IV - V) earthquake occurred 143.4 miles away from Minneapolis center
On 6/5/1993 at 01:24:53, a magnitude 4.1 (4.1 LG, Depth: 6.2 mi) earthquake occurred 155.1 miles away from Minneapolis center
On 3/4/1983 at 06:32:18, a magnitude 4.6 (4.4 MB, 4.6 LG, 4.4 ML) earthquake occurred 306.8 miles away from the city center
On 10/20/1995 at 15:57:18, a magnitude 3.7 (3.7 LG, Depth: 3.1 mi, Class: Light, Intensity: II - III) earthquake occurred 183.7 miles away from Minneapolis center
On 2/9/1994 at 08:45:35, a magnitude 3.1 (3.1 LG, Depth: 3.1 mi) earthquake occurred 84.8 miles away from the city center
On 11/3/2002 at 20:41:56, a magnitude 4.3 (4.3 MB, Depth: 3.1 mi) earthquake occurred 319.0 miles away from the city center
Magnitude types: regional Lg-wave magnitude (LG), body-wave magnitude (MB), local magnitude (ML)
Natural disasters:
The number of natural disasters in Hennepin County (17) is near the US average (15).Major Disasters (Presidential) Declared: 12
Emergencies Declared: 4
Causes of natural disasters: Floods: 11, Storms: 8, Tornadoes: 4, Winds: 3, Drought: 1, Hurricane: 1, Landslide: 1, Mudslide: 1, Other: 2 (Note: some incidents may be assigned to more than one category).

Main business address for: JOSTENS INC (JEWELRY, PRECIOUS METAL), ENTRX CORP (CONSTRUCTION SPECIAL TRADE CONTRACTORS), BEMIS CO INC (CONVERTED PAPER & PAPERBOARD PRODS (NO CONTAINERS/BOXES)), RESIDENTIAL ACCREDIT LOANS INC (ASSET-BACKED SECURITIES), PHOTO CONTROL CORP (PHOTOGRAPHIC EQUIPMENT & SUPPLIES), APOGEE ENTERPRISES INC (GLASS PRODUCTS, MADE OF PURCHASED GLASS), MONEYGRAM INTERNATIONAL INC (SERVICES-BUSINESS SERVICES, NEC), ANALYSTS INTERNATIONAL CORP (SERVICES-COMPUTER PROGRAMMING SERVICES) and 51 other public companies.
Hospitals in Minneapolis:
- ABBOTT NORTHWESTERN HOSPITAL (Voluntary non-profit - Private, provides emergency services, 800 EAST 28TH STREET)
- CHILDREN'S HOSPITALS & CLINICS OF MN (Voluntary non-profit - Private, provides emergency services, 2525 CHICAGO AVENUE SOUTH)
- HEALTHPARTNERS HOSPICE OF THE LAKES (8100 34TH AVE S)
- MARIA HOME (2809 31ST AVENUE SOUTH)
- METROPOLITAN MT SINAI MEDICAL CENTER (2215 PARK AVE S)
- NORTHEAST HOUSE INC (1918 NORTHEAST 19TH AVENUE)
- PEOPLE II (1380 WEST MINNEHAHA PARKWAY)
- PHILLIPS EYE INSTITUTE (Government - Federal, 2215 PARK AVENUE SOUTH)
- ST MARYS HOSPITAL (2414 SOUTH SEVENTH STREET)
- UNIVERSITY OF MINNESOTA MEDICAL CENTER, FAIRVIEW (Voluntary non-profit - Private, provides emergency services, 2450 RIVERSIDE AVENUE)
- UNIVERSITY OF MINNESOTA HOSP AND CLINIC (420 DELAWARE STREET SOUTHEAST)
Airports, heliports and other landing facilities located in Minneapolis:
- Minneapolis-St Paul International/Wold-Chamberlain Airport (MSP) (Runways: 4, Commercial Ops: 375,153, Air Taxi Ops: 12,199, Itinerant Ops: 24,155, Military Ops: 1,079)
- Flying Cloud Airport (FCM) (Runways: 3, Air Taxi Ops: 3,002, Itinerant Ops: 44,878, Local Ops: 27,509, Military Ops: 453)
- Anoka County-Blaine Airport(Janes Field) (ANE) (Runways: 2, Air Taxi Ops: 4,606, Itinerant Ops: 36,189, Local Ops: 28,751, Military Ops: 656)
- Crystal Airport (MIC) (Runways: 4, Air Taxi Ops: 549, Itinerant Ops: 22,458, Local Ops: 19,250, Military Ops: 94)
- Airlake Airport (LVN) (Runways: 1, Air Taxi Ops: 1,480, Itinerant Ops: 18,779, Local Ops: 13,697, Military Ops: 218)
- Abbott Northwestern Hospital Heliport (MN10)
- Children's Hospital - Minneapolis Heliport (25MY)
- Fairview Riverside Medical Center Heliport (9MN4)
- University Of Mn Hospitals & Clinics Heliport (MY65)
- Peterson Seaplane Base (31MN)
Amtrak station near Minneapolis:
Colleges/Universities in Minneapolis:
- Walden University (Full-time enrollment: 62,473; Location: 100 Washington Avenue South, Suite 900; Private, for-profit; Website: www.waldenu.edu; Offers Doctor's degree)
- University of Minnesota-Twin Cities (Full-time enrollment: 43,506; Location: 100 Church Street SE; Public; Website: www1.umn.edu/twincities/index.php; Offers Doctor's degree)
- Capella University (Full-time enrollment: 21,718; Location: 225 South 6th Street, 9th Floor; Private, for-profit; Website: www.capella.edu; Offers Doctor's degree)
- Minneapolis Community and Technical College (Full-time enrollment: 6,726; Location: 1501 Hennepin Ave; Public; Website: www.minneapolis.edu)
- Augsburg College (Full-time enrollment: 2,954; Location: 2211 Riverside Ave; Private, not-for-profit; Website: www.augsburg.edu; Offers Doctor's degree)
- The Art Institutes International-Minnesota (Full-time enrollment: 1,385; Location: 15 S 9th Street, LaSalle Building; Private, for-profit; Website: www.aim.artinstitutes.edu)
- North Central University (Full-time enrollment: 1,281; Location: 910 Elliot Ave; Private, not-for-profit; Website: www.northcentral.edu)
- Dunwoody College of Technology (Full-time enrollment: 995; Location: 818 Dunwoody Blvd; Private, not-for-profit; Website: www.dunwoody.edu)
- Minneapolis College of Art and Design (Full-time enrollment: 728; Location: 2501 Stevens Ave; Private, not-for-profit; Website: WWW.MCAD.EDU; Offers Master's degree)
- Aveda Institute-Minneapolis (Full-time enrollment: 637; Location: 400 Central Ave SE; Private, for-profit; Website: aveda.edu/)
- Herzing University-Minneapolis (Full-time enrollment: 412; Location: 5700 W Broadway; Private, for-profit; Website: www.herzing.edu)
- Summit Academy Opportunities Industrialization Center (Full-time enrollment: 330; Location: 935 Olson Memorial Hwy; Private, not-for-profit; Website: WWW.SAOIC.ORG)
- Institute of Production and Recording (Full-time enrollment: 285; Location: 300 North 1st Ave, Suite 500; Private, for-profit; Website: www.ipr.edu)
- Globe University-Minneapolis (Full-time enrollment: 216; Location: IDS Center, 80 South 8th Street, Suite 51; Private, for-profit; Website: www.globeuniversity.edu/; Offers Doctor's degree)
- American Indian OIC Inc (Full-time enrollment: 178; Location: 1845 E. Franklin Ave; Private, not-for-profit; Website: www.aioic.org)
- Academy College (Full-time enrollment: 124; Location: 1101 E. 78th Street, Suite 100; Private, for-profit; Website: www.academycollege.edu)
- Miami Ad School-Minneapolis (Full-time enrollment: 28; Location: 25 North 4th Street , Suite 201; Private, for-profit; Website: www.miamiadschool.com)
Biggest public high schools in Minneapolis:
- MTS HIGH SCHOOL (Location: 2872 26TH AVENUE S., Grades: 9-12, Charter school)
- MTS PEASE ACADEMY (Location: 601 13TH AVE SE, Grades: 9-12, Charter school)
- FAIR SCHOOL DOWNTOWN (Location: 10 S 10TH ST, Grades: 9-12)
- EL COLEGIO CHARTER SCHOOL (Location: 4137 BLOOMINGTON AVE, Grades: 9-12, Charter school)
- METRO SCHOOLS CHARTER (Location: 2600 26TH AVE S, Grades: 9-12, Charter school)
- LEARNING FOR LEADERSHIP CHARTER (Location: 3300 5TH ST NE, Grades: KG-12, Charter school)
- LINCOLN INTERNATIONAL SCHOOL (Location: 2520 MINNEHAHA AVE, Grades: 9-12, Charter school)
- MINNEAPOLIS COLLEGE PREPARATORY (Location: 2131 12TH AVE N, Grades: 9-12, Charter school)
- DOWNTOWN CAMPUS (Location: 511 GROVELAND AVE, Grades: 9-12, Charter school)
- SABATHANI CAMPUS (Location: 310 38TH STREET E STE 101, Grades: 9-12, Charter school)
Private high schools in Minneapolis:
- BRECK SCHOOL (Students: 1,143, Location: 123 OTTAWA AVE N, Grades: PK-12)
- MINNEHAHA ACADEMY (Students: 965, Location: 3100 W RIVER PKWY, Grades: PK-12)
- HOPE ACADEMY (Students: 335, Location: 2300 CHICAGO AVE, Grades: KG-12)
- CRISTO REY JESUIT HIGH SCHOOL TWIN CITIES (Students: 280, Location: 2924 4TH AVE S, Grades: 9-12)
- SECOND FOUNDATION SCHOOL (Students: 45, Location: 1219 UNIVERSITY AVE SE, Grades: KG-12)
- BAIS YAAKOV HIGH SCHOOL (Students: 34, Location: 4221 SUNSET BLVD, Grades: 9-12, Girls only)
Biggest public elementary/middle schools in Minneapolis:
- CEDAR RIVERSIDE COMMUNITY SCHOOL (Location: 1610 S 6TH STREET STE 100, Grades: KG-8, Charter school)
- MINNESOTA TRANSITIONS CHARTER ELEM (Location: 1800 2ND STREET NE, Grades: KG-8, Charter school)
- MINNESOTA TRANSITIONS MIDDLE (Location: 2526 27TH AVE S, Grades: 6-8, Charter school)
- BANAADIR ACADEMY (Location: 1130 7TH STREET NORTH, Grades: KG-8, Charter school)
- HARVEST PREPARATORY SCHOOL (Location: 1300 OLSON MEMORIAL HWY, Grades: KG-6, Charter school)
- SOJOURNER TRUTH ACADEMY (Location: 3820 EMERSON AVE N, Grades: KG-8, Charter school)
- FAIR SCHOOL DOWNTOWN (K-3) (Location: 10 S 10TH STREET, Grades: KG-3)
- TWIN CITIES INTERNATIONAL ELEM SCH (Location: 277 12TH AVE N, Grades: KG-4, Charter school)
- MN INTERNATIONAL MIDDLE CHR SCHOOL (Location: 277 12TH AVE N, Grades: 5-8, Charter school)
- FRIENDSHIP ACDMY OF FINE ARTS CHTR. (Location: 2600 E 38TH ST, Grades: KG-6, Charter school)
Biggest private elementary/middle schools in Minneapolis:
- ANNUNCIATION SCHOOL (Students: 413, Location: 525 W 54TH ST, Grades: KG-8)
- CARONDELET CATHOLIC SCHOOL (Students: 413, Location: 3210 W 51ST ST, Grades: KG-8)
- HEILICHER MINNEAPOLIS JEWISH DAY SCHOOL (Students: 395, Location: 4330 CEDAR LAKE RD S, Grades: KG-8)
- RISEN CHRIST CATHOLIC SCHOOL (Students: 334, Location: 1120 E 37TH ST, Grades: KG-8)
- ST CHARLES BORROMEO SCHOOL (Students: 311, Location: 2727 STINSON BLVD, Grades: PK-8)
- LAKE COUNTRY SCHOOL (Students: 303, Location: 3755 PLEASANT AVE, Grades: PK-8)
- SACRED HEART CATHOLIC SCHOOL (Students: 267, Location: 4050 HUBBARD AVE N, Grades: PK-8)
- ASCENSION ELEMENTARY SCHOOL (Students: 245, Location: 1726 DUPONT AVE N, Grades: KG-8)
- CALVIN CHRISTIAN SCHOOL - BLAINE (Students: 209, Location: 8966 PIERCE ST NE, Grades: KG-8)
- CITY OF LAKES WALDORF SCHOOL (Students: 208, Location: 2344 NICOLLET AVE, Grades: PK-8)
User-submitted facts and corrections:
- The rock musician, Prince (born 6-7-58 in Hennepin County), is from Minneapolis and is not listed in your famous people section.
- http://www.metrodeafschool.org/ http://www.mnnorthstaracademy.org/ added by spicyhoneyj
- NE Regional Catholic School is now Pope John Paul II Catholic school and the number of students has decreased significantly.
- Minneapolis has 5 professional sports teams.
- There is another private high school in the Minneapolis area that you (whomever) have left out. Benilde-St. Margaret's School in St. Louis Park, MN. Grades 7-12. Address: 2501 Hwy 100 South, St. Louis Park, MN 55416
- NE Regional Catholic School is now Pope John Paul II Catholic school and the number of students has decreased significantly.
Points of interest:
Notable locations in Minneapolis: Columbia Golf Course (A), Minikahda Golf Course (B), Hiawatha Municipal Golf Course (C), Hubert H Humphrey Metrodome (D), Minneapolis Farmers Market (E), Burlington Northern Station (F), Target Field (G), Baptist Rest Home (H), Saint Joseph's Home For Children (I), Fairview Acute Rehabilitation Center (J), Saint Josephs Orphanage (K), Minneapolis Fire Department Station 14 (L), Minneapolis Fire Department Station 5 (M), Whitney Hall (N), Whitney Fine Arts Center (O), Wells Center (P), Webber Park Library (Q), Walker Art Center Expansion (R), Walker Art Center (S), United States Courthouse and Federal Building (T). Display/hide their locations on the map
Shopping Centers: 1200 on the Mall Shopping Center (1), 1221 Nicolette Mall Shopping Center (2), Broadway Shopping Center (3), Calhoun Square Shopping Center (4), Calhoun Village Shopping Center (5), City Center Shopping Center (6), Crystal Court Shopping Center (7), Gaviidae Common 1 Shopping Center (8), Gaviidae Common 2 Shopping Center (9). Display/hide their locations on the map
Main business address in Minneapolis include: ENTRX CORP (A), BEMIS CO INC (B). Display/hide their locations on the map
Churches in Minneapolis include: Zion Evangelical Lutheran Church (A), Zion Baptist Church (B), Worldwide Outreach for Christ Ministries (C), World Harvest Christian Church (D), Word of His Power Church (E), Word of Grace Baptist Church (F), Witnesses for Christ Church (G), Westminster Presbyterian Church (H), Wesley United Methodist Church (I). Display/hide their locations on the map
Cemeteries: Oak Hill Cemetery (1), Pioneers and Soldiers Cemetery (2), Crystal Lake Cemetery (3), Saint Anthony Cemetery (4), Saint Marys Cemetery (5), Lakewood Cemetery (6), Temple Israel Cemetery (7). Display/hide their locations on the map
Lakes and reservoirs: Birch Pond (A), Powderhorn Lake (B), Lake Nokomis (C), Mother Lake (D), Lake of the Isles (E), Lake Hiawatha (F), Lake Harriet (G), Diamond Lake (H). Display/hide their locations on the map
Creeks: Shingle Creek (A), Bassett Creek (B), Ryan Creek (C), Minnehaha Creek (D). Display/hide their locations on the map
Parks in Minneapolis include: Elliot Park (1), Fairview Park (2), Farwell Park (3), Folwell Park (4), Glen Gale Park (5), Harrison Park (6), Jackson Square (7), Kenny Park (8), Kenwood Park (9). Display/hide their locations on the map
Tourist attractions: Bill & Bonnie Daniels Firefighters Hall & Museum (664 22nd Avenue Northeast) (1), Golden Wings Museum (8891 Airport Road Northeast Suite 6C) (2), Minneapolis Institute of Arts (Museums; 2400 3rd Avenue South) (3), Holy Land Exhibit (Museums; 434 Ridgewood Avenue) (4), Hennepin History Museum (2303 3rd Avenue South) (5), Center for Early Learning & Living of the Sciences (Museums; 4139 Regent Avenue North) (6), Aminah Hair Sytlist (Museums; 7500 69th Avenue North) (7), Fridley Historical Society Museum (611 Mississippi Street Northeast) (8), American Wings Air Museum (2141 Rhode Island Avenue) (9). Display/hide their approximate locations on the map
Hotels: COE Mansion Carriage House (1700 3rd Avenue South) (1), Radisson Hotel Metrodome (615 Washington Avenue Southeast) (2), Best Western Kelly Inn (5201 Central Avenue Northeast) (3), Drake Hotel Property Inc (410 10th St) (4), Highway House Hotel (1626 County Highway 10) (5), Residence Inn Minneapolis Downtown (45 S 8th St) (6), Best Western American Inn (3924 Excelsior Boulevard) (7), Bklyn Center MPLS StPaul Area (6445 James Circle) (8), Skyline Motel (I Highway 35 & Highway 10 West) (9). Display/hide their approximate locations on the map
Courts: Sheridan Court (2500 West 66th Street) (1), United States Government - Bankruptcy Courts- District Court (300 South 4th Street) (2), United States Government - Courts U S- Appeals Court- Chief Judge James B L (300 South 4th Street) (3), Courts-Federal - District Court- Judges- Michael J Davis (300 South 4th Street) (4), United States Government - Chief Judge Gregory F Kishel- Courts U S- Bankruptcy C (300 South 4th Street) (5), Courts-Federal - District Court- Judges- Senior Judge David S Doty (300 South 4th Street) (6), Courts - Federal - Bankruptcy Court- Clerk's Office- Bankruptcy Courts (300 South 4th Street Suite 107) (7), United States Government - Immigration Court- Executive Office For Immigration Re (7850 Metro Parkway) (8), United States Government - Judge Dennis D O'Brien- Courts U S- Bankruptcy C (300 South 4th Street) (9). Display/hide their approximate locations on the map
Birthplace of: Scott Norton - Professional wrestler, Jesse Ventura - (born 1952), wrestler elected the governor of Minnesota, Marian Breland Bailey - Psychologist, Charles M. Schulz - Cartoonist, Jessie Bernard - Sociologist and feminist scholar, Nikita Koloff - Professional wrestler, Edward P. Ney - Physicist, Dan Dworsky - Architect and former professional football player, Lacey (wrestler) - Female professional wrestler, John William Vessey, Jr. - Recipient of the Purple Heart medal.
Drinking water stations with addresses in Minneapolis and their reported violations in the past:
HOLIDAY STATION STORE #231 (Serves MI, Population served: 1,000, Groundwater):Past monitoring violations:BRA MOR MOBILE HOME PARK (Serves TX, Population served: 510, Purch surface water):
- One routine major monitoring violation
Past monitoring violations:HOLIDAY STATION STORE#650 - PITTMAN RD (Serves AK, Population served: 207, Groundwater):
- Follow-up Or Routine LCR Tap M/R - In OCT-01-2011, Contaminant: Lead and Copper Rule
Past monitoring violations:FORBES MOBILE HOME PARK (Population served: 70, Groundwater):
- 5 routine major monitoring violations
Past monitoring violations:YMCA CAMP ST CROIX -RENTAL (Serves WI, Population served: 35, Groundwater):
- Lead Consumer Notice - Between JAN-01-2012 and JAN-10-2012, Contaminant: Lead and Copper Rule. Follow-up actions: St Violation/Reminder Notice (2 times from NOV-01-2011 to DEC-02-2011), St Formal NOV issued (JAN-06-2012), St Compliance achieved (JAN-10-2012)
- One routine major monitoring violation
Past health violations:YMCA CAMP ST CROIX - FARM HOUSE (Serves WI, Population served: 25, Groundwater):
- MCL, Monthly (TCR) - In OCT-2012, Contaminant: Coliform. Follow-up actions: St Boil Water Order (NOV-07-2012), St Violation/Reminder Notice (NOV-07-2012), St Public Notif requested (NOV-07-2012), St Compliance achieved (NOV-15-2012), St Public Notif received (NOV-19-2012)
Past health violations:
- MCL, Monthly (TCR) - In JUL-2012, Contaminant: Coliform. Follow-up actions: St Public Notif requested (JUL-06-2012), St Violation/Reminder Notice (JUL-06-2012), St Public Notif received (JUL-11-2012), St Compliance achieved (JUL-13-2012)
Drinking water stations with addresses in Minneapolis that have no violations reported:
- YMCA CAMP ST CROIX - DINING HALL (Serves WI, Population served: 400, Primary Water Source Type: Groundwater)
- YMCA CAMP ST CROIX - BATH HOUSE (Serves WI, Population served: 125, Primary Water Source Type: Groundwater)
- HOLIDAY STATION STORE (Serves MI, Population served: 100, Primary Water Source Type: Groundwater)
- CHATHAM PARK (Population served: 84, Primary Water Source Type: Groundwater)
- YMCA CAMP ST CROIX - SOUTH WELL (Serves WI, Population served: 50, Primary Water Source Type: Groundwater)
- EQUINOX REI LLC DELLWOOD ESTATES (Serves WI, Population served: 50, Primary Water Source Type: Groundwater)
- YMCA CAMP ST CROIX - SHOP (Serves WI, Population served: 35, Primary Water Source Type: Groundwater)
- MADELINE ISLAND MUSIC CAMP PERFORMANCE HALL CLUBHOUSE (Serves WI, Population served: 25, Primary Water Source Type: Groundwater)
- MADELINE ISLAND MUSIC CAMP STUDENT LODGES (Serves WI, Population served: 25, Primary Water Source Type: Groundwater)
- YMCA CAMP ST CROIX - STABLE (Serves WI, Population served: 25, Primary Water Source Type: Groundwater)
| This city: | 2.2 people |
| Minnesota: | 2.5 people |
| This city: | 44.0% |
| Whole state: | 64.6% |
| This city: | 9.7% |
| Whole state: | 6.9% |
Likely homosexual households (counted as self-reported same-sex unmarried-partner households)
- Lesbian couples: 0.9% of all households
- Gay men: 1.1% of all households
People in group quarters in Minneapolis in 2010:
- 8,740 people in college/university student housing
- 2,814 people in nursing facilities/skilled-nursing facilities
- 1,868 people in emergency and transitional shelters (with sleeping facilities) for people experiencing homelessness
- 1,450 people in other noninstitutional facilities
- 1,405 people in group homes intended for adults
- 696 people in local jails and other municipal confinement facilities
- 677 people in residential treatment centers for adults
- 164 people in correctional residential facilities
- 93 people in group homes for juveniles (non-correctional)
- 49 people in residential treatment centers for juveniles (non-correctional)
- 49 people in correctional facilities intended for juveniles
- 31 people in mental (psychiatric) hospitals and psychiatric units in other hospitals
- 30 people in workers' group living quarters and job corps centers
People in group quarters in Minneapolis in 2000:
- 7,523 people in college dormitories (includes college quarters off campus)
- 4,199 people in nursing homes
- 2,169 people in other noninstitutional group quarters
- 1,068 people in homes or halfway houses for drug/alcohol abuse
- 588 people in other types of correctional institutions
- 488 people in homes for the mentally ill
- 487 people in other group homes
- 384 people in hospitals/wards and hospices for chronically ill
- 384 people in other hospitals or wards for chronically ill
- 325 people in other nonhousehold living situations
- 238 people in homes for the mentally retarded
- 149 people in wards in general hospitals for patients who have no usual home elsewhere
- 118 people in short-term care, detention or diagnostic centers for delinquent children
- 103 people in halfway houses
- 99 people in local jails and other confinement facilities (including police lockups)
- 47 people in religious group quarters
- 45 people in schools, hospitals, or wards for the intellectually disabled
- 18 people in homes for the physically handicapped
- 16 people in unknown juvenile institutions
Banks with most branches in Minneapolis (2011 data):
- Wells Fargo Bank, National Association: 19 branches. Info updated 2011/04/05: Bank assets: $1,161,490.0 mil, Deposits: $905,653.0 mil, headquarters in Sioux Falls, SD, positive income, 6395 total offices, Holding Company: Wells Fargo & Company
- U.S. Bank National Association: 16 branches. Info updated 2012/01/30: Bank assets: $330,470.8 mil, Deposits: $236,091.5 mil, headquarters in Cincinnati, OH, positive income, 3121 total offices, Holding Company: U.S. Bancorp
- TCF National Bank: 11 branches. Info updated 2009/11/23: Bank assets: $19,007.0 mil, Deposits: $12,377.0 mil, headquarters in Sioux Falls, SD, positive income, Commercial Lending Specialization, 441 total offices, Holding Company: Tcf Financial Corporation
- Guaranty Bank: Brooklyn Park Mn Branch, 2919 26th Ave South, Minneapolis Branch, Plymouth Mn Branch, Minneapolis Branch, Columbia Heights Branch. Info updated 2011/07/21: Bank assets: $1,179.1 mil, Deposits: $1,102.7 mil, headquarters in Milwaukee, WI, negative income in the last year, Mortgage Lending Specialization, 166 total offices
- Franklin National Bank of Minneapolis: Blaisdell Avenue Branch, Lake Street Branch, Karmel Office Branch, Franklin National Bank Of Minneapoli. Info updated 2009/09/11: Bank assets: $145.7 mil, Deposits: $118.8 mil, local headquarters, positive income, Commercial Lending Specialization, 4 total offices, Holding Company: University Financial Corp, Inc. Dba Sunrise Community Banks
- BMO Harris Bank National Association: Coon Rapids Office, Nicolet Mall Office, 6th & Nicollet Branch, Lake Street Branch. Info updated 2011/07/14: Bank assets: $97,264.0 mil, Deposits: $75,624.6 mil, headquarters in Chicago, IL, positive income, 717 total offices, Holding Company: Bank Of Montreal
- First National Bank of the Lakes: Uptown Drive Through Branch, Minneapolis Branch, Hennepin Avenue Branch. Info updated 2006/11/03: Bank assets: $60.9 mil, Deposits: $55.1 mil, headquarters in Navarre, MN, positive income, 5 total offices, Holding Company: Orono Financial, Inc.
- Bremer Bank, National Association: Calhoun Square Branch, Ids Center Branch, Minneapolis 6th Street Branch. Info updated 2006/11/03: Bank assets: $2,725.5 mil, Deposits: $2,268.8 mil, headquarters in South St. Paul, MN, positive income, Commercial Lending Specialization, 29 total offices, Holding Company: Otto Bremer Foundation
- Associated Bank, National Association: Minneapolis Ids Center Branch at 740 Marquette Avenue, branch established on 1989/07/31; Minneapolis Cedar Riverside Branch at 1801 Riverside Drive, branch established on 1963/02/21. Info updated 2008/09/12: Bank assets: $21,715.0 mil, Deposits: $15,244.4 mil, headquarters in Green Bay, WI, positive income, Commercial Lending Specialization, 282 total offices, Holding Company: Associated Banc-Corp
- 17 other banks with 18 local branches
For population 15 years and over in Minneapolis:
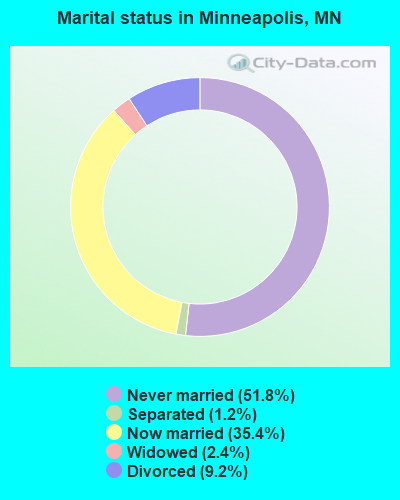
- Never married: 51.8%
- Now married: 35.4%
- Separated: 1.2%
- Widowed: 2.4%
- Divorced: 9.2%
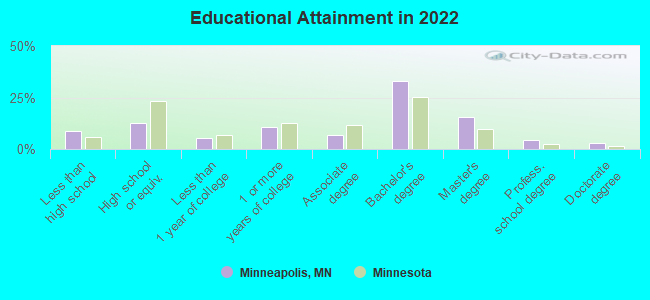
For population 25 years and over in Minneapolis:
- High school or higher: 91.3%
- Bachelor's degree or higher: 55.9%
- Graduate or professional degree: 22.9%
- Unemployed: 4.1%
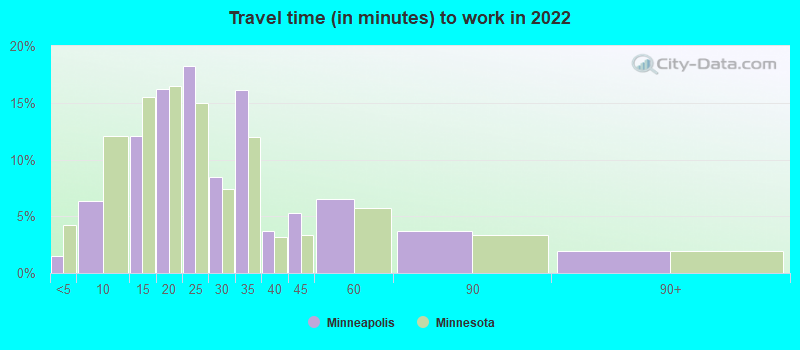
- Mean travel time to work (commute): 16.7 minutes

| Here: | 12.8 |
| Minnesota average: | 10.9 |
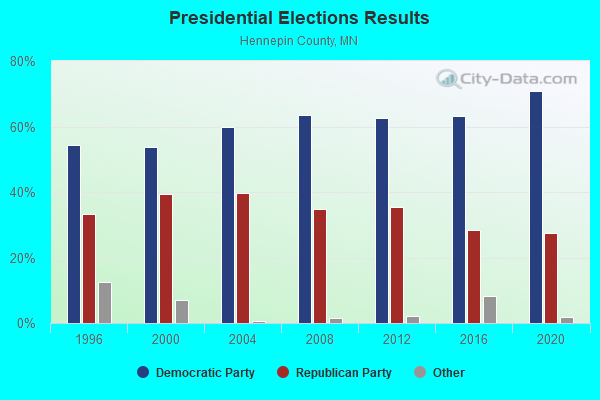
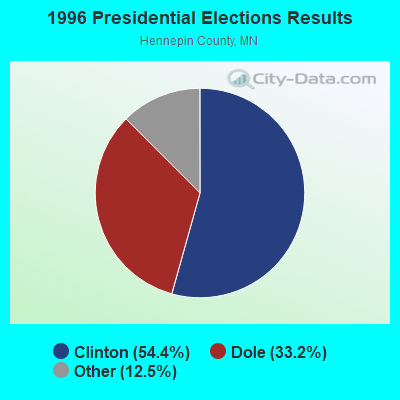
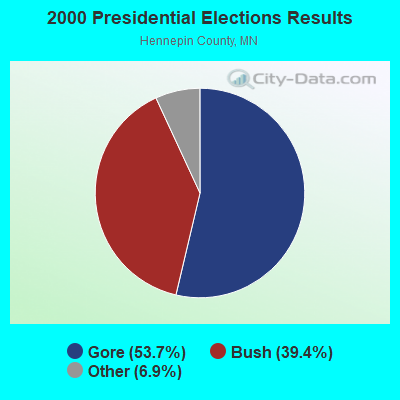

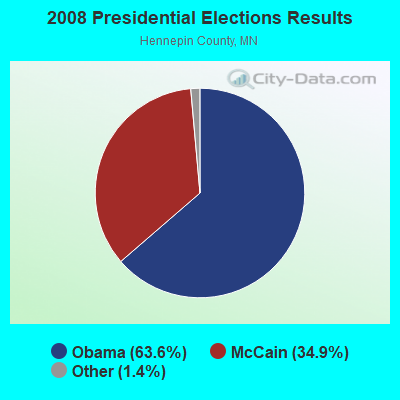
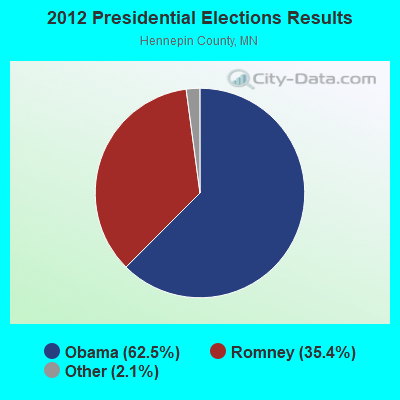
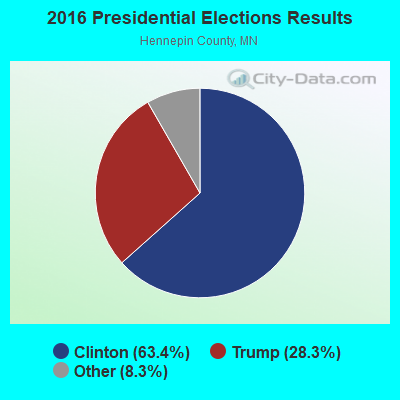
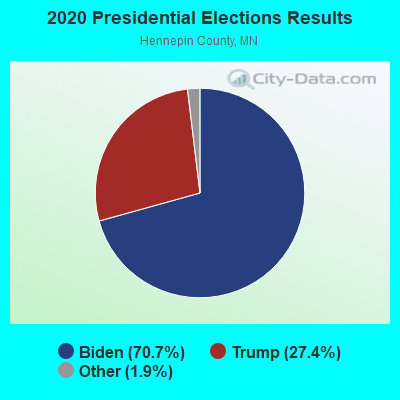
Graphs represent county-level data. Detailed 2008 Election Results
Neighborhoods in Minneapolis:
(Minneapolis, Minnesota Neighborhood Map)- Armatage neighborhood
- Audubon Park neighborhood
- Bancroft neighborhood
- Beltrami neighborhood
- Bottineau neighborhood
- Bryant neighborhood
- Bryn-Mawr neighborhood
- Calhoun Isles neighborhood
- Camden neighborhood
- Camden Industrial neighborhood
- Carag neighborhood
- Cedar-Isles neighborhood
- Cedar-Riverside neighborhood
- Central neighborhood
- Cleveland neighborhood
- Columbia neighborhood
- Como neighborhood
- Cooper neighborhood
- Corcoran neighborhood
- Diamond Lake neighborhood
- Downtown East neighborhood
- Downtown West neighborhood
- East Harriet neighborhood
- East Isles neighborhood
- Ecco neighborhood
- Elliot Park neighborhood
- Ericsson neighborhood
- Field neighborhood
- Folwell neighborhood
- Fulton neighborhood
- Greater Central neighborhood
- Greater Longfellow neighborhood
- Greater Near North neighborhood
- Hale neighborhood
- Harrison neighborhood
- Hawthorne neighborhood
- Hiawatha neighborhood
- Holland neighborhood
- Howe neighborhood
- Humboldt Industrial neighborhood
- Johnsville neighborhood
- Jordan neighborhood
- Keewaydin neighborhood
- Kenny neighborhood
- Kenwood neighborhood
- King Field neighborhood
- Lind-Bohanon neighborhood
- Linden Hills neighborhood
- Logan Park neighborhood
- Longfellow neighborhood
- Loring Park neighborhood
- Lowry Hill neighborhood
- Lowry Hill East neighborhood
- Lyndale neighborhood
- Lynnhurst neighborhood
- Marcy-Holmes neighborhood
- Marshall Terrace neighborhood
- Mckinley neighborhood
- Medicine Lake neighborhood
- Mid-City Industrial neighborhood
- Minnehaha neighborhood
- Morris Park neighborhood
- Near North neighborhood
- Nicollet Island neighborhood
- Nokomis neighborhood
- North Loop neighborhood
- Northeast neighborhood
- Northeast Park neighborhood
- Northrup neighborhood
- Oak Park neighborhood
- Page neighborhood
- Phillips neighborhood
- Powderhorn neighborhood
- Powderhorn Park neighborhood
- Prospect Park neighborhood
- Regina neighborhood
- Seward neighborhood
- Sheridan neighborhood
- Shingle Creek neighborhood
- Southwest neighborhood
- St. Anthony East neighborhood
- St. Anthony West neighborhood
- Standish neighborhood
- Stevens Square neighborhood
- Sumner-glenwood neighborhood
- Tangletown neighborhood
- University neighborhood
- University Of Minnesota (University Of Mn) neighborhood
- Victory neighborhood
- Waite Park neighborhood
- Webber-Camden neighborhood
- Wenonah neighborhood
- West Calhoun neighborhood
- Whittier neighborhood
- Willard-Hay neighborhood
- Windom neighborhood
- Windom Park neighborhood
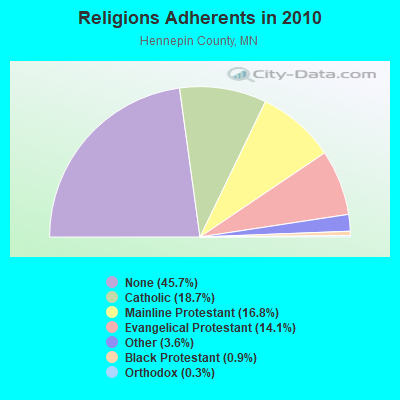
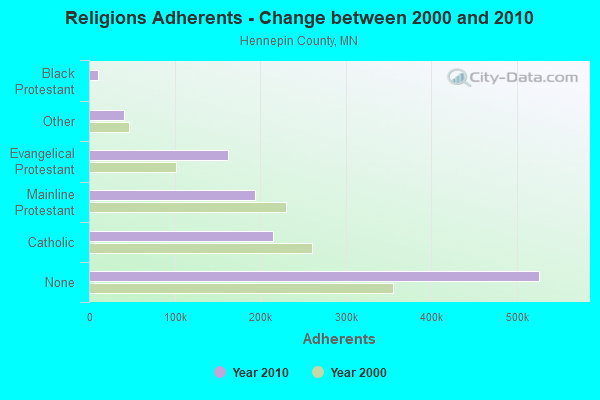
Religion statistics for Minneapolis, MN (based on Hennepin County data)
| Religion | Adherents | Congregations |
|---|---|---|
| Catholic | 215,205 | 74 |
| Mainline Protestant | 193,498 | 234 |
| Evangelical Protestant | 162,094 | 393 |
| Other | 41,287 | 110 |
| Black Protestant | 10,812 | 21 |
| Orthodox | 3,337 | 6 |
| None | 526,192 | - |
Food Environment Statistics:
| Here: | 1.79 / 10,000 pop. |
| State: | 1.83 / 10,000 pop. |
| Hennepin County: | 0.12 / 10,000 pop. |
| Minnesota: | 0.13 / 10,000 pop. |
| Hennepin County: | 0.69 / 10,000 pop. |
| State: | 0.49 / 10,000 pop. |
| Hennepin County: | 2.50 / 10,000 pop. |
| State: | 3.90 / 10,000 pop. |
| Hennepin County: | 7.13 / 10,000 pop. |
| Minnesota: | 6.98 / 10,000 pop. |
| Hennepin County: | 5.8% |
| State: | 6.5% |
| Hennepin County: | 22.8% |
| Minnesota: | 25.9% |
| This county: | 15.2% |
| Minnesota: | 13.0% |
Health and Nutrition:
| This city: | 50.1% |
| Minnesota: | 50.6% |
| Here: | 48.9% |
| Minnesota: | 48.4% |
| Here: | 28.3 |
| Minnesota: | 28.5 |
| Minneapolis: | 19.3% |
| State: | 21.0% |
| This city: | 10.1% |
| Minnesota: | 9.8% |
| Minneapolis: | 6.8 |
| Minnesota: | 6.8 |
| This city: | 30.9% |
| Minnesota: | 33.5% |
| Minneapolis: | 58.6% |
| State: | 57.7% |
| Minneapolis: | 82.0% |
| Minnesota: | 79.3% |
More about Health and Nutrition of Minneapolis, MN Residents
| Local government employment and payroll (March 2022) | |||||
| Function | Full-time employees | Monthly full-time payroll | Average yearly full-time wage | Part-time employees | Monthly part-time payroll |
|---|---|---|---|---|---|
| Police Protection - Officers | 915 | $8,315,296 | $109,053 | 1 | $2,043 |
| Other and Unallocable | 588 | $3,862,115 | $78,819 | 1,982 | $1,106,673 |
| Streets and Highways | 458 | $2,982,951 | $78,156 | 1 | $1,419 |
| Other Government Administration | 450 | $3,140,626 | $83,750 | 33 | $70,594 |
| Firefighters | 433 | $3,600,628 | $99,786 | 0 | $0 |
| Financial Administration | 290 | $2,403,118 | $99,439 | 4 | $6,650 |
| Water Supply | 197 | $1,373,986 | $83,695 | 3 | $1,185 |
| Police - Other | 153 | $982,370 | $77,049 | 18 | $23,102 |
| Parks and Recreation | 147 | $387,271 | $31,614 | 129 | $145,846 |
| Solid Waste Management | 118 | $624,088 | $63,467 | 0 | $0 |
| Sewerage | 115 | $760,076 | $79,312 | 0 | $0 |
| Judicial and Legal | 114 | $963,181 | $101,387 | 14 | $17,309 |
| Housing and Community Development (Local) | 105 | $916,652 | $104,760 | 1 | $762 |
| Health | 100 | $729,468 | $87,536 | 4 | $1,915 |
| Welfare | 37 | $274,731 | $89,102 | 1 | $4,685 |
| Fire - Other | 32 | $250,639 | $93,990 | 0 | $0 |
| Totals for Government | 4,252 | $31,567,195 | $89,089 | 2,191 | $1,382,184 |
Minneapolis government finances - Expenditure in 2021 (per resident):
- Construction - Regular Highways: $96,604,000 ($227.25)
General Public Buildings: $84,372,000 ($198.48)
Water Utilities: $44,637,000 ($105.00)
Sewerage: $32,457,000 ($76.35)
Parking Facilities: $8,094,000 ($19.04)
Solid Waste Management: $6,779,000 ($15.95)
- Current Operations - Police Protection: $182,981,000 ($430.45)
General - Other: $174,437,000 ($410.35)
Housing and Community Development: $149,911,000 ($352.65)
Parks and Recreation: $126,792,000 ($298.27)
Sewerage: $100,569,000 ($236.58)
Local Fire Protection: $69,418,000 ($163.30)
Water Utilities: $55,216,000 ($129.89)
Regular Highways: $55,114,000 ($129.65)
Parking Facilities: $51,729,000 ($121.69)
Solid Waste Management: $41,471,000 ($97.56)
Financial Administration: $27,402,000 ($64.46)
Protective Inspection and Regulation - Other: $23,867,000 ($56.14)
Health - Other: $18,629,000 ($43.82)
Central Staff Services: $16,137,000 ($37.96)
Judicial and Legal Services: $15,975,000 ($37.58)
General Public Buildings: $8,744,000 ($20.57)
- General - Interest on Debt: $91,647,000 ($215.59)
- Intergovernmental to Local - Other - Regular Highways: $4,182,000 ($9.84)
Other - Solid Waste Management: $2,104,000 ($4.95)
Other - Sewerage: $1,990,000 ($4.68)
Other - Water Utilities: $62,000 ($0.15)
Other - Parking Facilities: $16,000 ($0.04)
- Total Salaries and Wages: $335,132,000 ($788.37)
- Water Utilities - Interest on Debt: $2,553,000 ($6.01)
Minneapolis government finances - Revenue in 2021 (per resident):
- Charges - Sewerage: $126,702,000 ($298.06)
Housing and Community Development: $97,631,000 ($229.67)
Parking Facilities: $43,769,000 ($102.96)
Solid Waste Management: $39,990,000 ($94.07)
Other: $33,375,000 ($78.51)
Parks and Recreation: $24,344,000 ($57.27)
- Federal Intergovernmental - Health and Hospitals: $36,253,000 ($85.28)
Housing and Community Development: $12,135,000 ($28.55)
Highways: $7,026,000 ($16.53)
Other: $5,065,000 ($11.91)
- Local Intergovernmental - Sewerage: $10,492,000 ($24.68)
Other: $6,153,000 ($14.47)
- Miscellaneous - Interest Earnings: $96,975,000 ($228.12)
Special Assessments: $31,670,000 ($74.50)
General Revenue - Other: $23,012,000 ($54.13)
Rents: $6,042,000 ($14.21)
Fines and Forfeits: $5,278,000 ($12.42)
Donations From Private Sources: $4,442,000 ($10.45)
Sale of Property: $3,713,000 ($8.73)
- Revenue - Water Utilities: $84,318,000 ($198.35)
- State Intergovernmental - General Local Government Support: $71,823,000 ($168.96)
Highways: $47,846,000 ($112.55)
Other: $29,783,000 ($70.06)
Health and Hospitals: $3,093,000 ($7.28)
- Tax - Property: $427,798,000 ($1006.36)
General Sales and Gross Receipts: $69,418,000 ($163.30)
Other License: $55,532,000 ($130.63)
Public Utilities Sales: $31,208,000 ($73.41)
Other Selective Sales: $17,085,000 ($40.19)
Alcoholic Beverage Sales: $3,450,000 ($8.12)
Minneapolis government finances - Debt in 2021 (per resident):
- Long Term Debt - Beginning Outstanding - Public Debt for Private Purpose: $1,843,000,000 ($4335.49)
Outstanding Nonguaranteed - Industrial Revenue: $1,744,000,000 ($4102.60)
Beginning Outstanding - Unspecified Public Purpose: $851,974,000 ($2004.19)
Outstanding Unspecified Public Purpose: $829,988,000 ($1952.47)
Retired Unspecified Public Purpose: $172,496,000 ($405.78)
Issue, Unspecified Public Purpose: $150,510,000 ($354.06)
Retired Nonguaranteed - Public Debt for Private Purpose: $99,000,000 ($232.89)
Minneapolis government finances - Cash and Securities in 2021 (per resident):
- Bond Funds - Cash and Securities: $28,349,000 ($66.69)
- Other Funds - Cash and Securities: $891,500,000 ($2097.17)
- Sinking Funds - Cash and Securities: $1,744,000,000 ($4102.60)
6.75% of this county's 2021 resident taxpayers lived in other counties in 2020 ($70,758 average adjusted gross income)
| Here: | 6.75% |
| Minnesota average: | 7.43% |
0.00% of residents moved from foreign countries ($39 average AGI)
Hennepin County: 0.00% Minnesota average: 0.00%
Top counties from which taxpayers relocated into this county between 2020 and 2021:
| from Ramsey County, MN | |
| from Anoka County, MN | |
| from Dakota County, MN |
8.44% of this county's 2020 resident taxpayers moved to other counties in 2021 ($85,733 average adjusted gross income)
| Here: | 8.44% |
| Minnesota average: | 7.79% |
0.01% of residents moved to foreign countries ($68 average AGI)
Hennepin County: 0.01% Minnesota average: 0.00%
Top counties to which taxpayers relocated from this county between 2020 and 2021:
| to Ramsey County, MN | |
| to Anoka County, MN | |
| to Dakota County, MN |
| Businesses in Minneapolis, MN | ||||
| Name | Count | Name | Count | |
|---|---|---|---|---|
| ALDI | 2 | Kmart | 1 | |
| AT&T | 1 | LA Fitness | 1 | |
| Ace Hardware | 7 | Lane Furniture | 3 | |
| Advance Auto Parts | 1 | Little Caesars Pizza | 3 | |
| Aeropostale | 1 | Macy's | 1 | |
| Ann Taylor | 1 | Marriott | 7 | |
| Apple Store | 1 | Marshalls | 1 | |
| Applebee's | 13 | MasterBrand Cabinets | 14 | |
| Arby's | 4 | Maurices | 1 | |
| Audi | 1 | McDonald's | 13 | |
| AutoZone | 1 | Men's Wearhouse | 1 | |
| Bally Total Fitness | 3 | Motherhood Maternity | 1 | |
| Banana Republic | 1 | New Balance | 15 | |
| Barnes & Noble | 2 | Nike | 17 | |
| Ben & Jerry's | 1 | Office Depot | 1 | |
| Best Western | 1 | OfficeMax | 2 | |
| Blockbuster | 4 | Old Navy | 1 | |
| Brooks Brothers | 1 | Panda Express | 1 | |
| Brookstone | 2 | Panera Bread | 2 | |
| Budget Car Rental | 3 | Papa John's Pizza | 5 | |
| Buffalo Wild Wings | 1 | Payless | 3 | |
| Burger King | 8 | Penske | 1 | |
| CVS | 7 | PetSmart | 2 | |
| Caribou Coffee | 26 | Pizza Hut | 5 | |
| Chick-Fil-A | 1 | Popeyes | 1 | |
| Chipotle | 9 | Qdoba Mexican Grill | 1 | |
| Comfort Suites | 1 | Quiznos | 6 | |
| Curves | 3 | RadioShack | 3 | |
| DHL | 13 | Ramada | 2 | |
| Dairy Queen | 10 | SAS Shoes | 2 | |
| Days Inn | 1 | Sam's Club | 1 | |
| Deb | 1 | Sears | 2 | |
| Dennys | 1 | Sheraton | 1 | |
| Domino's Pizza | 16 | Sprint Nextel | 3 | |
| Famous Footwear | 1 | Starbucks | 19 | |
| FedEx | 79 | Subway | 10 | |
| Firestone Complete Auto Care | 2 | T-Mobile | 4 | |
| Foot Locker | 3 | Taco Bell | 6 | |
| Ford | 2 | Talbots | 1 | |
| GNC | 4 | Target | 3 | |
| GameStop | 2 | The Limited | 1 | |
| Gap | 1 | True Value | 2 | |
| H&R Block | 9 | U-Haul | 7 | |
| Haworth | 2 | UPS | 121 | |
| Hilton | 7 | Urban Outfitters | 1 | |
| Holiday Inn | 5 | Vans | 1 | |
| Home Depot | 1 | Verizon Wireless | 3 | |
| Honda | 1 | Victoria's Secret | 1 | |
| Hyatt | 3 | Walgreens | 11 | |
| Jamba Juice | 3 | Walmart | 1 | |
| Jimmy Jazz | 1 | Wendy's | 6 | |
| Jimmy John's | 9 | Westin | 1 | |
| JoS. A. Bank | 1 | White Castle | 3 | |
| Jones New York | 1 | Whole Foods Market | 1 | |
| KFC | 2 | YMCA | 7 | |
Strongest AM radio stations in Minneapolis:
- KUOM (770 AM; daytime; 5 kW; MINNEAPOLIS, MN)
- WCCO (830 AM; 50 kW; MINNEAPOLIS, MN; Owner: INFINITY MEDIA CORPORATION)
- KSTP (1500 AM; 50 kW; ST. PAUL, MN; Owner: KSTP-AM, LLC (DELAWARE))
- WWTC (1280 AM; 5 kW; MINNEAPOLIS, MN; Owner: SCA LICENSE CORPORATION)
- KDIZ (1440 AM; 5 kW; GOLDEN VALLEY, MN; Owner: KQRS, INC.)
- KTIS (900 AM; 25 kW; MINNEAPOLIS, MN; Owner: NORTHWESTERN COLLEGE)
- KYCR (1570 AM; 4 kW; GOLDEN VALLEY, MN; Owner: COMMON GROUND BROADCASTING COMPANY,)
- WCTS (1030 AM; 50 kW; MAPLEWOOD, MN; Owner: CNTL. BAPT. THEO/AL SEMI MINNEAPOLIS)
- KFAN (1130 AM; 50 kW; MINNEAPOLIS, MN; Owner: AMFM RADIO LICENSES, L.L.C.)
- KLBB (1400 AM; 1 kW; ST. PAUL, MN; Owner: 1400, INC.)
- WMNN (1330 AM; 10 kW; MINNEAPOLIS, MN; Owner: MINNESOTA PUBLIC RADIO.)
- KLBP (1470 AM; 5 kW; BROOKLYN PARK, MN; Owner: 1400, INC.)
- KKMS (980 AM; 5 kW; RICHFIELD, MN)
Strongest FM radio stations in Minneapolis:
- K214DF (90.7 FM; GOLDEN VALLEY, MN; Owner: EDUCATIONAL MEDIA FOUNDATION)
- KFAI (90.3 FM; MINNEAPOLIS, MN; Owner: FRESH AIR, INC.)
- KTCZ-FM (97.1 FM; MINNEAPOLIS, MN; Owner: AMFM RADIO LICENSES, L.L.C.)
- KNOW-FM (91.1 FM; MINNEAPOLIS-ST. PAUL, MN; Owner: MINNESOTA PUBLIC RADIO)
- WLTE (102.9 FM; MINNEAPOLIS, MN; Owner: INFINITY MEDIA CORPORATION)
- KBEM-FM (88.5 FM; MINNEAPOLIS, MN; Owner: BD. OF EDUCATION, S.S.D. NO. 1)
- KSTP-FM (94.5 FM; ST. PAUL, MN; Owner: KSTP-FM, LLC, A DELAWARE LLC)
- KEEY-FM (102.1 FM; ST. PAUL, MN; Owner: AMFM RADIO LICENSES, L.L.C.)
- KTIS-FM (98.5 FM; MINNEAPOLIS, MN; Owner: NORTHWESTERN COLLEGE)
- KDWB-FM (101.3 FM; RICHFIELD, MN; Owner: AMFM RADIO LICENSES, L.L.C.)
- KQRS-FM (92.5 FM; GOLDEN VALLEY, MN; Owner: KQRS, Inc.)
- KSJN (99.5 FM; MINNEAPOLIS, MN; Owner: MINNESOTA PUBLIC RADIO)
- KXXR (93.7 FM; MINNEAPOLIS, MN; Owner: KQRS, INC.)
- KMOJ (89.9 FM; MINNEAPOLIS, MN; Owner: CENTER FOR COMMUNICATION & DEVELOPEMENT)
- KNOF (95.3 FM; ST. PAUL, MN; Owner: SELBY GOSPEL BROADCASTING CORPORATION)
- KQQL (107.9 FM; ANOKA, MN; Owner: AMFM RADIO LICENSES, L.L.C.)
- WGVZ (105.7 FM; EDEN PRAIRIE, MN; Owner: KQRS, INC.)
- WMCN (91.7 FM; ST. PAUL, MN; Owner: MACALESTER COLLEGE)
- K294AM (106.7 FM; WEST ST. PAUL, MN; Owner: FRESH AIR, INCORPORATED)
- KJZI (100.3 FM; MINNEAPOLIS, MN; Owner: AMFM RADIO LICENSES, L.L.C.)
TV broadcast stations around Minneapolis:
- K07UI (Channel 7; MINNEAPOLIS, ETC., MN; Owner: WORD OF GOD FELLOWSHIP, INC.)
- K14KH (Channel 14; MINNEAPOLIS, MN; Owner: THREE ANGELS BROADCASTING NETWORK)
- WBWX-CA (Channel 13; MINNEAPOLIS, MN; Owner: THE BOX WORLDWIDE LLC)
- K19ER (Channel 19; ST. PAUL, MN; Owner: CATHOLIC VIEWS BROADCASTS, INC.)
- K67HG (Channel 67; MINNEAPOLIS, MN; Owner: VENTANA TELEVISION, INC.)
- W62BD (Channel 62; MINNEAPOLIS, MN; Owner: WORD OF GOD FELLOWSHIP, INC.)
- K58BS (Channel 58; MINNEAPOLIS, MN; Owner: TRINITY BROADCASTING NETWORK)
- KARE (Channel 11; MINNEAPOLIS, MN; Owner: MULTIMEDIA HOLDINGS CORPORATION)
- KSTP-TV (Channel 5; ST. PAUL, MN; Owner: HUBBARD BROADCASTING, INC.)
- KMSP-TV (Channel 9; MINNEAPOLIS, MN; Owner: FOX TELEVISION STATIONS, INC.)
- KTCA-TV (Channel 2; ST. PAUL, MN; Owner: TWIN CITIES PUBLIC TELEVISION, INC.)
- WCCO-TV (Channel 4; MINNEAPOLIS, MN; Owner: CBS BROADCASTING INC.)
- KSTC-TV (Channel 45; MINNEAPOLIS, MN; Owner: HUBBARD BROADCASTING, INC.)
- KTCI-TV (Channel 17; ST. PAUL, MN; Owner: TWIN CITIES PUBLIC TELEVISION, INC.)
- KMWB (Channel 23; MINNEAPOLIS, MN; Owner: KLGT LICENSEE, LLC)
- WFTC (Channel 29; MINNEAPOLIS, MN; Owner: FOX TELEVISION STATIONS, INC.)
- KPXM (Channel 41; ST. CLOUD, MN; Owner: PAXSON MINNEAPOLIS LICENSE, INC.)
Medal of Honor Recipients
Medal of Honor Recipients born in Minneapolis: Franklin Van Valkenburgh, George William Rud, Michael R. Blanchfield, Oscar Frederick Nelson.

- National Bridge Inventory (NBI) Statistics
- 748Number of bridges
- 12,034ft / 3,668mTotal length
- $43,447,988,000Total costs
- 21,380,514Total average daily traffic
- 715,072Total average daily truck traffic
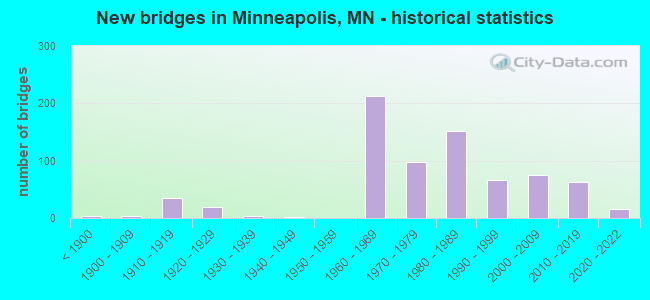
- New bridges - historical statistics
- 3Before 1900
- 41900-1909
- 351910-1919
- 201920-1929
- 41930-1939
- 11940-1949
- 2121960-1969
- 981970-1979
- 1521980-1989
- 671990-1999
- 752000-2009
- 622010-2019
- 152020-2022
FCC Registered Antenna Towers: 561 (See the full list of FCC Registered Antenna Towers)
FCC Registered Commercial Land Mobile Towers: 18 (See the full list of FCC Registered Commercial Land Mobile Towers in Minneapolis, MN)
FCC Registered Private Land Mobile Towers: 35 (See the full list of FCC Registered Private Land Mobile Towers)
FCC Registered Broadcast Land Mobile Towers: 389 (See the full list of FCC Registered Broadcast Land Mobile Towers)
FCC Registered Microwave Towers: 483 (See the full list of FCC Registered Microwave Towers in this town)
FCC Registered Paging Towers: 40 (See the full list of FCC Registered Paging Towers)
FCC Registered Maritime Coast & Aviation Ground Towers: 72 (See the full list of FCC Registered Maritime Coast & Aviation Ground Towers)
FCC Registered Amateur Radio Licenses: 1,548 (See the full list of FCC Registered Amateur Radio Licenses in Minneapolis)
FAA Registered Aircraft: 284 (See the full list of FAA Registered Aircraft in Minneapolis)
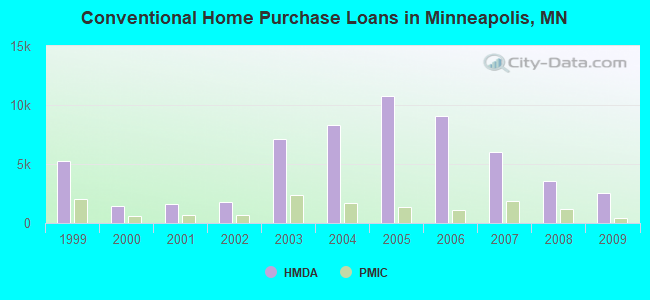
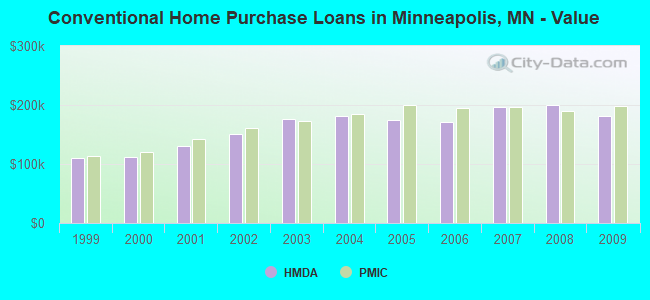
| Home Mortgage Disclosure Act Aggregated Statistics For Year 2009 (Based on 121 full tracts) | ||||||||||||||
| A) FHA, FSA/RHS & VA Home Purchase Loans | B) Conventional Home Purchase Loans | C) Refinancings | D) Home Improvement Loans | E) Loans on Dwellings For 5+ Families | F) Non-occupant Loans on < 5 Family Dwellings (A B C & D) | G) Loans On Manufactured Home Dwelling (A B C & D) | ||||||||
|---|---|---|---|---|---|---|---|---|---|---|---|---|---|---|
| Number | Average Value | Number | Average Value | Number | Average Value | Number | Average Value | Number | Average Value | Number | Average Value | Number | Average Value | |
| LOANS ORIGINATED | 2,126 | $170,880 | 2,533 | $181,448 | 7,028 | $209,595 | 435 | $118,742 | 90 | $482,756 | 1,054 | $130,200 | 1 | $60,000 |
| APPLICATIONS APPROVED, NOT ACCEPTED | 108 | $143,361 | 174 | $197,764 | 638 | $193,672 | 55 | $73,909 | 2 | $92,500 | 65 | $149,800 | 1 | $32,000 |
| APPLICATIONS DENIED | 219 | $140,781 | 372 | $156,218 | 2,428 | $202,219 | 292 | $54,411 | 10 | $1,322,800 | 310 | $134,642 | 8 | $49,375 |
| APPLICATIONS WITHDRAWN | 202 | $157,564 | 298 | $176,902 | 1,746 | $199,606 | 133 | $97,240 | 7 | $552,143 | 180 | $149,144 | 1 | $117,000 |
| FILES CLOSED FOR INCOMPLETENESS | 31 | $152,677 | 62 | $229,323 | 461 | $175,787 | 48 | $65,375 | 0 | $0 | 32 | $135,656 | 0 | $0 |
Detailed mortgage data for all 121 tracts in Minneapolis, MN
| Private Mortgage Insurance Companies Aggregated Statistics For Year 2009 (Based on 112 full tracts) | ||||||
| A) Conventional Home Purchase Loans | B) Refinancings | C) Non-occupant Loans on < 5 Family Dwellings (A & B) | ||||
|---|---|---|---|---|---|---|
| Number | Average Value | Number | Average Value | Number | Average Value | |
| LOANS ORIGINATED | 459 | $197,538 | 192 | $235,880 | 3 | $157,333 |
| APPLICATIONS APPROVED, NOT ACCEPTED | 96 | $180,406 | 64 | $235,312 | 7 | $146,286 |
| APPLICATIONS DENIED | 66 | $171,060 | 36 | $224,833 | 0 | $0 |
| APPLICATIONS WITHDRAWN | 33 | $209,455 | 25 | $228,720 | 0 | $0 |
| FILES CLOSED FOR INCOMPLETENESS | 16 | $183,311 | 8 | $216,375 | 2 | $240,500 |
2002 - 2018 National Fire Incident Reporting System (NFIRS) incidents
- Fire incident types reported to NFIRS in Minneapolis, MN
- 13,11650.1%Structure Fires
- 8,00930.6%Outside Fires
- 4,97619.0%Mobile Property/Vehicle Fires
- 620.2%Other
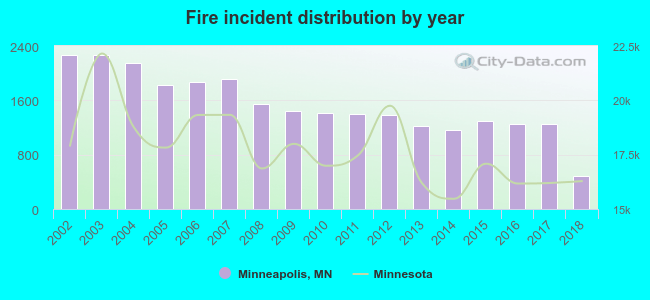 Based on the data from the years 2002 - 2018 the average number of fire incidents per year is 1539. The highest number of fire incidents - 2,269 took place in 2002, and the least - 481 in 2018. The data has a declining trend.
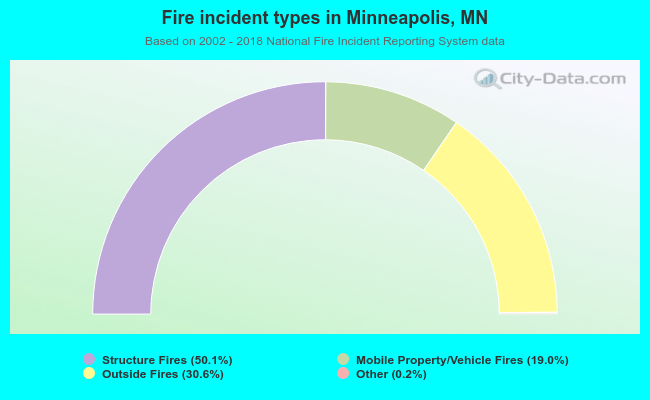 When looking into fire subcategories, the most incidents belonged to: Structure Fires (50.1%), and Outside Fires (30.6%).
Fire-safe hotels and motels in Minneapolis, Minnesota:
- Days Inn Bloomington West, 7851 Normandale Blvd, Minneapolis, Minnesota 55435 , Phone: (952) 835-7400, Fax: (952) 835-4124
- Hyatt Regency Minneapolis, 1300 Nicollet Mall, Minneapolis, Minnesota 55403 , Phone: (800) 233-1234, Fax: (612) 370-1463
- Snelling Motor Inn, 5346 Minnehaha Ave, Minneapolis, Minnesota 55417 , Phone: (612) 721-4841
- Delta Hotels Minneapolis Northeast, 1330 Industrial Blvd NE, Minneapolis, Minnesota 55413 , Phone: (612) 331-1900
- Court Yard By Marriott, 1500 Washington Ave S, Minneapolis, Minnesota 55454 , Phone: (612) 333-4646, Fax: (612) 338-4049
- GuestHouse Inn-Bloomington, 4460 W 78th Cir, Minneapolis, Minnesota 55435 , Phone: (952) 831-3131, Fax: (952) 831-6372
- Crowne Plaza Minneapolis North, 2200 Freeway Blvd, Minneapolis, Minnesota 55430 , Phone: (763) 566-8000, Fax: (763) 566-9386
- Hilton Minneapolis/St Paul Airport Mall Of America, 3800 American Blvd E, Minneapolis, Minnesota 55425 , Phone: (952) 854-2100, Fax: (952) 854-8002
- 86 other hotels and motels
| Most common first names in Minneapolis, MN among deceased individuals | ||
| Name | Count | Lived (average) |
|---|---|---|
| John | 5,741 | 75.3 years |
| Mary | 4,360 | 79.5 years |
| Robert | 3,812 | 70.9 years |
| William | 3,668 | 75.4 years |
| Helen | 3,067 | 81.2 years |
| George | 2,844 | 76.9 years |
| James | 2,838 | 70.2 years |
| Margaret | 2,599 | 80.5 years |
| Anna | 2,489 | 86.0 years |
| Ruth | 2,352 | 82.1 years |
| Most common last names in Minneapolis, MN among deceased individuals | ||
| Last name | Count | Lived (average) |
|---|---|---|
| Johnson | 5,451 | 78.2 years |
| Anderson | 3,698 | 79.2 years |
| Nelson | 2,570 | 78.9 years |
| Peterson | 2,327 | 78.6 years |
| Olson | 2,246 | 78.0 years |
| Carlson | 1,611 | 79.3 years |
| Larson | 1,502 | 78.5 years |
| Smith | 1,406 | 76.4 years |
| Erickson | 1,118 | 79.1 years |
| Miller | 1,020 | 76.2 years |
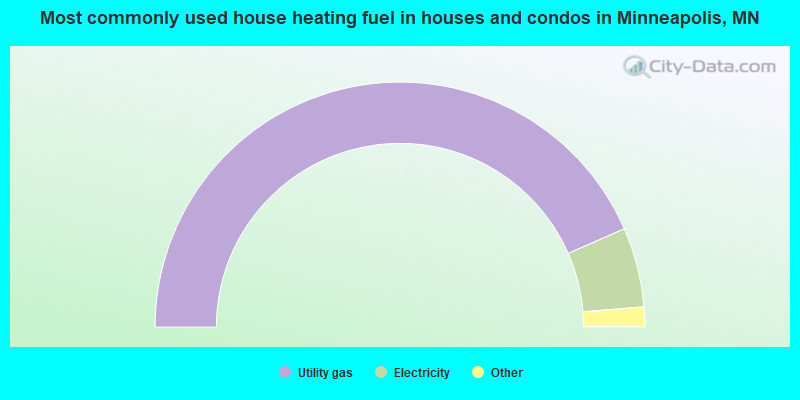
- 89.4%Utility gas
- 7.7%Electricity
- 1.2%Bottled, tank, or LP gas
- 0.9%Other fuel
- 0.4%No fuel used
- 0.2%Fuel oil, kerosene, etc.
- 0.2%Solar energy
- 0.1%Wood
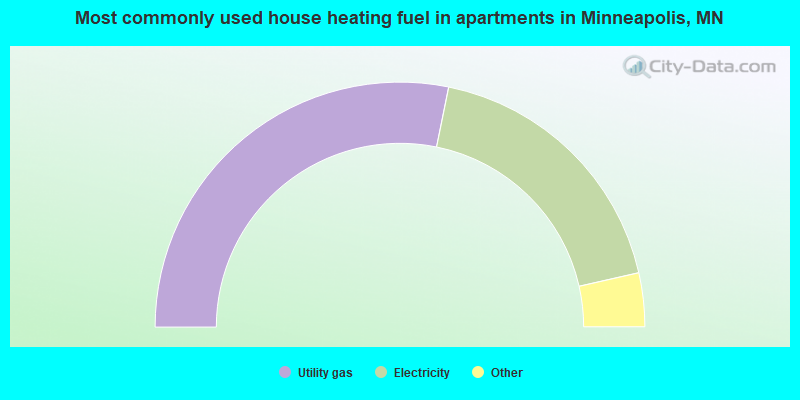
- 56.4%Utility gas
- 36.5%Electricity
- 2.5%Bottled, tank, or LP gas
- 2.4%Other fuel
- 2.0%No fuel used
- 0.1%Fuel oil, kerosene, etc.
Minneapolis compared to Minnesota state average:
- Unemployed percentage significantly below state average.
- Black race population percentage significantly above state average.
- Hispanic race population percentage above state average.
- Median age significantly below state average.
- Foreign-born population percentage above state average.
- Renting percentage above state average.
- Length of stay since moving in below state average.
- Number of rooms per house below state average.
- House age above state average.
- Number of college students above state average.
- Percentage of population with a bachelor's degree or higher above state average.
Minneapolis, MN compared to other similar cities:
Minneapolis on our top lists:
- #7 on the list of "Top 101 cities with the highest number of rapes per 100,000 residents, excludes tourist destinations and others with a lot of outsiders visiting based on city industries data (population 50,000+)"
- #9 on the list of "Top 101 cities with the largest percentage of likely gay men couples (counted as self-reported male-male unmarried-partner households) (population 50,000+)"
- #10 on the list of "Top 101 cities with the largest percentage of likely homosexual households (counted as self-reported same-sex unmarried-partner households) (population 50,000+)"
- #10 on the list of "Top 101 cities with the largest percentage of likely lesbian couples (counted as self-reported female-female unmarried-partner households) (population 50,000+)"
- #10 on the list of "Top 101 cities with the largest temperature differences during a year (population 50,000+)"
- #13 on the list of "Top 101 cities with the most local government spending on current operations of parking facilities per resident (population 10,000+)"
- #16 on the list of "Top 101 cities with the lowest percentage of family households, population 100,000+"
- #18 on the list of "Top 101 cities with the most people taking a bus, a trolley bus, a streetcar, or a trolley car to work (population 5,000+)"
- #20 on the list of "Top 101 cities with the coldest winters (population 50,000+)"
- #21 on the list of "Top 101 cities with the lowest daily low temperatures (population 50,000+)"
- #21 on the list of "Top 101 cities with the most residents born in Other Eastern Africa (population 500+)"
- #31 on the list of "Top 100 cities with old houses but young residents (pop. 50,000+)"
- #32 on the list of "Top 101 cities with the lowest average temperatures (population 50,000+)"
- #33 on the list of "Top 101 cities with the most local government spending on current operations of parks and recreation per resident (population 10,000+)"
- #33 on the list of "Top 101 cities with the highest number of robberies per 100,000 residents, excludes tourist destinations and others with a lot of outsiders visiting based on city industries data (population 50,000+)"
- #34 on the list of "Top 101 cities with largest percentage of males in occupations: arts, design, entertainment, sports, and media occupations (population 50,000+)"
- #41 on the list of "Top 100 cities with oldest houses (pop. 50,000+)"
- #42 on the list of "Top 101 cities with the largest percentage of unmarried partner households (population 50,000+)"
- #46 on the list of "Top 101 cities with largest percentage of females in occupations: arts, design, entertainment, sports, and media occupations (population 50,000+)"
- #46 on the list of "Top 101 cities with the most residents born in Eastern Africa (population 500+)"
- #13 (55455) on the list of "Top 101 zip codes with the smallest percentage of taxpayers using paid preparers for 2012 taxes (pop 1,000+)"
- #16 (55402) on the list of "Top 101 zip codes with the most medium-big companies in 2005 (at least 100 employees)"
- #17 (55455) on the list of "Top 101 zip codes with the largest percentage of returns reporting salary or wage in 2012 (pop 1,000+)"
- #18 (55402) on the list of "Top 101 zip codes with the most big companies in 2005 (at least 1000 employees)"
- #19 (55455) on the list of "Top 101 zip codes with the lowest 2012 average taxable interest for individuals (pop 1,000+)"
- #30 (55402) on the list of "Top 101 zip codes with the most finance and insurance companies in 2005"
- #32 (55401) on the list of "Top 101 zip codes with the most Internet business establishments in 2005"
- #64 (55402) on the list of "Top 101 zip codes with the most offices of lawyers in 2005"
- #76 (55454) on the list of "Top 101 zip codes with the largest percentage of Subsaharan African first ancestries"
- #87 (55417) on the list of "Top 101 zip codes with the largest percentage of Swedish first ancestries (pop 5,000+)"
- #89 (55454) on the list of "Top 101 zip codes with the lowest 2012 average Adjusted Gross Income (AGI) for individuals (pop 5,000+)"
- #101 (55408) on the list of "Top 101 zip codes with the most beauty salons in 2005"
- #101 (55454) on the list of "Top 101 zip codes with the lowest average reported salary/wage in 2012 (pop 5,000+)"
- #4 on the list of "Top 101 counties with the most Mainline Protestant adherents"
- #7 on the list of "Top 101 counties with the highest percentage of residents that exercised in the past month"
- #10 on the list of "Top 101 counties with the most Mainline Protestant congregations"
- #15 on the list of "Top 101 counties with the highest percentage of residents that visited a dentist within the past year"
- #28 on the list of "Top 101 counties with the best general health status score of residents (1-5), 3 years of data"
State forum archive:

|
|
Total of 8242 patent applications in 2008-2024.


