Estimated zip code population in 2022: 25,861 Zip code population in 2010: 22,148 Zip code population in 2000: 25,010
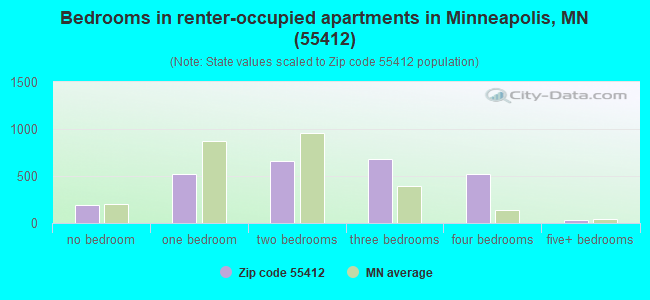
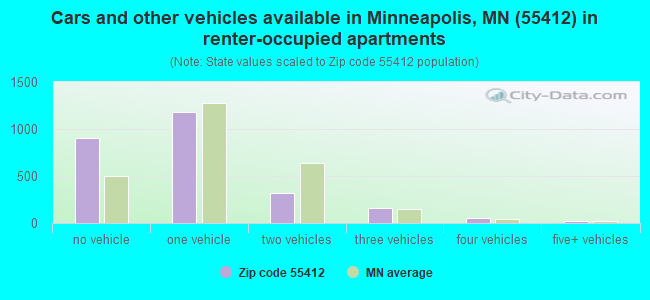
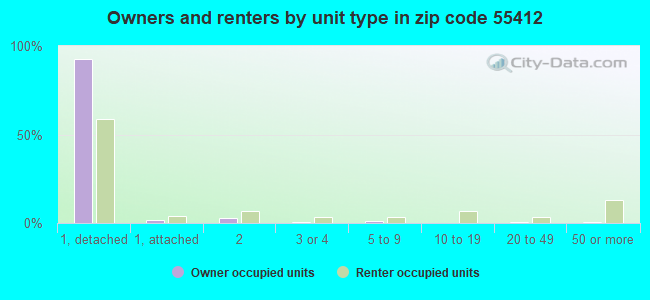
Houses and condos: 9,632 Renter-occupied apartments: 2,624
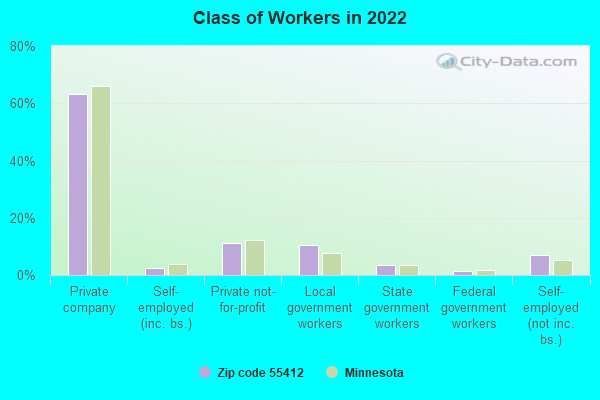
% of renters here:
29%
State:
28%
March 2022 cost of living index in zip code 55412: 114.0 (more than average, U.S. average is 100)
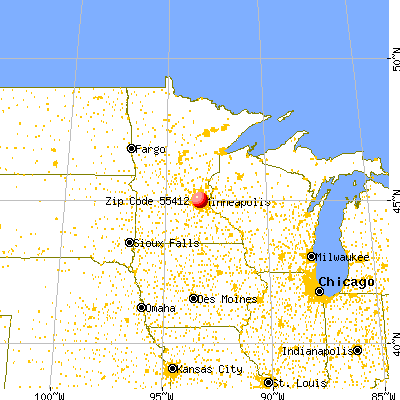
Land area: 3.6 sq. mi. Water area: 0.1 sq. mi.
Population density: 7,120 people per square mile
(high).
OSM Map
General Map
Google Map
MSN Map
OSM Map
General Map
Google Map
MSN Map
OSM Map
General Map
Google Map
MSN Map
OSM Map
General Map
Google Map
MSN Map
Please wait while loading the map...
Real estate property taxes paid for housing units in 2022:
This zip code:
1.0% ($2,322)
Minnesota:
1.0% ($3,087)
Median real estate property taxes paid for housing units with mortgages in 2022: $2,306 (0.9%) Median real estate property taxes paid for housing units with no mortgage in 2022: $2,346 (1.0%)
Averages for the 2020 tax year for zip code 55412, filed in 2021:
Average Adjusted Gross Income (AGI) in 2020: $45,125 (Individual Income Tax Returns)
Here:
$45,125
State:
$82,178
Salary/wage: $41,938 (reported on 88.7% of returns)
Here:
$41,938
State:
$67,438
(% of AGI for various income ranges: 1136.5% for AGIs below $25k, 3956.2% for AGIs $25k-50k, 7256.4% for AGIs $50k-75k, 11058.7% for AGIs $75k-100k, 19727.1% for AGIs $100k-200k, 60510.0% for AGIs over 200k)
Taxable interest for individuals: $546 (reported on 15.4% of returns)
This zip code:
$546
Minnesota:
$1,814
(% of AGI for various income ranges: 5.7% for AGIs below $25k, 5.5% for AGIs $25k-50k, 11.5% for AGIs $50k-75k, 28.0% for AGIs $75k-100k, 47.1% for AGIs $100k-200k, 306.7% for AGIs over 200k)
Ordinary dividends: $1,925 (reported on 9.8% of returns)
Here:
$1,925
State:
$6,928
(% of AGI for various income ranges: 10.1% for AGIs below $25k, 8.7% for AGIs $25k-50k, 21.7% for AGIs $50k-75k, 41.8% for AGIs $75k-100k, 158.6% for AGIs $100k-200k, 1123.3% for AGIs over 200k)
Net capital gain/loss in AGI: +$4,562 (reported on 8.4% of returns)
Here:
+$4,562
State:
+$20,591
(% of AGI for various income ranges: 6.8% for AGIs below $25k, 9.6% for AGIs $25k-50k, 57.0% for AGIs $50k-75k, 81.5% for AGIs $75k-100k, 282.9% for AGIs $100k-200k, 4260.0% for AGIs over 200k)
Profit/loss from business: +$8,781 (reported on 15.3% of returns)
Here:
+$8,781
State:
+$14,342
(% of AGI for various income ranges: 135.6% for AGIs below $25k, 104.8% for AGIs $25k-50k, 206.1% for AGIs $50k-75k, 296.0% for AGIs $75k-100k, 816.9% for AGIs $100k-200k)
Taxable individual retirement arrangement distribution: $12,129 (reported on 4.1% of returns)
55412:
$12,129
Minnesota:
$20,675
(% of AGI for various income ranges: 24.7% for AGIs below $25k, 38.6% for AGIs $25k-50k, 74.4% for AGIs $50k-75k, 171.6% for AGIs $75k-100k, 407.1% for AGIs $100k-200k)
Total itemized deductions: $19,990 (reported on 5.3% of returns)
Here:
$19,990
State:
$33,311
(% of AGI for various income ranges: 11.3% for AGIs below $25k, 60.3% for AGIs $25k-50k, 209.3% for AGIs $50k-75k, 449.6% for AGIs $75k-100k, 862.4% for AGIs $100k-200k, 2113.3% for AGIs over 200k)
Charity contributions: $4,890 (reported on 3.7% of returns)
Here:
$4,890
State:
$11,879
(% of AGI for various income ranges: 9.0% for AGIs $25k-50k, 21.5% for AGIs $50k-75k, 68.7% for AGIs $75k-100k, 196.9% for AGIs $100k-200k, 683.3% for AGIs over 200k)
Taxes paid: $6,830 (reported on 5.2% of returns)
55412:
$6,830
State:
$8,252
(% of AGI for various income ranges: 2.2% for AGIs below $25k, 14.4% for AGIs $25k-50k, 67.5% for AGIs $50k-75k, 176.0% for AGIs $75k-100k, 315.5% for AGIs $100k-200k, 720.0% for AGIs over 200k)
Earned income credit: $2,414 (reported on 23.7% of returns)
Here:
$2,414
State:
$2,055
(% of AGI for various income ranges: 134.2% for AGIs below $25k, 84.7% for AGIs $25k-50k, 1.1% for AGIs $50k-75k)
Percentage of individuals using paid preparers for their 2020 taxes: 92.9%
Here:
93%
State:
94%
(% for various income ranges: 91.3% for AGIs below $25k, 93.4% for AGIs $25k-50k, 93.6% for AGIs $50k-75k, 94.0% for AGIs $75k-100k, 94.7% for AGIs $100k-200k, 100.0% for AGIs over 200k)
Averages for the 2012 tax year for zip code 55412, filed in 2013:
Average Adjusted Gross Income (AGI) in 2012: $35,556 (Individual Income Tax Returns)
Here:
$35,556
State:
$67,192
Salary/wage: $34,257 (reported on 88.7% of returns)
Here:
$34,257
State:
$55,182
(% of AGI for various income ranges: 78.9% for AGIs below $25k, 89.3% for AGIs $25k-50k, 87.1% for AGIs $50k-75k, 86.1% for AGIs $75k-100k, 86.3% for AGIs $100k-200k, 65.1% for AGIs over 200k)
Taxable interest for individuals: $501 (reported on 17.8% of returns)
This zip code:
$501
Minnesota:
$1,664
(% of AGI for various income ranges: 0.4% for AGIs below $25k, 0.2% for AGIs $25k-50k, 0.2% for AGIs $50k-75k, 0.2% for AGIs $75k-100k, 0.3% for AGIs $100k-200k, 0.1% for AGIs over 200k)
Ordinary dividends: $1,630 (reported on 9.7% of returns)
Here:
$1,630
State:
$5,665
(% of AGI for various income ranges: 0.4% for AGIs below $25k, 0.4% for AGIs $25k-50k, 0.4% for AGIs $50k-75k, 0.5% for AGIs $75k-100k, 0.6% for AGIs $100k-200k)
Net capital gain/loss in AGI: +$1,729 (reported on 6.7% of returns)
Here:
+$1,729
State:
+$16,131
(% of AGI for various income ranges: 0.1% for AGIs $25k-50k, 0.2% for AGIs $50k-75k, 0.6% for AGIs $75k-100k, 1.0% for AGIs $100k-200k)
Profit/loss from business: +$8,801 (reported on 14.8% of returns)
Here:
+$8,801
State:
+$12,430
(% of AGI for various income ranges: 11.1% for AGIs below $25k, 2.0% for AGIs $25k-50k, 2.7% for AGIs $50k-75k, 1.2% for AGIs $75k-100k, 3.2% for AGIs $100k-200k)
Taxable individual retirement arrangement distribution: $9,898 (reported on 5.0% of returns)
55412:
$9,898
Minnesota:
$15,212
(% of AGI for various income ranges: 1.5% for AGIs below $25k, 1.1% for AGIs $25k-50k, 1.4% for AGIs $50k-75k, 1.4% for AGIs $75k-100k, 2.1% for AGIs $100k-200k)
Total itemized deductions: $15,109 (23% of AGI, reported on 26.2% of returns)
Here:
$15,109
State:
$24,665
Here:
22.7% of AGI
State:
19.6% of AGI
(% of AGI for various income ranges: 5.9% for AGIs below $25k, 8.5% for AGIs $25k-50k, 13.6% for AGIs $50k-75k, 14.7% for AGIs $75k-100k, 15.3% for AGIs $100k-200k, 11.2% for AGIs over 200k)
Charity contributions: $2,097 (reported on 19.5% of returns)
Here:
$2,097
State:
$3,948
(% of AGI for various income ranges: 0.4% for AGIs below $25k, 0.8% for AGIs $25k-50k, 1.4% for AGIs $50k-75k, 1.8% for AGIs $75k-100k, 1.8% for AGIs $100k-200k, 1.2% for AGIs over 200k)
Taxes paid: $5,308 (reported on 26.1% of returns)
55412:
$5,308
State:
$10,589
(% of AGI for various income ranges: 0.9% for AGIs below $25k, 2.5% for AGIs $25k-50k, 4.6% for AGIs $50k-75k, 5.6% for AGIs $75k-100k, 6.7% for AGIs $100k-200k, 7.4% for AGIs over 200k)
Earned income credit: $2,572 (reported on 32.2% of returns)
Here:
$2,572
State:
$2,037
(% of AGI for various income ranges: 11.5% for AGIs below $25k, 1.4% for AGIs $25k-50k)
Percentage of individuals using paid preparers for their 2012 taxes: 43.7%
Here:
44%
State:
55%
(% for various income ranges: 41.5% for AGIs below $25k, 43.7% for AGIs $25k-50k, 47.7% for AGIs $50k-75k, 45.8% for AGIs $75k-100k, 50.0% for AGIs $100k-200k, 75.0% for AGIs over 200k)
Averages for the 2004 tax year for zip code 55412, filed in 2005:
Average Adjusted Gross Income (AGI) in 2004: $33,266 (Individual Income Tax Returns)
Here:
$33,266
State:
$53,560
Salary/wage: $32,473 (reported on 90.9% of returns)
Here:
$32,473
State:
$46,177
(% of AGI for various income ranges: 97.4% for AGIs below $10k, 84.4% for AGIs $10k-25k, 92.0% for AGIs $25k-50k, 89.7% for AGIs $50k-75k, 87.9% for AGIs $75k-100k, 77.6% for AGIs over 100k)
Taxable interest for individuals: $828 (reported on 27.5% of returns)
This zip code:
$828
Minnesota:
$1,796
(% of AGI for various income ranges: 1.7% for AGIs below $10k, 1.0% for AGIs $10k-25k, 0.5% for AGIs $25k-50k, 0.5% for AGIs $50k-75k, 0.9% for AGIs $75k-100k, 0.8% for AGIs over 100k)
Taxable dividends: $978 (reported on 14.7% of returns)
Here:
$978
State:
$3,096
(% of AGI for various income ranges: 1.0% for AGIs below $10k, 0.5% for AGIs $10k-25k, 0.3% for AGIs $25k-50k, 0.5% for AGIs $50k-75k, 0.5% for AGIs $75k-100k, 0.6% for AGIs over 100k)
Net capital gain/loss: +$2,620 (reported on 9.5% of returns)
Here:
+$2,620
State:
+$10,864
(% of AGI for various income ranges: -0.7% for AGIs below $10k, 0.0% for AGIs $10k-25k, 0.1% for AGIs $25k-50k, 0.3% for AGIs $50k-75k, 0.8% for AGIs $75k-100k, 5.6% for AGIs over 100k)
Profit/loss from business: +$6,379 (reported on 12.5% of returns)
Here:
+$6,379
State:
+$10,442
(% of AGI for various income ranges: 10.3% for AGIs below $10k, 4.5% for AGIs $10k-25k, 1.4% for AGIs $25k-50k, 1.8% for AGIs $50k-75k, 1.9% for AGIs $75k-100k, 3.5% for AGIs over 100k)
IRA payment deduction: $2,300 (reported on 1.8% of returns)
55412:
$2,300
Minnesota:
$2,955
(% of AGI for various income ranges: 0.1% for AGIs $10k-25k, 0.2% for AGIs $25k-50k, 0.1% for AGIs $50k-75k, 0.1% for AGIs $75k-100k)
Self-employed pension: $5,029 (reported on 0.4% of returns)
Here:
$5,029
Minnesota:
$12,099
Total itemized deductions: $13,153 (26% of AGI, reported on 38.4% of returns)
Here:
$13,153
State:
$20,035
Here:
25.6% of AGI
State:
21.3% of AGI
(% of AGI for various income ranges: 11.1% for AGIs below $10k, 9.5% for AGIs $10k-25k, 15.7% for AGIs $25k-50k, 17.0% for AGIs $50k-75k, 16.7% for AGIs $75k-100k, 15.3% for AGIs over 100k)
Charity contributions deductions: $1,809 (3% of AGI, reported on 30.7% of returns)
Here:
$1,809
State:
$3,333
Here:
3.3% of AGI
State:
3.4% of AGI
(% of AGI for various income ranges: 0.9% for AGIs below $10k, 0.9% for AGIs $10k-25k, 1.5% for AGIs $25k-50k, 2.0% for AGIs $50k-75k, 2.3% for AGIs $75k-100k, 2.2% for AGIs over 100k)
Total tax: $3,965 (reported on 70.3% of returns)
55412:
$3,965
State:
$8,485
(% of AGI for various income ranges: 2.4% for AGIs below $10k, 3.7% for AGIs $10k-25k, 6.9% for AGIs $25k-50k, 9.5% for AGIs $50k-75k, 10.7% for AGIs $75k-100k, 16.4% for AGIs over 100k)
Earned income credit: $1,831 (reported on 23.6% of returns)
Here:
$1,831
State:
$1,523
Percentage of individuals using paid preparers for their 2004 taxes: 56.1%
Here:
56%
State:
59%
(% for various income ranges: 57.8% for AGIs below $10k, 62.4% for AGIs $10k-25k, 52.6% for AGIs $25k-50k, 52.2% for AGIs $50k-75k, 54.1% for AGIs $75k-100k, 55.6% for AGIs over 100k)
Likely homosexual households (counted as self-reported same-sex unmarried-partner households)
Lesbian couples: 0.4% of all households
Gay men: 0.3% of all households
Household received Food Stamps/SNAP in the past 12 months: 1,964 Household did not receive Food Stamps/SNAP in the past 12 months: 7,269
Women who had a birth in the past 12 months: 330 (201 now married, 125 unmarried) Women who did not have a birth in the past 12 months: 6,593 (2,242 now married, 4,346 unmarried)
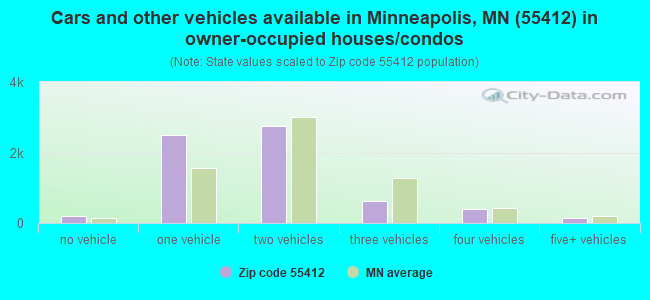
Housing units in zip code 55412 with a mortgage: 5,130 (588 second mortgage, 408 both second mortgage and home equity loan) Houses without a mortgage: 215
Median monthly owner costs for units with a mortgage: $1,466 Median monthly owner costs for units without a mortgage: $606
Residents with income below the poverty level in 2022:
This zip code:
15.0%
Whole state:
9.6%
Residents with income below 50% of the poverty level in 2022:
This zip code:
6.6%
Whole state:
5.2%
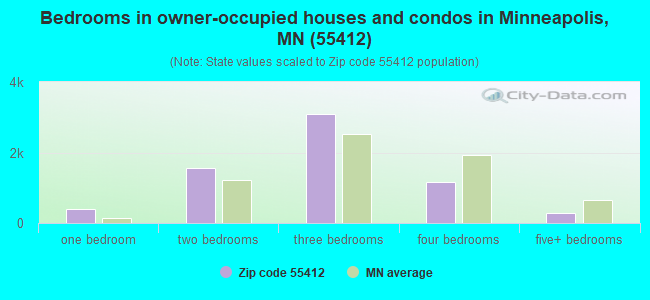
Median number of rooms in houses and condos:
Here:
6.2
State:
7.1
Median number of rooms in apartments:
Here:
5.1
State:
3.8
Notable locations in this zip code not listed on our city pages
Notable locations in zip code 55412: Minneapolis Fire Department Station 14 (A), Webber Park Library (B), Minneapolis Fire Department Station 20 (C). Display/hide their locations on the map
Churches in zip code 55412 include: Victory Lutheran Church (A), United Faith Pentecostal Church (B), United Christian Fellowship Church (C), True Love Church Ministries of Arts (D), Salem Evangelical Lutheran Church (E), Saint Bridgets Church (F), Saint Augustines Catholic Church (G), North United Methodist Church (H), New Life Seventh Day Adventist Church (I). Display/hide their locations on the map
Parks in zip code 55412 include: Folwell Park (1), Perkins Hill Park (2), Porter Field (3), Webber Park (4), Victory Park (5). Display/hide their locations on the map
2,664 married couples with children.
2,799 single-parent households (912 men, 1,887 women).
77.7% of residents of 55412 zip code speak English at home.
9.4% of residents speak Spanish at home (64% very well, 17% well, 15% not well, 3% not at all).
1.3% of residents speak other Indo-European language at home (83% very well, 13% well, 4% not well).
9.8% of residents speak Asian or Pacific Island language at home (55% very well, 20% well, 23% not well, 2% not at all).
0.7% of residents speak other language at home (49% very well, 33% well, 18% not well).
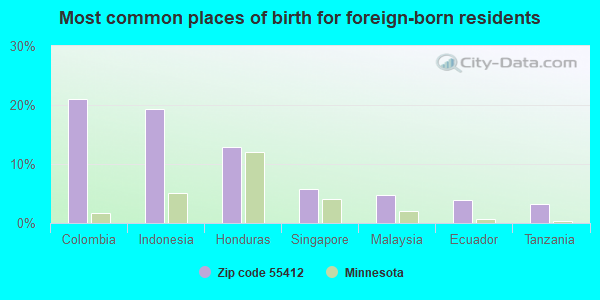
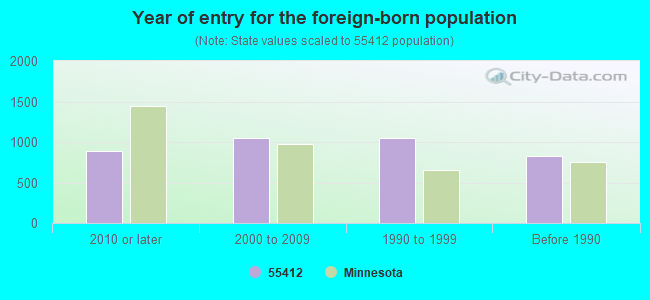
Foreign born population: 3,563 (13.8%) (60.7% of them are naturalized citizens)
Major facilities with environmental interests located in this zip code:
PACKER RIVER TERMINAL INC (3750 WASHINGTON AVE N in MINNEAPOLIS, MN)
AIR SYNTHETIC MINOR (AIRS/AFS) (Integrated Compliance Information System) - ICIS-05-1981-0009, FORMAL ENFORCEMENT ACTION STATE MASTER (Minnesota Pollution Control Agency permits and compilance tracking) - RCRAINFO-MND071768162, HAZARDOUS WASTE PROGRAM, RCRIS-MND071768162, Small Quantity Generators, between 100 kg and 1000 kg of hazardous waste/month (Resource Conservation and Recovery Act (tracking hazardous waste)) - notification Business SIC classification: FLOUR AND OTHER GRAIN MILL PRODUCTS; COAL AND OTHER MINERALS AND ORES; GRAIN AND FIELD BEANS Organizations: MINNEAPOLIS CITY OF (CONTACT/OWNER)
Alternative names: PORT OF MINNEAPOLIS, RIVER SERVICES
NEW LOOK FURNITURE STUDIO (4201 THOMAS AVE N in MINNEAPOLIS, MN)
STATE MASTER (Minnesota Pollution Control Agency permits and compilance tracking) - RCRAINFO-MND982623860, HAZARDOUS WASTE PROGRAM, RCRIS-MND982623860, (Resource Conservation and Recovery Act (tracking hazardous waste)) Organizations: GELFANO CHAROLOTTE (CONTACT/OWNER)
FLAME METALS MINNEAPOLIS PLANT (4056 WASHINGTON AVENUE NORTH in MINNEAPOLIS, MN)
STATE MASTER (Minnesota Pollution Control Agency permits and compilance tracking) - RCRAINFO-MND006248942, SQG, RCRIS-MND006248942, (Resource Conservation and Recovery Act (tracking hazardous waste)) TRI REPORTER (Tracking of toxic chemicals releasing facilities) Business SIC classification: METAL HEAT TREATING Organizations: FLAME METAL CO (CONTACT/OWNER)
ELECTRIC REPAIR AND CONSTRUCTION (4024 WASHINGTON AVE N in MINNEAPOLIS, MN)
STATE MASTER (Minnesota Pollution Control Agency permits and compilance tracking) - RCRAINFO-MN0000116830, CESQG, RCRIS-MN0000116830, (Resource Conservation and Recovery Act (tracking hazardous waste)) Organizations: CDH INC COLE DONALD M (CONTACT/OWNER)
, ELECTRIC REPAIR & CONSTRUCTION (CONTACT/OWNER)
MINNEAPOLIS SCHOOLS HAMILTON (4119 DUPONT AVE N in MINNEAPOLIS, MN)
STATE MASTER (Minnesota Pollution Control Agency permits and compilance tracking) - RCRAINFO-MNR000032995, CESQG, RCRIS-MNR000032995, (Resource Conservation and Recovery Act (tracking hazardous waste)) Business SIC classification: SCHOOLS AND EDUCATIONAL SERVICES Organizations: SPECIL SCHOOL DISTRICT NO 1 (CONTACT/OWNER)
Alternative names: HAMILTON EL.
MINNEAPOLIS SCHOOLS LORING (2600 44TH AVE N in MINNEAPOLIS, MN)
STATE MASTER (Minnesota Pollution Control Agency permits and compilance tracking) - RCRAINFO-MNR000032938, CESQG, RCRIS-MNR000032938, (Resource Conservation and Recovery Act (tracking hazardous waste)) Business SIC classification: SCHOOLS AND EDUCATIONAL SERVICES Organizations: SPECIAL SCHOOL DISTRICT NO 1 (CONTACT/OWNER)
, LORING ELEMENTARY SCHOOL (CONTACT/OWNER)
FORMER QUALITY FORMULATIONS SITE (2416 N 2ND ST in MINNEAPOLIS, MN)
STATE MASTER (Minnesota Pollution Control Agency permits and compilance tracking) - RCRIS-MNS000102848, HAZARDOUS WASTE PROGRAM (Resource Conservation and Recovery Act (tracking hazardous waste)) Organizations: THOMAS PENNAZ (CONTACT/OWNER)
3D ENGINEERING (3915 VINCENT AVE N in MINNEAPOLIS, MN)
STATE MASTER (Minnesota Pollution Control Agency permits and compilance tracking) - RCRAINFO-MN0000931634, CESQG, RCRIS-MN0000931634, (Resource Conservation and Recovery Act (tracking hazardous waste))
ADVANCE RUBBER CO INC (3334 WASHINGTON AVE N in MINNEAPOLIS, MN)
STATE MASTER (Minnesota Pollution Control Agency permits and compilance tracking) - RCRAINFO-MND006249387, SQG, RCRIS-MND006249387, Small Quantity Generators, between 100 kg and 1000 kg of hazardous waste/month (Resource Conservation and Recovery Act (tracking hazardous waste)) - notification Business SIC classification: FABRICATED RUBBER PRODUCTS Business NAICS classification: RUBBER PRODUCT MANUFACTURING FOR MECHANICAL USE. Organizations: MJ BRUDER ESTATE (CONTACT/OWNER)
CHARNLEY STEVE (3701 KNOX AVE N in MINNEAPOLIS, MN)
STATE MASTER (Minnesota Pollution Control Agency permits and compilance tracking) - RCRAINFO-MN0000117010, CESQG, RCRIS-MN0000117010, (Resource Conservation and Recovery Act (tracking hazardous waste))
NORTHSIDE SERVICE CENTER (3201 LYNDALE AVE N in MINNEAPOLIS, MN)
STATE MASTER (Minnesota Pollution Control Agency permits and compilance tracking) - RCRAINFO-MND981537145, HAZARDOUS WASTE PROGRAM, RCRIS-MND981537145, Small Quantity Generators, between 100 kg and 1000 kg of hazardous waste/month (Resource Conservation and Recovery Act (tracking hazardous waste)) - notification Organizations: ALEXANDER JOHN (CONTACT/OWNER)
HOLCIM INC (3939 N 1ST ST in MINNEAPOLIS, MN)
STATE MASTER (Minnesota Pollution Control Agency permits and compilance tracking) - AIRS-2705300896, AIR PROGRAM, RCRAINFO-MND985710789, HAZARDOUS WASTE PROGRAM, AFS-2705300896, AIR SYNTHETIC MINOR, RCRIS-MND985710789, HAZARDOUS WASTE PROGRAM CRITERIA AND HAZARDOUS AIR POLLUTANT INVENTORY (Inventory of air pollution sources) Conditionally Exempt Small Quantity Generators, less than 100 kg/month of hazardous waste (Resource Conservation and Recovery Act (tracking hazardous waste)) - notification Business SIC classification: CONSTRUCTION MATERIALS Business NAICS classification: OTHER CONSTRUCTION MATERIAL MERCHANT WHOLESALERS. Organizations: HOLNAM INC (CONTACT/OWNER)
Alternative names: Holcim US Inc - Minneapolis Terminal, HOLNAM INC DUNDEE DIV, HOLNAM INC - MINNEAPOLIS TERMINAL
MNDOT CAMDEN (3636 WASHINGTON AVE N in MINNEAPOLIS, MN)
AIR MONITORING SITE (Airborne pollution emission tracking) STATE MASTER (Minnesota Pollution Control Agency permits and compilance tracking) - RCRAINFO-MND985746676, HAZARDOUS WASTE PROGRAM, RCRIS-MND985746676, Conditionally Exempt Small Quantity Generators, less than 100 kg/month of hazardous waste (Resource Conservation and Recovery Act (tracking hazardous waste)) - notification Business SIC and NAICS classification: REGULATION AND ADMINISTRATION OF TRANSPORTATION PROGRAMS Organizations: MNDOT METRO DIV (CONTACT/OWNER)
, MNDOT CENTRAL OFFICE (CONTACT/OWNER)
Alternative names: SITE LOCATED LESS THEN 300 FT. FROM INTER. OF 2ND ST AND WASHINGTON
Housing units lacking complete plumbing facilities: 1.0% Housing units lacking complete kitchen facilities: 1.5%
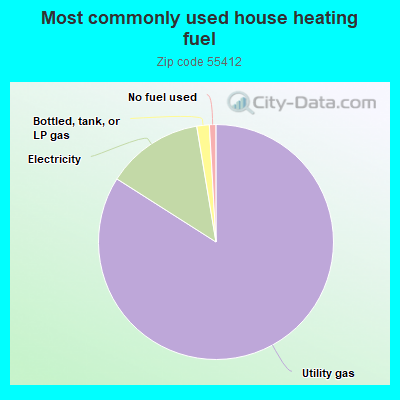
83.7%Utility gas
13.3%Electricity
1.7%Bottled, tank, or LP gas
0.9%No fuel used
Population in 1990: 21,329. Population change in the 1990s: +3,681 (+17.3%).
Place of birth for U.S.-born residents:
This state: 14,907
Northeast: 638
Midwest: 3,971
South: 1,550
West: 906
53% of the 55412 zip code residents lived in the same house 5 years ago. Out of people who lived in different houses, 66% lived in this county. Out of people who lived in different counties, 50% lived in Minnesota.
84% of the 55412 zip code residents lived in the same house 1 year ago. Out of people who lived in different houses, 51% moved from this county. Out of people who lived in different houses, 38% moved from different county within same state. Out of people who lived in different houses, 8% moved from different state. Out of people who lived in different houses, 0% moved from abroad.
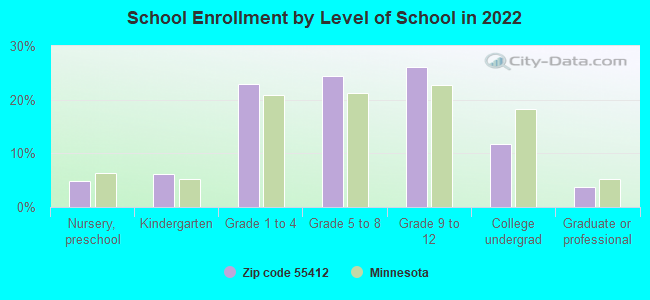
Private vs. public school enrollment:
Students in private schools in grades 1 to 8 (elementary and middle school): 359
Here:
11.1%
Minnesota:
12.9%
Students in private schools in grades 9 to 12 (high school): 71
Here:
4.0%
Minnesota:
8.6%
Students in private undergraduate colleges: 233
Here:
29.0%
Minnesota:
26.2%
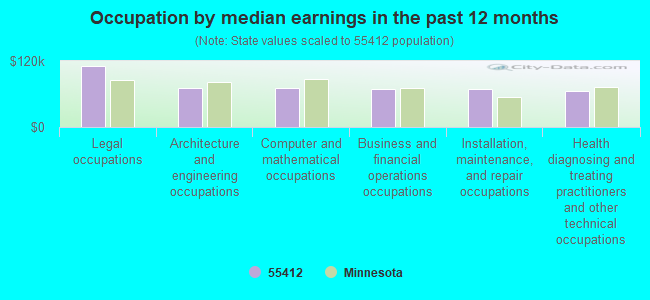
Occupation by median earnings in the past 12 months ($)
110,445Legal occupations
70,608Architecture and engineering occupations
70,361Computer and mathematical occupations
68,794Business and financial operations occupations
68,402Installation, maintenance, and repair occupations
66,016Health diagnosing and treating practitioners and other technical occupations
Companies with federal contracts located in this zip code:
MACHINE SPECIALTIES MFG CO INC (4400 LYNDALE AVE N in MINNEAPOLIS, MN; small business)
$109,423 with U.S. Army Corps of Engineers - civil program financing only for Structural Shapes. Signed on 2001-09-26. Completion date: 2001-11-01.
Top industries in this zip code by the number of employees in 2005:
Health Care and Social Assistance: Vocational Rehabilitation Services (100-249 employees: 1 establishment, 20-49 employees: 1 establishment)
2007 - 2018 National Fire Incident Reporting System (NFIRS) incidents
Based on the data from the years 2007 - 2018 the average number of fires per year is 122. The highest number of fires - 151 took place in 2015, and the least - 102 in 2016. The data has an increasing trend.
When looking into fire subcategories, the most incidents belonged to: Structure Fires (50.9%), and Outside Fires (25.1%).
Fire incident types reported to NFIRS in Zip Code 55412


 Nearest zip codes: 55411, 55430, 55422, 55429, 55405, 55421.


 Based on the data from the years 2007 - 2018 the average number of fires per year is 122. The highest number of fires - 151 took place in 2015, and the least - 102 in 2016. The data has an increasing trend.
 When looking into fire subcategories, the most incidents belonged to: Structure Fires (50.9%), and Outside Fires (25.1%).