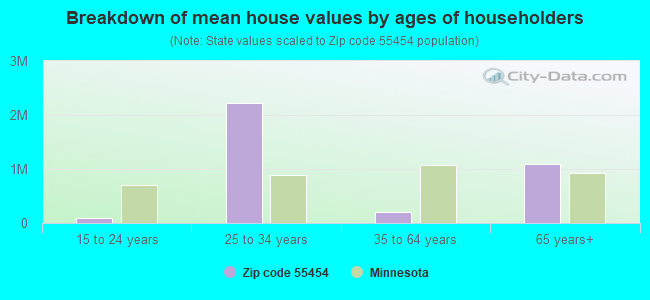
Estimated median house/condo value in 2022: $165,308
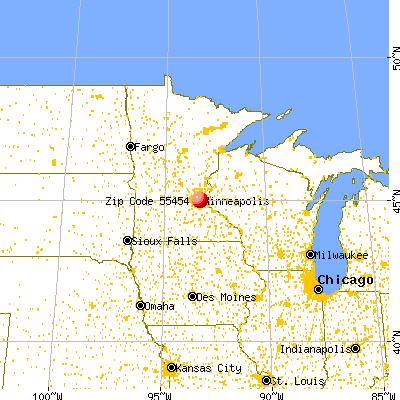
55454:
$165,308
Minnesota:
$314,600
According to our research of Minnesota and other state lists, there was 1 registered sex offender living in 55454 zip code as of April 26, 2024. The ratio of all residents to sex offenders in zip code 55454 is 8,744 to 1. The ratio of registered sex offenders to all residents in this zip code is near the state average.
Median resident age:
This zip code:
24.7 years
Minnesota median age:
39.0 years
Average household size:
This zip code:
2.1 people
Minnesota:
2.4 people
Averages for the 2020 tax year for zip code 55454, filed in 2021:
Average Adjusted Gross Income (AGI) in 2020: $32,506 (Individual Income Tax Returns)
Here:
$32,506
State:
$82,178
Salary/wage: $28,158 (reported on 83.3% of returns)
Here:
$28,158
State:
$67,438
(% of AGI for various income ranges: 1198.9% for AGIs below $25k, 3620.9% for AGIs $25k-50k, 7243.3% for AGIs $50k-75k, 12604.0% for AGIs $75k-100k, 21982.0% for AGIs $100k-200k)
Taxable interest for individuals: $796 (reported on 8.0% of returns)
This zip code:
$796
Minnesota:
$1,814
(% of AGI for various income ranges: 2.2% for AGIs below $25k, 1.1% for AGIs $25k-50k, 5.2% for AGIs $50k-75k, 26.0% for AGIs $75k-100k, 286.0% for AGIs $100k-200k)
Ordinary dividends: $3,095 (reported on 6.4% of returns)
Here:
$3,095
State:
$6,928
(% of AGI for various income ranges: 6.6% for AGIs below $25k, 6.6% for AGIs $25k-50k, 27.1% for AGIs $50k-75k, 200.0% for AGIs $75k-100k, 678.0% for AGIs $100k-200k)
Net capital gain/loss in AGI: +$7,311 (reported on 5.8% of returns)
Here:
+$7,311
State:
+$20,591
(% of AGI for various income ranges: 7.2% for AGIs below $25k, 8.0% for AGIs $25k-50k, 54.3% for AGIs $50k-75k, 136.0% for AGIs $75k-100k, 1988.0% for AGIs $100k-200k)
Profit/loss from business: +$7,746 (reported on 22.8% of returns)
Here:
+$7,746
State:
+$14,342
(% of AGI for various income ranges: 255.9% for AGIs below $25k, 304.7% for AGIs $25k-50k, 101.4% for AGIs $50k-75k, 312.0% for AGIs $75k-100k)
Taxable individual retirement arrangement distribution: $13,140 (reported on 1.6% of returns)
55454:
$13,140
Minnesota:
$20,675
(% of AGI for various income ranges: 15.1% for AGIs below $25k, 233.8% for AGIs $50k-75k)
Total itemized deductions: $27,250 (reported on 1.3% of returns)
Here:
$27,250
State:
$33,311
(% of AGI for various income ranges: 2180.0% for AGIs $75k-100k)
Charity contributions: $13,467 (reported on 1.0% of returns)
Here:
$13,467
State:
$11,879
(% of AGI for various income ranges: 808.0% for AGIs $75k-100k)
Taxes paid: $7,950 (reported on 1.3% of returns)
55454:
$7,950
State:
$8,252
(% of AGI for various income ranges: 12.4% for AGIs below $25k, 364.0% for AGIs $100k-200k)
Earned income credit: $2,550 (reported on 35.6% of returns)
Here:
$2,550
State:
$2,055
(% of AGI for various income ranges: 154.8% for AGIs below $25k, 148.4% for AGIs $25k-50k)
Percentage of individuals using paid preparers for their 2020 taxes: 95.8%
Here:
96%
State:
94%
(% for various income ranges: 95.5% for AGIs below $25k, 97.1% for AGIs $25k-50k, 96.7% for AGIs $50k-75k, 88.9% for AGIs $75k-100k, 90.9% for AGIs $100k-200k)
Averages for the 2012 tax year for zip code 55454, filed in 2013:
Average Adjusted Gross Income (AGI) in 2012: $23,058 (Individual Income Tax Returns)
Here:
$23,058
State:
$67,192
Salary/wage: $21,571 (reported on 87.6% of returns)
Here:
$21,571
State:
$55,182
(% of AGI for various income ranges: 80.2% for AGIs below $25k, 91.5% for AGIs $25k-50k, 103.6% for AGIs $50k-75k, 67.7% for AGIs $100k-200k)
Taxable interest for individuals: $319 (reported on 11.2% of returns)
This zip code:
$319
Minnesota:
$1,664
(% of AGI for various income ranges: 0.1% for AGIs below $25k, 0.1% for AGIs $25k-50k, 0.2% for AGIs $50k-75k, 0.3% for AGIs $100k-200k)
Ordinary dividends: $1,908 (reported on 5.4% of returns)
Here:
$1,908
State:
$5,665
(% of AGI for various income ranges: 0.2% for AGIs below $25k, 0.3% for AGIs $25k-50k, 0.6% for AGIs $50k-75k, 1.3% for AGIs $100k-200k)
Net capital gain/loss in AGI: +$2,025 (reported on 5.0% of returns)
Here:
+$2,025
State:
+$16,131
(% of AGI for various income ranges: 0.3% for AGIs $50k-75k, 2.6% for AGIs $100k-200k)
Profit/loss from business: +$7,868 (reported on 20.7% of returns)
Here:
+$7,868
State:
+$12,430
(% of AGI for various income ranges: 16.6% for AGIs below $25k, 2.9% for AGIs $25k-50k)
Taxable individual retirement arrangement distribution: $10,600 (reported on 1.7% of returns)
55454:
$10,600
Minnesota:
$15,212
Total itemized deductions: $18,133 (22% of AGI, reported on 6.2% of returns)
Here:
$18,133
State:
$24,665
Here:
21.9% of AGI
State:
19.6% of AGI
(% of AGI for various income ranges: 1.5% for AGIs below $25k, 2.0% for AGIs $25k-50k, 12.0% for AGIs $50k-75k, 14.4% for AGIs $100k-200k)
Charity contributions: $3,755 (reported on 4.5% of returns)
Here:
$3,755
State:
$3,948
(% of AGI for various income ranges: 0.6% for AGIs $25k-50k, 1.3% for AGIs $50k-75k, 2.6% for AGIs $100k-200k)
Taxes paid: $7,107 (reported on 6.2% of returns)
55454:
$7,107
State:
$10,589
(% of AGI for various income ranges: 0.4% for AGIs below $25k, 0.5% for AGIs $25k-50k, 4.3% for AGIs $50k-75k, 7.0% for AGIs $100k-200k)
Earned income credit: $2,420 (reported on 49.2% of returns)
Here:
$2,420
State:
$2,037
(% of AGI for various income ranges: 12.2% for AGIs below $25k, 2.1% for AGIs $25k-50k)
Percentage of individuals using paid preparers for their 2012 taxes: 66.1%
Here:
66%
State:
55%
(% for various income ranges: 66.3% for AGIs below $25k, 68.6% for AGIs $25k-50k, 66.7% for AGIs $50k-75k, 60.0% for AGIs $100k-200k)
Averages for the 2004 tax year for zip code 55454, filed in 2005:
Average Adjusted Gross Income (AGI) in 2004: $21,784 (Individual Income Tax Returns)
Here:
$21,784
State:
$53,560
Salary/wage: $19,612 (reported on 89.9% of returns)
Here:
$19,612
State:
$46,177
(% of AGI for various income ranges: 89.9% for AGIs below $10k, 91.2% for AGIs $10k-25k, 95.5% for AGIs $25k-50k, 81.0% for AGIs $50k-75k, 75.5% for AGIs $75k-100k, 33.9% for AGIs over 100k)
Taxable interest for individuals: $1,083 (reported on 13.8% of returns)
This zip code:
$1,083
Minnesota:
$1,796
(% of AGI for various income ranges: 0.6% for AGIs below $10k, 0.3% for AGIs $10k-25k, 0.4% for AGIs $25k-50k, 0.3% for AGIs $50k-75k, 2.2% for AGIs $75k-100k, 1.8% for AGIs over 100k)
Taxable dividends: $2,022 (reported on 7.4% of returns)
Here:
$2,022
State:
$3,096
(% of AGI for various income ranges: 0.9% for AGIs below $10k, 0.4% for AGIs $10k-25k, 0.3% for AGIs $25k-50k, 0.5% for AGIs $50k-75k, 1.2% for AGIs $75k-100k, 1.8% for AGIs over 100k)
Net capital gain/loss: +$5,859 (reported on 6.1% of returns)
Here:
+$5,859
State:
+$10,864
(% of AGI for various income ranges: -0.8% for AGIs below $10k, -0.2% for AGIs $10k-25k, -0.2% for AGIs $25k-50k, -0.3% for AGIs $50k-75k, -0.5% for AGIs $75k-100k, 11.2% for AGIs over 100k)
Profit/loss from business: +$4,525 (reported on 15.9% of returns)
Here:
+$4,525
State:
+$10,442
(% of AGI for various income ranges: 17.8% for AGIs below $10k, 4.8% for AGIs $10k-25k, 1.5% for AGIs $25k-50k, 0.8% for AGIs $50k-75k, -0.4% for AGIs $75k-100k)
IRA payment deduction: $2,160 (reported on 1.0% of returns)
55454:
$2,160
Minnesota:
$2,955
Total itemized deductions: $12,720 (21% of AGI, reported on 8.5% of returns)
Here:
$12,720
State:
$20,035
Here:
21.2% of AGI
State:
21.3% of AGI
(% of AGI for various income ranges: 1.7% for AGIs below $10k, 1.7% for AGIs $10k-25k, 3.5% for AGIs $25k-50k, 10.3% for AGIs $50k-75k, 14.5% for AGIs $75k-100k, 9.1% for AGIs over 100k)
Charity contributions deductions: $3,063 (5% of AGI, reported on 5.8% of returns)
Here:
$3,063
State:
$3,333
Here:
4.7% of AGI
State:
3.4% of AGI
(% of AGI for various income ranges: 0.2% for AGIs $10k-25k, 0.5% for AGIs $25k-50k, 2.0% for AGIs $50k-75k, 3.8% for AGIs $75k-100k, 1.3% for AGIs over 100k)
Total tax: $3,025 (reported on 57.6% of returns)
55454:
$3,025
State:
$8,485
(% of AGI for various income ranges: 3.1% for AGIs below $10k, 3.7% for AGIs $10k-25k, 6.4% for AGIs $25k-50k, 11.1% for AGIs $50k-75k, 12.8% for AGIs $75k-100k, 17.7% for AGIs over 100k)
Earned income credit: $1,730 (reported on 40.7% of returns)
Here:
$1,730
State:
$1,523
Percentage of individuals using paid preparers for their 2004 taxes: 64.9%
Here:
65%
State:
59%
(% for various income ranges: 61.1% for AGIs below $10k, 66.6% for AGIs $10k-25k, 67.7% for AGIs $25k-50k, 64.6% for AGIs $50k-75k, 65.6% for AGIs $75k-100k, 68.8% for AGIs over 100k)
Household received Food Stamps/SNAP in the past 12 months: 1,700 Household did not receive Food Stamps/SNAP in the past 12 months: 2,069
Women who had a birth in the past 12 months: 191 (137 now married, 53 unmarried) Women who did not have a birth in the past 12 months: 2,381 (378 now married, 1,998 unmarried)
Housing units in zip code 55454 with a mortgage: 199 (45 second mortgage, 25 both second mortgage and home equity loan) Median monthly owner costs for units with a mortgage: $1,622 Median monthly owner costs for units without a mortgage: $1,057
Residents with income below the poverty level in 2022:
This zip code:
53.5%
Whole state:
9.6%
Residents with income below 50% of the poverty level in 2022:
This zip code:
32.0%
Whole state:
5.2%
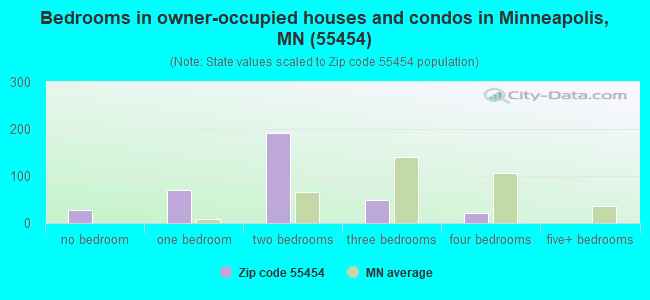
Median number of rooms in houses and condos:
Here:
4.9
State:
7.1
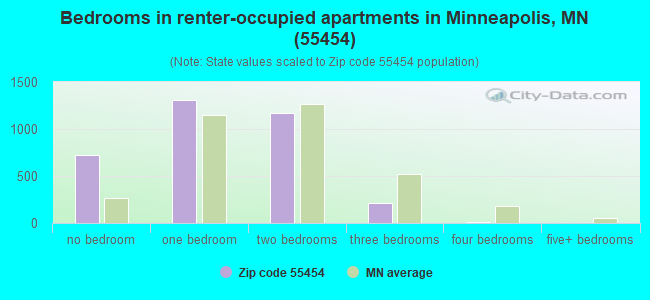
Median number of rooms in apartments:
Here:
2.9
State:
3.8
Notable locations in this zip code not listed on our city pages
765 married couples with children.
1,446 single-parent households (280 men, 1,166 women).
40.7% of residents of 55454 zip code speak English at home.
1.6% of residents speak Spanish at home (73% very well, 27% well).
2.0% of residents speak other Indo-European language at home (63% very well, 37% well).
6.0% of residents speak Asian or Pacific Island language at home (55% very well, 39% well, 6% not well).
53.0% of residents speak other language at home (52% very well, 22% well, 14% not well, 12% not at all).
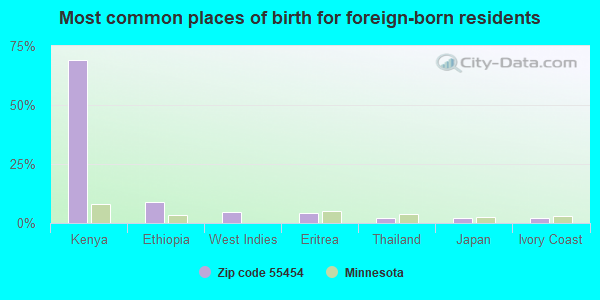
Foreign born population: 4,131 (46.3%) (72.6% of them are naturalized citizens)
Major facilities with environmental interests located in this zip code:
MINNEGASCO (1300 RIVER PARKWAY in MINNEAPOLIS, MN)
STATE MASTER (Minnesota Pollution Control Agency permits and compilance tracking) - PCS-MN0063126, NPDES NON-MAJOR STATE MASTER (Minnesota Pollution Control Agency permits and compilance tracking) - RCRAINFO-MNR000059873, NOT IN A UNIVERSE, RCRIS-MNR000059873, CESQG National Pollutant Discharge Elimination System NON-MAJOR (Tracking pollutant discharge elimination systems) - permit HAZARDOUS WASTE BIENNIAL REPORTER (Resource Conservation and Recovery Act (tracking hazardous waste)) (Resource Conservation and Recovery Act (tracking hazardous waste)) Conditionally Exempt Small Quantity Generators, less than 100 kg/month of hazardous waste (Resource Conservation and Recovery Act (tracking hazardous waste)) - notification Business SIC and NAICS classification: NATURAL GAS DISTRIBUTION Organizations: CENTERPOINT ENERGY (CONTACT/OWNER)
, CENTERPOINT ENERGY MINNEGASCO (CONTACT/OWNER)
Alternative names: MINNEGASCO-DIV OF NORAM ENERGY, MINNEGASCO FORMER GAS WORKS, MINNEGASCO GW TREATMENT FACILITY, MINNEGASCO GWTF, RELIANT ENERGY MINNEGASCO GWTF
FREEWHEEL BICYCLE COOP INC (1812 S 6TH ST in MINNEAPOLIS, MN)
STATE MASTER (Minnesota Pollution Control Agency permits and compilance tracking) - RCRAINFO-MND071491500, CESQG, RCRIS-MND071491500, (Resource Conservation and Recovery Act (tracking hazardous waste)) Organizations: KEVIN ISHANG (CONTACT/OWNER)
, FREEWHEEL INC (CONTACT/OWNER)
Alternative names: FREEWHEEL INC
NRG - RIVERSIDE PLANT (2450 RIVERSIDE AVE in MINNEAPOLIS, MN)
AIR MINOR (AIRS/AFS) STATE MASTER (Minnesota Pollution Control Agency permits and compilance tracking) - AIRS-2705300790, AIR PROGRAM, AFS-2705300790, AIR SYNTHETIC MINOR CRITERIA AND HAZARDOUS AIR POLLUTANT INVENTORY (Inventory of air pollution sources) Business SIC and NAICS classification: STEAM AND AIR-CONDITIONING SUPPLY Organizations: NRG-NSP ENERGY INC (CONTACT/OWNER)
Alternative names: MPLS ENERGY CENTER
FAIRVIEW UNIVERSITY MEDICAL CENTER (2450 RIVERSIDE AVE in MINNEAPOLIS, MN)
AIR MINOR (AIRS/AFS) STATE MASTER (Minnesota Pollution Control Agency permits and compilance tracking) - AIRS-2705300042, AIR PROGRAM, AFS-2705300042, AIR SYNTHETIC MINOR CRITERIA AND HAZARDOUS AIR POLLUTANT INVENTORY (Inventory of air pollution sources) Business SIC classification: GENERAL MEDICAL AND SURGICAL HOSPITALS
AUTOMOTIVE AND CARBURETOR SERVICE (1919 RIVERSIDE AVE S in MINNEAPOLIS, MN)
STATE MASTER (Minnesota Pollution Control Agency permits and compilance tracking) - RCRAINFO-MND981791411, HAZARDOUS WASTE PROGRAM, RCRIS-MND981791411, Small Quantity Generators, between 100 kg and 1000 kg of hazardous waste/month (Resource Conservation and Recovery Act (tracking hazardous waste)) - notification Business SIC classification: GENERAL AUTOMOTIVE REPAIR SHOPS Business NAICS classification: GENERAL AUTOMOTIVE REPAIR. Organizations: AUTOMOTIVE & CARBURETOR SERVICE (CONTACT/OWNER)
MINNESOTA EAR HEAD& NECK CLINIC (701 25TH AVE S in MINNEAPOLIS, MN)
STATE MASTER (Minnesota Pollution Control Agency permits and compilance tracking) - RCRAINFO-MND982210940, HAZARDOUS WASTE PROGRAM, RCRIS-MND982210940, Small Quantity Generators, between 100 kg and 1000 kg of hazardous waste/month (Resource Conservation and Recovery Act (tracking hazardous waste)) - notification Business SIC classification: HEALTH AND ALLIED SERVICES Organizations: PAPARELLA MICHAEL MD (CONTACT/OWNER)
, MINNESOTA EAR HEAD & NECK CLINIC (CONTACT/OWNER)
ORTHOPAEDIC CONSULTANTS PA (606 24TH AVE S STE 119 in MINNEAPOLIS, MN)
STATE MASTER (Minnesota Pollution Control Agency permits and compilance tracking) - RCRAINFO-MN0000337881, CESQG, RCRIS-MN0000337881, (Resource Conservation and Recovery Act (tracking hazardous waste))
AGFA CORP (1500 WASHINGTON AVE S in MINNEAPOLIS, MN)
STATE MASTER (Minnesota Pollution Control Agency permits and compilance tracking) - RCRIS-MNS000106930, CESQG Conditionally Exempt Small Quantity Generators, less than 100 kg/month of hazardous waste (Resource Conservation and Recovery Act (tracking hazardous waste)) Business SIC classification: PHOTOGRAPHIC EQUIPMENT AND SUPPLIES; HOTELS AND MOTELS Business NAICS classification: PHOTOGRAPHIC EQUIPMENT AND SUPPLIES MERCHANT WHOLESALERS.; HOTELS (EXCEPT CASINO HOTELS) AND MOTELS. Organizations: HOLIDAY INN METRODOME (CONTACT/OWNER)
BETHESDA REHABILITATION HOSPITAL (2512 7TH ST S in MINNEAPOLIS, MN)
STATE MASTER (Minnesota Pollution Control Agency permits and compilance tracking) - RCRIS-MNS000109744, CESQG Conditionally Exempt Small Quantity Generators, less than 100 kg/month of hazardous waste (Resource Conservation and Recovery Act (tracking hazardous waste)) Organizations: FAIRVIEW UNIVERSITY MEDICAL CENTER (CONTACT/OWNER)
, FAIRVIEW-UNIVERSITY MEDICAL CENTER (CONTACT/OWNER)
FOY PATRICK T DDS (606 24TH AVE S STE 806 in MINNEAPOLIS, MN)
STATE MASTER (Minnesota Pollution Control Agency permits and compilance tracking) - RCRAINFO-MNR000008391, CESQG, RCRIS-MNR000008391, Conditionally Exempt Small Quantity Generators, less than 100 kg/month of hazardous waste (Resource Conservation and Recovery Act (tracking hazardous waste)) - notification Business SIC classification: HEALTH AND ALLIED SERVICES Organizations: PATRICK J FOY DDS (CONTACT/OWNER)
Alternative names: FOY PATRICK J DDS
AUGSBURG COLLEGE (2211 RIVERSIDE AVE S in MINNEAPOLIS, MN)
Conditionally Exempt Small Quantity Generators, less than 100 kg/month of hazardous waste (Resource Conservation and Recovery Act (tracking hazardous waste)) - notification
GROUP HEALTH INC (606 24TH AVE S in MINNEAPOLIS, MN)
Small Quantity Generators, between 100 kg and 1000 kg of hazardous waste/month (Resource Conservation and Recovery Act (tracking hazardous waste)) - notification Organizations: ACTON CONSTRUCTION (CONTACT/OWNER)
HEALTH PARTNERS RIVERSIDE (2220 RIVERSIDE AVE in MINNEAPOLIS, MN)
(Resource Conservation and Recovery Act (tracking hazardous waste))
Housing units lacking complete kitchen facilities: 1.1%
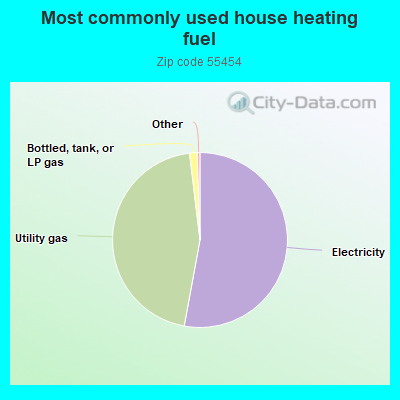
52.9%Electricity
45.2%Utility gas
1.4%Bottled, tank, or LP gas
Population in 1990: 8,815.
Place of birth for U.S.-born residents:
This state: 3,456
Northeast: 147
Midwest: 908
South: 299
West: 123
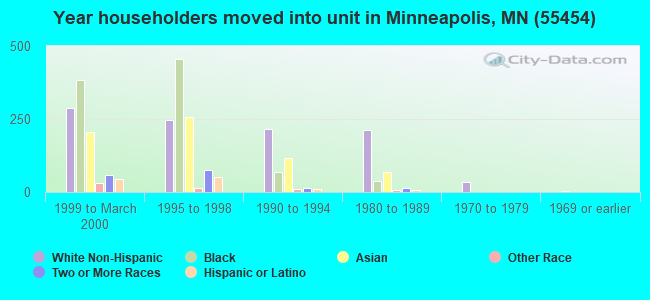
38% of the 55454 zip code residents lived in the same house 5 years ago. Out of people who lived in different houses, 38% lived in this county. Out of people who lived in different counties, 50% lived in Minnesota.
81% of the 55454 zip code residents lived in the same house 1 year ago. Out of people who lived in different houses, 57% moved from this county. Out of people who lived in different houses, 11% moved from different county within same state. Out of people who lived in different houses, 16% moved from different state. Out of people who lived in different houses, 13% moved from abroad.
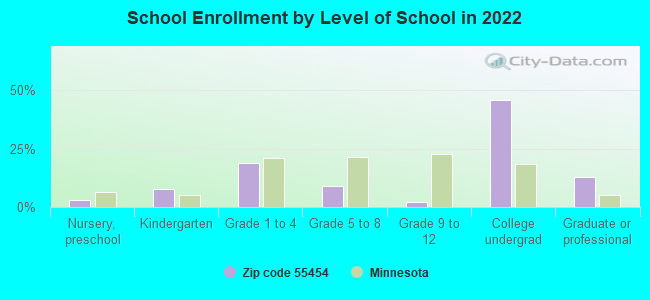
Private vs. public school enrollment:
Students in private schools in grades 1 to 8 (elementary and middle school):
Here:
0.0%
Minnesota:
12.9%
Students in private schools in grades 9 to 12 (high school): 3
Here:
4.0%
Minnesota:
8.6%
Students in private undergraduate colleges: 730
Here:
42.6%
Minnesota:
26.2%
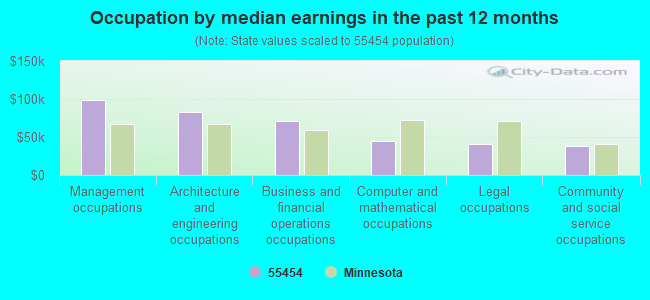
Occupation by median earnings in the past 12 months ($)
98,401Management occupations
82,274Architecture and engineering occupations
70,745Business and financial operations occupations
45,129Computer and mathematical occupations
41,384Legal occupations
38,239Community and social service occupations
Top industries in this zip code by the number of employees in 2005:
Educational Services: Colleges, Universities, and Professional Schools (over 1000 employees: 1 establishment, 250-499 employees: 1 establishment)
Management of Companies and Enterprises: Corporate, Subsidiary, and Regional Managing Offices (over 1000: 1, 20-49: 1, 10-19: 1, 1-4: 1)
Health Care and Social Assistance: General Medical and Surgical Hospitals (over 1000: 1)
Health Care and Social Assistance: Offices of Physical, Occupational and Speech Therapists, and Audiologists (250-499: 1, 10-19: 1, 5-9: 1, 1-4: 1)
Health Care and Social Assistance: Home Health Care Services (100-249: 1, 50-99: 1, 20-49: 1, 10-19: 1, 5-9: 1)
Health Care and Social Assistance: Offices of Physicians (except Mental Health Specialists) (50-99: 2, 20-49: 2, 10-19: 4, 1-4: 4)
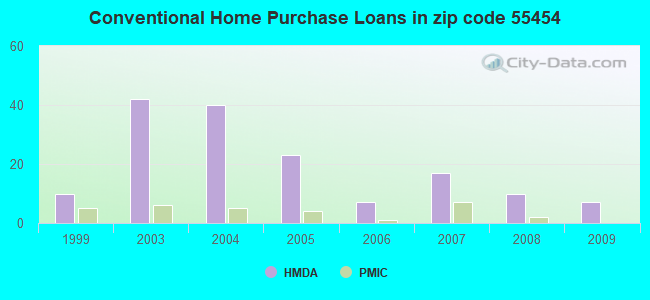
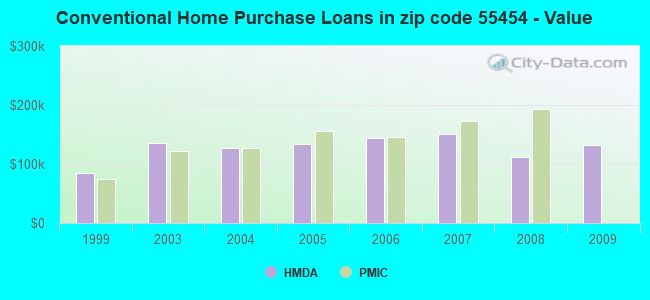
Detailed PMIC statistics for the following Tracts:1048.00
2007 - 2018 National Fire Incident Reporting System (NFIRS) incidents
According to the data from the years 2007 - 2018 the average number of fire incidents per year is 22. The highest number of fires - 32 took place in 2008, and the least - 14 in 2016. The data has a dropping trend.
When looking into fire subcategories, the most incidents belonged to: Structure Fires (57.5%), and Outside Fires (24.1%).
Fire incident types reported to NFIRS in Zip Code 55454


 Nearest zip codes: 55455, 55414, 55415, 55404, 55406, 55413.


 According to the data from the years 2007 - 2018 the average number of fire incidents per year is 22. The highest number of fires - 32 took place in 2008, and the least - 14 in 2016. The data has a dropping trend.
 When looking into fire subcategories, the most incidents belonged to: Structure Fires (57.5%), and Outside Fires (24.1%).