Estimated zip code population in 2022: 32,436 Zip code population in 2010: 29,981 Zip code population in 2000: 30,564
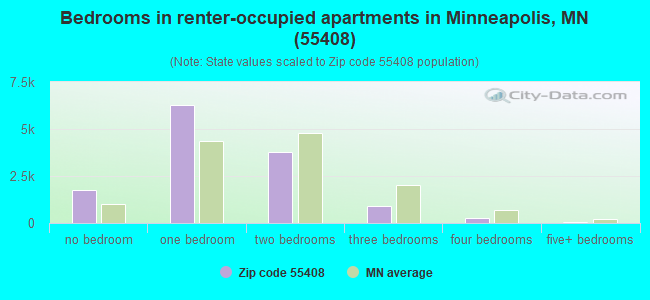
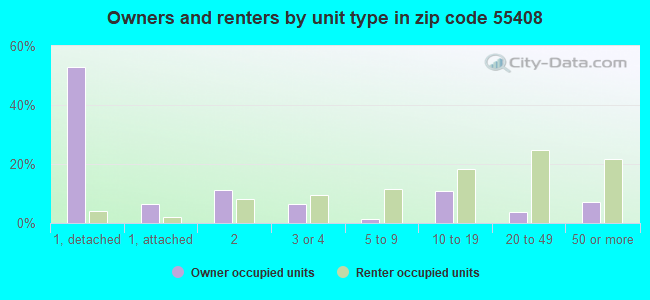
Houses and condos: 17,908 Renter-occupied apartments: 12,930
% of renters here:
75%
State:
28%
March 2022 cost of living index in zip code 55408: 116.3 (more than average, U.S. average is 100)
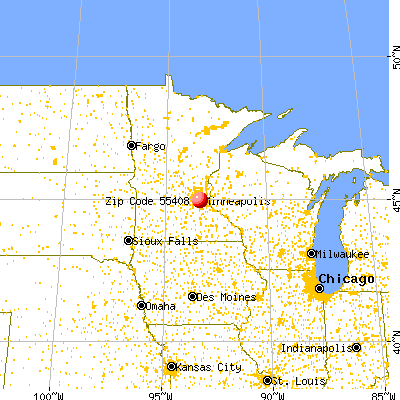
Land area: 2.7 sq. mi. Water area: 0.5 sq. mi.
Population density: 11,935 people per square mile
(high).
OSM Map
General Map
Google Map
MSN Map
OSM Map
General Map
Google Map
MSN Map
OSM Map
General Map
Google Map
MSN Map
OSM Map
General Map
Google Map
MSN Map
Please wait while loading the map...
Real estate property taxes paid for housing units in 2022:
This zip code:
1.2% ($4,817)
Minnesota:
1.0% ($3,087)
Median real estate property taxes paid for housing units with mortgages in 2022: $4,807 (1.1%) Median real estate property taxes paid for housing units with no mortgage in 2022: $4,816 (1.3%)
Averages for the 2020 tax year for zip code 55408, filed in 2021:
Average Adjusted Gross Income (AGI) in 2020: $60,756 (Individual Income Tax Returns)
Here:
$60,756
State:
$82,178
Salary/wage: $51,635 (reported on 88.7% of returns)
Here:
$51,635
State:
$67,438
(% of AGI for various income ranges: 1307.7% for AGIs below $25k, 3942.8% for AGIs $25k-50k, 7218.3% for AGIs $50k-75k, 10818.9% for AGIs $75k-100k, 19659.7% for AGIs $100k-200k, 91684.2% for AGIs over 200k)
Taxable interest for individuals: $1,382 (reported on 20.8% of returns)
This zip code:
$1,382
Minnesota:
$1,814
(% of AGI for various income ranges: 5.3% for AGIs below $25k, 6.1% for AGIs $25k-50k, 16.6% for AGIs $50k-75k, 40.2% for AGIs $75k-100k, 76.6% for AGIs $100k-200k, 1773.7% for AGIs over 200k)
Ordinary dividends: $6,378 (reported on 18.8% of returns)
Here:
$6,378
State:
$6,928
(% of AGI for various income ranges: 20.1% for AGIs below $25k, 21.7% for AGIs $25k-50k, 68.1% for AGIs $50k-75k, 138.6% for AGIs $75k-100k, 523.3% for AGIs $100k-200k, 6813.7% for AGIs over 200k)
Net capital gain/loss in AGI: +$26,514 (reported on 17.7% of returns)
Here:
+$26,514
State:
+$20,591
(% of AGI for various income ranges: 11.6% for AGIs below $25k, 29.1% for AGIs $25k-50k, 74.8% for AGIs $50k-75k, 183.1% for AGIs $75k-100k, 1080.3% for AGIs $100k-200k, 37554.7% for AGIs over 200k)
Profit/loss from business: +$12,741 (reported on 17.6% of returns)
Here:
+$12,741
State:
+$14,342
(% of AGI for various income ranges: 190.4% for AGIs below $25k, 185.7% for AGIs $25k-50k, 274.6% for AGIs $50k-75k, 462.6% for AGIs $75k-100k, 831.4% for AGIs $100k-200k, 3804.2% for AGIs over 200k)
Taxable individual retirement arrangement distribution: $20,590 (reported on 3.9% of returns)
55408:
$20,590
Minnesota:
$20,675
(% of AGI for various income ranges: 21.8% for AGIs below $25k, 38.5% for AGIs $25k-50k, 65.5% for AGIs $50k-75k, 193.9% for AGIs $75k-100k, 552.8% for AGIs $100k-200k, 2151.6% for AGIs over 200k)
Self-employed (Keogh) retirement plans: $16,862 (reported on 0.7% of returns)
55408:
$16,862
Minnesota:
$23,059
(% of AGI for various income ranges: 16.1% for AGIs $50k-75k, 60.8% for AGIs $100k-200k, 703.2% for AGIs over 200k)
Total itemized deductions: $32,034 (reported on 5.9% of returns)
Here:
$32,034
State:
$33,311
(% of AGI for various income ranges: 23.2% for AGIs below $25k, 40.5% for AGIs $25k-50k, 131.1% for AGIs $50k-75k, 424.6% for AGIs $75k-100k, 1040.6% for AGIs $100k-200k, 8600.0% for AGIs over 200k)
Charity contributions: $12,833 (reported on 4.7% of returns)
Here:
$12,833
State:
$11,879
(% of AGI for various income ranges: 1.1% for AGIs below $25k, 5.6% for AGIs $25k-50k, 17.9% for AGIs $50k-75k, 46.8% for AGIs $75k-100k, 187.0% for AGIs $100k-200k, 4360.0% for AGIs over 200k)
Taxes paid: $8,665 (reported on 5.8% of returns)
55408:
$8,665
State:
$8,252
(% of AGI for various income ranges: 4.5% for AGIs below $25k, 9.7% for AGIs $25k-50k, 37.1% for AGIs $50k-75k, 171.7% for AGIs $75k-100k, 404.9% for AGIs $100k-200k, 1546.8% for AGIs over 200k)
Earned income credit: $2,042 (reported on 12.8% of returns)
Here:
$2,042
State:
$2,055
(% of AGI for various income ranges: 76.9% for AGIs below $25k, 34.1% for AGIs $25k-50k, 1.0% for AGIs $50k-75k)
Percentage of individuals using paid preparers for their 2020 taxes: 94.1%
Here:
94%
State:
94%
(% for various income ranges: 92.4% for AGIs below $25k, 94.7% for AGIs $25k-50k, 95.3% for AGIs $50k-75k, 94.8% for AGIs $75k-100k, 93.8% for AGIs $100k-200k, 96.9% for AGIs over 200k)
Averages for the 2012 tax year for zip code 55408, filed in 2013:
Average Adjusted Gross Income (AGI) in 2012: $49,661 (Individual Income Tax Returns)
Here:
$49,661
State:
$67,192
Salary/wage: $44,109 (reported on 90.7% of returns)
Here:
$44,109
State:
$55,182
(% of AGI for various income ranges: 89.3% for AGIs below $25k, 92.6% for AGIs $25k-50k, 89.4% for AGIs $50k-75k, 84.2% for AGIs $75k-100k, 80.0% for AGIs $100k-200k, 58.7% for AGIs over 200k)
Taxable interest for individuals: $1,253 (reported on 22.8% of returns)
This zip code:
$1,253
Minnesota:
$1,664
(% of AGI for various income ranges: 0.4% for AGIs below $25k, 0.2% for AGIs $25k-50k, 0.3% for AGIs $50k-75k, 0.4% for AGIs $75k-100k, 0.6% for AGIs $100k-200k, 1.2% for AGIs over 200k)
Ordinary dividends: $4,965 (reported on 16.0% of returns)
Here:
$4,965
State:
$5,665
(% of AGI for various income ranges: 0.8% for AGIs below $25k, 0.5% for AGIs $25k-50k, 0.5% for AGIs $50k-75k, 1.3% for AGIs $75k-100k, 2.0% for AGIs $100k-200k, 3.5% for AGIs over 200k)
Net capital gain/loss in AGI: +$18,056 (reported on 12.9% of returns)
Here:
+$18,056
State:
+$16,131
(% of AGI for various income ranges: 0.1% for AGIs below $25k, 0.3% for AGIs $25k-50k, 0.4% for AGIs $50k-75k, 1.2% for AGIs $75k-100k, 1.9% for AGIs $100k-200k, 16.9% for AGIs over 200k)
Profit/loss from business: +$13,002 (reported on 15.6% of returns)
Here:
+$13,002
State:
+$12,430
(% of AGI for various income ranges: 5.7% for AGIs below $25k, 3.4% for AGIs $25k-50k, 3.5% for AGIs $50k-75k, 4.4% for AGIs $75k-100k, 5.2% for AGIs $100k-200k, 3.5% for AGIs over 200k)
Taxable individual retirement arrangement distribution: $15,168 (reported on 4.3% of returns)
55408:
$15,168
Minnesota:
$15,212
(% of AGI for various income ranges: 1.2% for AGIs below $25k, 0.7% for AGIs $25k-50k, 1.1% for AGIs $50k-75k, 2.0% for AGIs $75k-100k, 2.3% for AGIs $100k-200k, 1.1% for AGIs over 200k)
Self-employment retirement plans: $16,206 (reported on 0.9% of returns)
55408:
$16,206
Minnesota:
$17,874
(% of AGI for various income ranges: 0.1% for AGIs below $25k, 0.2% for AGIs $50k-75k, 0.4% for AGIs $100k-200k, 0.8% for AGIs over 200k)
Total itemized deductions: $23,809 (18% of AGI, reported on 19.5% of returns)
Here:
$23,809
State:
$24,665
Here:
17.8% of AGI
State:
19.6% of AGI
(% of AGI for various income ranges: 4.0% for AGIs below $25k, 3.5% for AGIs $25k-50k, 7.6% for AGIs $50k-75k, 12.4% for AGIs $75k-100k, 15.1% for AGIs $100k-200k, 13.4% for AGIs over 200k)
Charity contributions: $3,239 (reported on 15.1% of returns)
Here:
$3,239
State:
$3,948
(% of AGI for various income ranges: 0.2% for AGIs below $25k, 0.3% for AGIs $25k-50k, 0.7% for AGIs $50k-75k, 1.1% for AGIs $75k-100k, 1.5% for AGIs $100k-200k, 1.8% for AGIs over 200k)
Taxes paid: $11,995 (reported on 19.4% of returns)
55408:
$11,995
State:
$10,589
(% of AGI for various income ranges: 0.9% for AGIs below $25k, 1.2% for AGIs $25k-50k, 3.0% for AGIs $50k-75k, 5.6% for AGIs $75k-100k, 7.9% for AGIs $100k-200k, 8.3% for AGIs over 200k)
Earned income credit: $1,985 (reported on 15.6% of returns)
Here:
$1,985
State:
$2,037
(% of AGI for various income ranges: 4.6% for AGIs below $25k, 0.4% for AGIs $25k-50k)
Percentage of individuals using paid preparers for their 2012 taxes: 43.5%
Here:
43%
State:
55%
(% for various income ranges: 45.6% for AGIs below $25k, 37.1% for AGIs $25k-50k, 38.9% for AGIs $50k-75k, 45.6% for AGIs $75k-100k, 58.7% for AGIs $100k-200k, 74.4% for AGIs over 200k)
Averages for the 2004 tax year for zip code 55408, filed in 2005:
Average Adjusted Gross Income (AGI) in 2004: $37,037 (Individual Income Tax Returns)
Here:
$37,037
State:
$53,560
Salary/wage: $33,846 (reported on 90.3% of returns)
Here:
$33,846
State:
$46,177
(% of AGI for various income ranges: 118.5% for AGIs below $10k, 89.5% for AGIs $10k-25k, 92.9% for AGIs $25k-50k, 84.2% for AGIs $50k-75k, 82.3% for AGIs $75k-100k, 65.1% for AGIs over 100k)
Taxable interest for individuals: $1,354 (reported on 27.2% of returns)
This zip code:
$1,354
Minnesota:
$1,796
(% of AGI for various income ranges: 2.1% for AGIs below $10k, 0.7% for AGIs $10k-25k, 0.7% for AGIs $25k-50k, 1.0% for AGIs $50k-75k, 1.0% for AGIs $75k-100k, 1.3% for AGIs over 100k)
Taxable dividends: $2,757 (reported on 18.6% of returns)
Here:
$2,757
State:
$3,096
(% of AGI for various income ranges: 2.7% for AGIs below $10k, 0.6% for AGIs $10k-25k, 0.6% for AGIs $25k-50k, 1.2% for AGIs $50k-75k, 1.6% for AGIs $75k-100k, 2.5% for AGIs over 100k)
Net capital gain/loss: +$8,883 (reported on 14.1% of returns)
Here:
+$8,883
State:
+$10,864
(% of AGI for various income ranges: -0.4% for AGIs below $10k, 0.4% for AGIs $10k-25k, 0.2% for AGIs $25k-50k, 1.3% for AGIs $50k-75k, 2.0% for AGIs $75k-100k, 9.8% for AGIs over 100k)
Profit/loss from business: +$11,644 (reported on 14.4% of returns)
Here:
+$11,644
State:
+$10,442
(% of AGI for various income ranges: 9.2% for AGIs below $10k, 5.6% for AGIs $10k-25k, 2.6% for AGIs $25k-50k, 5.5% for AGIs $50k-75k, 3.8% for AGIs $75k-100k, 5.4% for AGIs over 100k)
IRA payment deduction: $2,284 (reported on 1.9% of returns)
55408:
$2,284
Minnesota:
$2,955
(% of AGI for various income ranges: 0.3% for AGIs below $10k, 0.2% for AGIs $10k-25k, 0.2% for AGIs $25k-50k, 0.1% for AGIs $50k-75k, 0.0% for AGIs over 100k)
Self-employed pension: $13,264 (reported on 1.1% of returns)
Here:
$13,264
Minnesota:
$12,099
(% of AGI for various income ranges: 0.1% for AGIs $10k-25k, 0.1% for AGIs $25k-50k, 0.3% for AGIs $50k-75k, 0.2% for AGIs $75k-100k, 0.9% for AGIs over 100k)
Total itemized deductions: $18,399 (21% of AGI, reported on 20.8% of returns)
Here:
$18,399
State:
$20,035
Here:
20.7% of AGI
State:
21.3% of AGI
(% of AGI for various income ranges: 8.2% for AGIs below $10k, 4.7% for AGIs $10k-25k, 6.0% for AGIs $25k-50k, 12.3% for AGIs $50k-75k, 16.3% for AGIs $75k-100k, 15.1% for AGIs over 100k)
Charity contributions deductions: $2,821 (3% of AGI, reported on 17.4% of returns)
Here:
$2,821
State:
$3,333
Here:
2.9% of AGI
State:
3.4% of AGI
(% of AGI for various income ranges: 0.5% for AGIs below $10k, 0.4% for AGIs $10k-25k, 0.6% for AGIs $25k-50k, 1.3% for AGIs $50k-75k, 1.7% for AGIs $75k-100k, 2.4% for AGIs over 100k)
Total tax: $6,029 (reported on 77.9% of returns)
55408:
$6,029
State:
$8,485
(% of AGI for various income ranges: 3.2% for AGIs below $10k, 5.2% for AGIs $10k-25k, 9.2% for AGIs $25k-50k, 12.9% for AGIs $50k-75k, 13.1% for AGIs $75k-100k, 20.4% for AGIs over 100k)
Earned income credit: $1,397 (reported on 15.8% of returns)
Here:
$1,397
State:
$1,523
Percentage of individuals using paid preparers for their 2004 taxes: 47.5%
Here:
47%
State:
59%
(% for various income ranges: 51.2% for AGIs below $10k, 48.4% for AGIs $10k-25k, 40.9% for AGIs $25k-50k, 46.2% for AGIs $50k-75k, 54.5% for AGIs $75k-100k, 68.2% for AGIs over 100k)
Likely homosexual households (counted as self-reported same-sex unmarried-partner households)
Lesbian couples: 0.5% of all households
Gay men: 0.3% of all households
Household received Food Stamps/SNAP in the past 12 months: 1,517 Household did not receive Food Stamps/SNAP in the past 12 months: 15,536
Women who had a birth in the past 12 months: 229 (155 now married, 72 unmarried) Women who did not have a birth in the past 12 months: 10,617 (2,233 now married, 8,366 unmarried)
Housing units in zip code 55408 with a mortgage: 2,832 (430 second mortgage, 7 home equity loan, 361 both second mortgage and home equity loan) Houses without a mortgage: 13
Median monthly owner costs for units with a mortgage: $2,208 Median monthly owner costs for units without a mortgage: $888
Residents with income below the poverty level in 2022:
This zip code:
16.1%
Whole state:
9.6%
Residents with income below 50% of the poverty level in 2022:
This zip code:
7.2%
Whole state:
5.2%
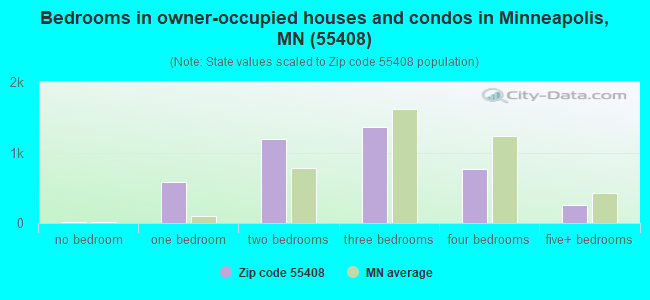
Median number of rooms in houses and condos:
Here:
6.3
State:
7.1
Median number of rooms in apartments:
Here:
3.2
State:
3.8
Notable locations in this zip code not listed on our city pages
Churches in zip code 55408 include: Zion Evangelical Lutheran Church (A), Simpson United Methodist Church (B), Seventh Day Adventist Church (C), Saint Marys Greek Orthodox Church (D), Redeemer Missionary Baptist Church (E), Minnesota Zen Meditation Center (F), Lyndale Congregational United Church of Christ (G), Liberal Catholic Church of Saint Francis (H), Aldrich Avenue Presbyterian Church (I). Display/hide their locations on the map
Parks in zip code 55408 include: Lyndale Park (1), Whittier Park (2), Pointer Park (3), Berry Park (4), Bryant Square (5). Display/hide their locations on the map
Tourist attractions (not listed on the city page) : Dodge-It Dodgeball Center (Amusement & Theme Parks; 2900 Aldrich Avenue South), Hellenic Adventures Inc (Tours & Charters; 2940 Harriet Avenue).
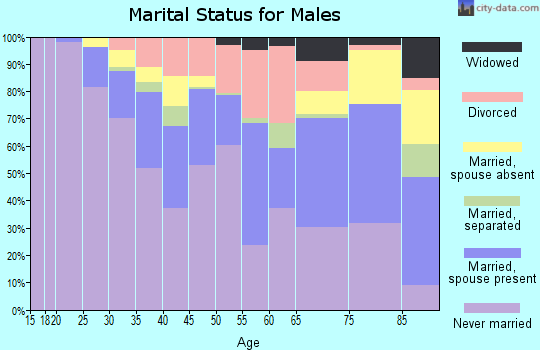
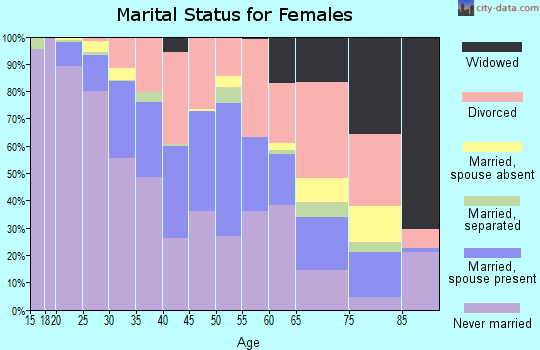
2,370 married couples with children.
1,546 single-parent households (297 men, 1,249 women).
76.9% of residents of 55408 zip code speak English at home.
8.7% of residents speak Spanish at home (60% very well, 19% well, 17% not well, 5% not at all).
3.2% of residents speak other Indo-European language at home (80% very well, 18% well, 3% not well).
1.4% of residents speak Asian or Pacific Island language at home (61% very well, 11% well, 20% not well, 8% not at all).
9.3% of residents speak other language at home (59% very well, 16% well, 25% not well, 1% not at all).
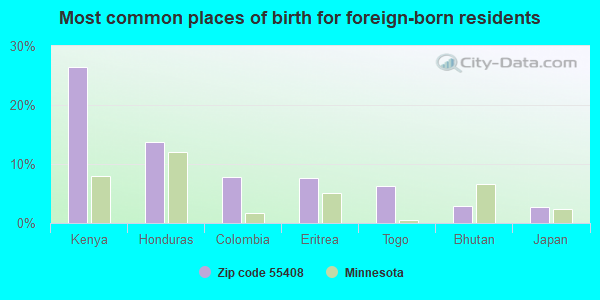
Foreign born population: 5,129 (15.8%) (53.1% of them are naturalized citizens)
Major facilities with environmental interests located in this zip code:
MIDWESTERN MACHINERY CO (2848 PLEASANT AVE S in MINNEAPOLIS, MN)
(Integrated Compliance Information System) - ICIS-05-1994-0242, FORMAL ENFORCEMENT ACTION STATE MASTER (Minnesota Pollution Control Agency permits and compilance tracking) - RCRAINFO-MND022920870, HAZARDOUS WASTE PROGRAM, RCRIS-MND022920870, SQG COMPLIANCE ACTIVITY (Tracking inspections of insecticide, fungicide, and rodenticide, and toxic substances) (Resource Conservation and Recovery Act (tracking hazardous waste)) Business SIC classification: MACHINE TOOLS, METAL CUTTING TYPES Business NAICS classification: MACHINE TOOL (METAL CUTTING TYPES) MANUFACTURING.
NICO PRODUCTS INCORPORATED (2929 1ST AVE. S. in MINNEAPOLIS, MN)
AIR MAJOR (AIRS/AFS) STATE MASTER (Minnesota Pollution Control Agency permits and compilance tracking) - AIRS-2705300113, AIR PROGRAM, RCRAINFO-MNT280010257, LQG, AFS-2705300113, AIR MAJOR, RCRIS-MNT280010257, LQG CRITERIA AND HAZARDOUS AIR POLLUTANT INVENTORY (Inventory of air pollution sources) HAZARDOUS WASTE BIENNIAL REPORTER (Resource Conservation and Recovery Act (tracking hazardous waste)) Large Quantity Generators, more that 1000 kg of hazardous waste/month (Resource Conservation and Recovery Act (tracking hazardous waste)) - notification TRI REPORTER (Tracking of toxic chemicals releasing facilities) Business SIC and NAICS classification: ELECTROPLATING, PLATING, POLISHING, ANODIZING, AND COLORING Organizations: KIRK LINDGREN (CONTACT/OPERATOR)
NORDQUIST SIGN CO (312 W LAKE ST in MINNEAPOLIS, MN)
AIR MINOR (AIRS/AFS) STATE MASTER (Minnesota Pollution Control Agency permits and compilance tracking) - AIRS-2705301106, AIR PROGRAM, RCRAINFO-MND022926133, CESQG, AFS-2705301106, AIR SYNTHETIC MINOR, RCRIS-MND022926133, SQG Small Quantity Generators, between 100 kg and 1000 kg of hazardous waste/month (Resource Conservation and Recovery Act (tracking hazardous waste)) - notification Business SIC classification: DURABLE GOODS
BENNETT LUMBER CO (2828 EMERSON AVE S in MINNEAPOLIS, MN)
STATE MASTER (Minnesota Pollution Control Agency permits and compilance tracking) - RCRAINFO-MND052734597, HAZARDOUS WASTE PROGRAM, RCRIS-MND052734597, (Resource Conservation and Recovery Act (tracking hazardous waste)) Organizations: TROUSIL CLINT (CONTACT/OWNER)
, BENNETT LUMBER COMPANY (CONTACT/OWNER)
BLUE RIBBON CLEANERS (3148 HENNEPIN AVE in MINNEAPOLIS, MN)
STATE MASTER (Minnesota Pollution Control Agency permits and compilance tracking) - RCRAINFO-MND049526825, HAZARDOUS WASTE PROGRAM, RCRIS-MND049526825, (Resource Conservation and Recovery Act (tracking hazardous waste)) Organizations: PARKER JOHN (CONTACT/OWNER)
PERFECTION TYPE INC (2716 NICOLLET AVE in MINNEAPOLIS, MN)
STATE MASTER (Minnesota Pollution Control Agency permits and compilance tracking) - RCRAINFO-MND981797061, HAZARDOUS WASTE PROGRAM, RCRIS-MND981797061, (Resource Conservation and Recovery Act (tracking hazardous waste)) Organizations: LIBBY MARK J (CONTACT/OWNER)
GFI AMERICA (2815 BLAISDELL AVE in MINNEAPOLIS, MN)
ENFORCEMENT/COMPLIANCE ACTIVITY (Integrated Compliance Information System) STATE MASTER (Minnesota Pollution Control Agency permits and compilance tracking) - RCRAINFO-MND985751742, CESQG, RCRIS-MND985751742, (Resource Conservation and Recovery Act (tracking hazardous waste)) Business SIC classification: SAUSAGES AND OTHER PREPARED MEAT PRODUCTS Business NAICS classification: MEAT PROCESSED FROM CARCASSES. Organizations: GOLDBERGER HOWARD (CONTACT/OWNER)
Alternative names: GFI PREMIUM FOODS, GFI PREMUIM FOODS
CHECKER AUTO PARTS #1816 (2737 HENNEPIN AVE in MINNEAPOLIS, MN)
STATE MASTER (Minnesota Pollution Control Agency permits and compilance tracking) - RCRIS-MNR000109348, CESQG (Resource Conservation and Recovery Act (tracking hazardous waste)) Business SIC classification: MOTOR VEHICLE SUPPLIES AND NEW PARTS Organizations: CSK AUTO INC (CONTACT/OWNER)
Alternative names: CHECKER AUTO PARTS 1816
HEALTH PARTNERS UPTOWN (3001 HENNEPIN AVE in MINNEAPOLIS, MN)
STATE MASTER (Minnesota Pollution Control Agency permits and compilance tracking) - RCRIS-MND981097025, HAZARDOUS WASTE PROGRAM (Resource Conservation and Recovery Act (tracking hazardous waste))
ERICKSON JOHN (3016 4TH AVE S in MINNEAPOLIS, MN)
STATE MASTER (Minnesota Pollution Control Agency permits and compilance tracking) - RCRAINFO-MN0000012435, CESQG, RCRIS-MN0000012435, (Resource Conservation and Recovery Act (tracking hazardous waste))
H SANCHEZ AUTO BODY (330 LAKE ST E in MINNEAPOLIS, MN)
STATE MASTER (Minnesota Pollution Control Agency permits and compilance tracking) - RCRIS-MNS000104620, HAZARDOUS WASTE PROGRAM (Resource Conservation and Recovery Act (tracking hazardous waste)) Business SIC classification: TOP, BODY, AND UPHOLSTERY REPAIR SHOPS AND PAINT SHOPS Business NAICS classification: AUTOMOTIVE BODY, PAINT, AND INTERIOR REPAIR AND MAINTENANCE. Organizations: URBAN VENTURES INC (CONTACT/OWNER)
FORMER DESPATCH LAUNDRY (113 26TH ST E in MINNEAPOLIS, MN)
STATE MASTER (Minnesota Pollution Control Agency permits and compilance tracking) - RCRIS-MNS000106054, HAZARDOUS WASTE PROGRAM (Resource Conservation and Recovery Act (tracking hazardous waste)) Business SIC classification: SANITARY SERVICES; GARMENT PRESSING, AND AGENTS FOR LAUNDRIES AND DRYCLEANERS Business NAICS classification: REMEDIATION SERVICES.; DRYCLEANING AND LAUNDRY SERVICES (EXCEPT COIN-OPERATED). Organizations: HENNEPIN COUNTY TAX FORFEIT LAND (CONTACT/OWNER)
MINNEAPOLIS SCHOOLS LYNDALE (3333 GRAND in MINNEAPOLIS, MN)
STATE MASTER (Minnesota Pollution Control Agency permits and compilance tracking) - RCRAINFO-MNR000022665, CESQG, RCRIS-MNR000022665, (Resource Conservation and Recovery Act (tracking hazardous waste)) Business SIC classification: SCHOOLS AND EDUCATIONAL SERVICES Organizations: SPECIAL SCHOOL DIST NO 1 (CONTACT/OWNER)
Alternative names: LYNDALE EL.
Housing units lacking complete plumbing facilities: 0.2% Housing units lacking complete kitchen facilities: 0.8%
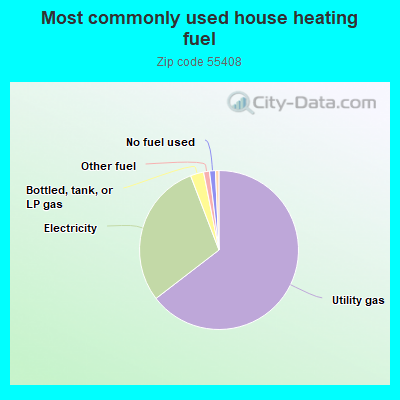
64.5%Utility gas
29.6%Electricity
2.7%Bottled, tank, or LP gas
1.2%Other fuel
1.2%No fuel used
Population in 1990: 29,685. Population change in the 1990s: +879 (+3.0%).
Place of birth for U.S.-born residents:
This state: 15,422
Northeast: 1,479
Midwest: 6,504
South: 1,671
West: 1,635
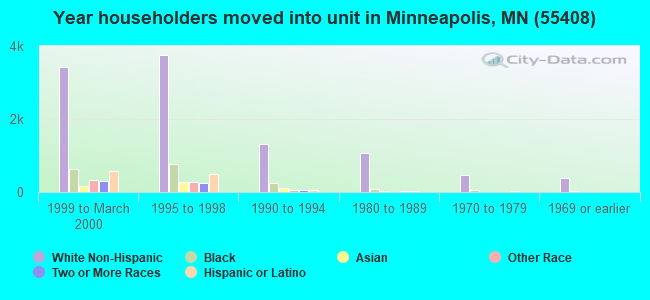
32% of the 55408 zip code residents lived in the same house 5 years ago. Out of people who lived in different houses, 54% lived in this county. Out of people who lived in different counties, 50% lived in Minnesota.
76% of the 55408 zip code residents lived in the same house 1 year ago. Out of people who lived in different houses, 55% moved from this county. Out of people who lived in different houses, 13% moved from different county within same state. Out of people who lived in different houses, 28% moved from different state. Out of people who lived in different houses, 2% moved from abroad.
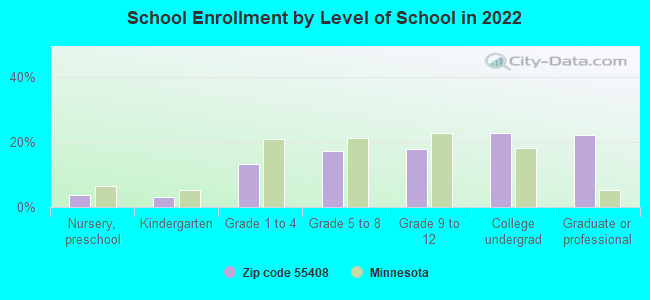
Private vs. public school enrollment:
Students in private schools in grades 1 to 8 (elementary and middle school): 286
Here:
15.7%
Minnesota:
12.9%
Students in private schools in grades 9 to 12 (high school): 129
Here:
12.1%
Minnesota:
8.6%
Students in private undergraduate colleges: 346
Here:
25.7%
Minnesota:
26.2%
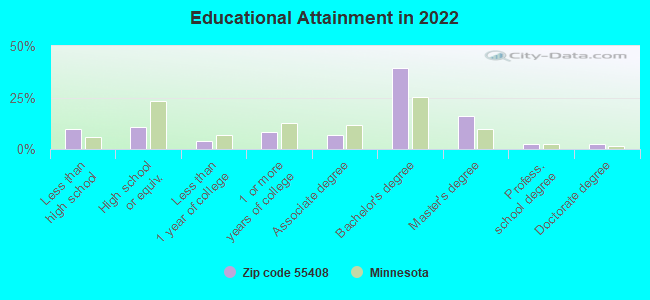
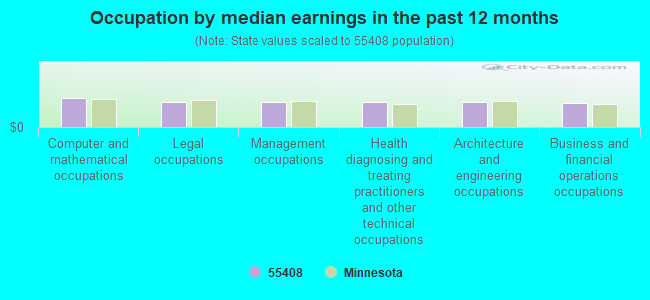
Occupation by median earnings in the past 12 months ($)
80,497Computer and mathematical occupations
69,496Legal occupations
68,892Management occupations
68,604Health diagnosing and treating practitioners and other technical occupations
67,955Architecture and engineering occupations
65,676Business and financial operations occupations
Companies with federal contracts located in this zip code (MINNEAPOLIS, MN):
HONEYWELL INC. (HONEYWELL PLZ W) : $35,970 in 3 contractsfrom 1999 to 2001
$28,368 with Air Force for Maintenance, Repair and Rebuilding of Equipment -- Automatic Data Processing Equipment (Including Firmware), Software, Supplies and Support Equipment. Taking place in ND. Signed on 1999-10-01. Completion date: 2000-09-30.
$7,602 with Army for Maintenance, Repair and Rebuilding of Equipment -- Communication, Detection, and Coherent Radiation Equipment. Signed on 2001-10-24. Completion date: 2001-12-01.
$0, same as above.Signed on 2001-10-24. Completion date: 2001-12-01.
TWB ARCHAEOLOGICAL CONSULTING (3336 HUMBOLDT AVE SO; small business) : $23,480 in 2 contractsin 2004
$11,740 with U.S. Army Corps of Engineers - civil program financing only for Archeological/Paleontological Studies. Signed on 2004-07-21. Completion date: 2004-06-25.
$11,740 with Army for Archeological/Paleontological Studies. Signed on 2004-07-21. Completion date: 2004-06-25.
SCHWABE, SAMUEL P (3545 PILLSBURY; small business)
$18,720 with Army for Translation and Interpreting Services(Including Sign Language). Taking place in VA. Signed on 2005-09-09. Completion date: 2006-09-11.
ARMOR SECURITY, INC (2601 STEVENS AVE; small business) : $7,776 in 2 contractsin 2004
$3,888 with Army for Nails, Machine Keys, and Pins. Signed on 2004-09-28. Completion date: 2004-10-15.
$3,888 with U.S. Army Corps of Engineers - civil program financing only for Nails, Machine Keys, and Pins. Signed on 2004-09-28. Completion date: 2004-10-15.
DIGITIZING EXPRESS (711 W LAKE ST STE 507; small business)
$3,100 with Navy for Badges and Insignia. Signed on 2005-06-07. Completion date: 2005-06-16.
Top industries in this zip code by the number of employees in 2005:
2007 - 2018 National Fire Incident Reporting System (NFIRS) incidents
Based on the data from the years 2007 - 2018 the average number of fires per year is 103. The highest number of fires - 119 took place in 2008, and the least - 85 in 2011. The data has a decreasing trend.
When looking into fire subcategories, the most incidents belonged to: Structure Fires (51.1%), and Outside Fires (32.3%).
Fire incident types reported to NFIRS in Zip Code 55408


 Nearest zip codes: 55409, 55403, 55405, 55419, 55404, 55410.


 Based on the data from the years 2007 - 2018 the average number of fires per year is 103. The highest number of fires - 119 took place in 2008, and the least - 85 in 2011. The data has a decreasing trend.
 When looking into fire subcategories, the most incidents belonged to: Structure Fires (51.1%), and Outside Fires (32.3%).