Estimated zip code population in 2022: 20,844 Zip code population in 2010: 19,340 Zip code population in 2000: 18,435
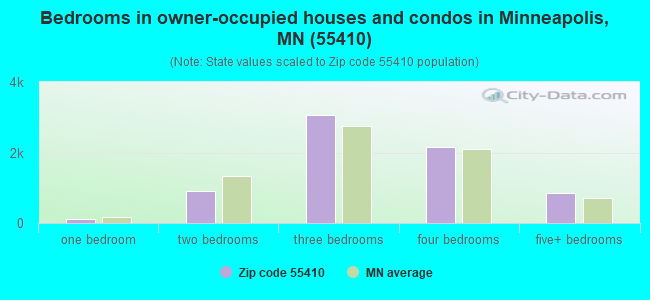
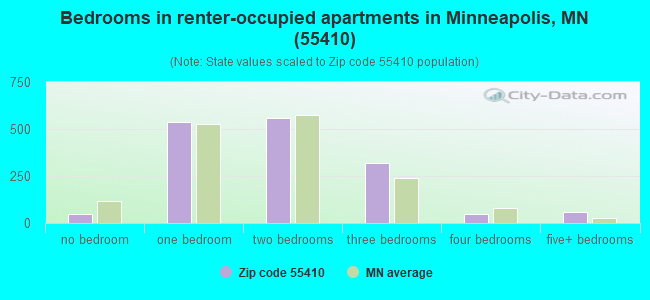
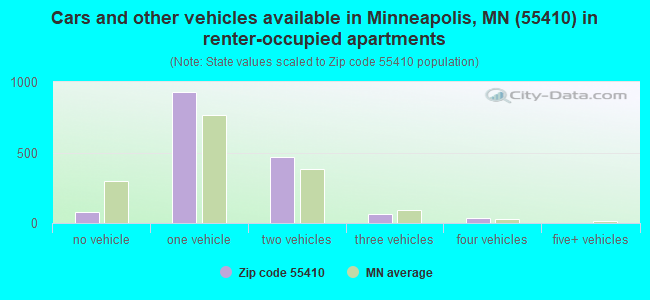
Houses and condos: 8,852 Renter-occupied apartments: 1,574
% of renters here:
18%
State:
28%
March 2022 cost of living index in zip code 55410: 115.4 (more than average, U.S. average is 100)
Land area: 3.0 sq. mi. Water area: 0.0 sq. mi.
Population density: 7,003 people per square mile
(high).
OSM Map
General Map
Google Map
MSN Map
OSM Map
General Map
Google Map
MSN Map
OSM Map
General Map
Google Map
MSN Map
OSM Map
General Map
Google Map
MSN Map
Please wait while loading the map...
Real estate property taxes paid for housing units in 2022:
This zip code:
1.2% ($7,313)
Minnesota:
1.0% ($3,087)
Median real estate property taxes paid for housing units with mortgages in 2022: $7,358 (1.1%) Median real estate property taxes paid for housing units with no mortgage in 2022: $7,083 (1.2%)
Estimated median house/condo value in 2022: $626,567
55410:
$626,567
Minnesota:
$314,600
According to our research of Minnesota and other state lists, there was 1 registered sex offender living in 55410 zip code as of April 27, 2024. The ratio of all residents to sex offenders in zip code 55410 is 20,146 to 1. The ratio of registered sex offenders to all residents in this zip code is much lower than the state average.
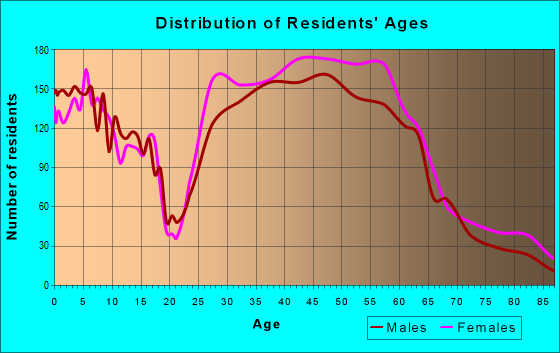
Median resident age:
This zip code:
39.8 years
Minnesota median age:
39.0 years
Average household size:
This zip code:
2.4 people
Minnesota:
2.4 people
Averages for the 2020 tax year for zip code 55410, filed in 2021:
Average Adjusted Gross Income (AGI) in 2020: $177,043 (Individual Income Tax Returns)
Here:
$177,043
State:
$82,178
Salary/wage: $146,178 (reported on 80.9% of returns)
Here:
$146,178
State:
$67,438
(% of AGI for various income ranges: 1110.4% for AGIs below $25k, 3615.6% for AGIs $25k-50k, 6294.4% for AGIs $50k-75k, 9907.6% for AGIs $75k-100k, 20094.2% for AGIs $100k-200k, 106932.3% for AGIs over 200k)
Taxable interest for individuals: $3,617 (reported on 51.2% of returns)
This zip code:
$3,617
Minnesota:
$1,814
(% of AGI for various income ranges: 33.9% for AGIs below $25k, 32.4% for AGIs $25k-50k, 55.8% for AGIs $50k-75k, 101.3% for AGIs $75k-100k, 195.7% for AGIs $100k-200k, 1938.7% for AGIs over 200k)
Ordinary dividends: $10,912 (reported on 48.8% of returns)
Here:
$10,912
State:
$6,928
(% of AGI for various income ranges: 99.7% for AGIs below $25k, 189.3% for AGIs $25k-50k, 266.4% for AGIs $50k-75k, 460.9% for AGIs $75k-100k, 761.9% for AGIs $100k-200k, 4928.2% for AGIs over 200k)
Net capital gain/loss in AGI: +$42,511 (reported on 43.6% of returns)
Here:
+$42,511
State:
+$20,591
(% of AGI for various income ranges: 61.2% for AGIs below $25k, 149.9% for AGIs $25k-50k, 212.0% for AGIs $50k-75k, 430.4% for AGIs $75k-100k, 932.8% for AGIs $100k-200k, 22314.6% for AGIs over 200k)
Profit/loss from business: +$25,954 (reported on 19.8% of returns)
Here:
+$25,954
State:
+$14,342
(% of AGI for various income ranges: 166.1% for AGIs below $25k, 331.7% for AGIs $25k-50k, 395.9% for AGIs $50k-75k, 697.8% for AGIs $75k-100k, 1184.3% for AGIs $100k-200k, 3471.4% for AGIs over 200k)
Taxable individual retirement arrangement distribution: $29,882 (reported on 14.2% of returns)
55410:
$29,882
Minnesota:
$20,675
(% of AGI for various income ranges: 101.1% for AGIs below $25k, 263.0% for AGIs $25k-50k, 380.1% for AGIs $50k-75k, 875.3% for AGIs $75k-100k, 1212.2% for AGIs $100k-200k, 2330.9% for AGIs over 200k)
Self-employed (Keogh) retirement plans: $26,127 (reported on 3.2% of returns)
55410:
$26,127
Minnesota:
$23,059
(% of AGI for various income ranges: 26.6% for AGIs $25k-50k, 52.2% for AGIs $75k-100k, 128.6% for AGIs $100k-200k, 833.9% for AGIs over 200k)
Total itemized deductions: $36,575 (reported on 26.7% of returns)
Here:
$36,575
State:
$33,311
(% of AGI for various income ranges: 198.1% for AGIs below $25k, 313.3% for AGIs $25k-50k, 505.3% for AGIs $50k-75k, 1104.4% for AGIs $75k-100k, 1740.4% for AGIs $100k-200k, 8332.2% for AGIs over 200k)
Charity contributions: $11,807 (reported on 22.8% of returns)
Here:
$11,807
State:
$11,879
(% of AGI for various income ranges: 10.1% for AGIs below $25k, 33.9% for AGIs $25k-50k, 64.1% for AGIs $50k-75k, 125.6% for AGIs $75k-100k, 269.4% for AGIs $100k-200k, 2948.7% for AGIs over 200k)
Taxes paid: $9,433 (reported on 26.7% of returns)
55410:
$9,433
State:
$8,252
(% of AGI for various income ranges: 43.8% for AGIs below $25k, 86.1% for AGIs $25k-50k, 180.1% for AGIs $50k-75k, 388.7% for AGIs $75k-100k, 583.2% for AGIs $100k-200k, 1829.0% for AGIs over 200k)
Earned income credit: $1,605 (reported on 3.8% of returns)
Here:
$1,605
State:
$2,055
(% of AGI for various income ranges: 38.1% for AGIs below $25k, 22.1% for AGIs $25k-50k)
Percentage of individuals using paid preparers for their 2020 taxes: 93.3%
Here:
93%
State:
94%
(% for various income ranges: 88.9% for AGIs below $25k, 91.5% for AGIs $25k-50k, 92.9% for AGIs $50k-75k, 92.8% for AGIs $75k-100k, 94.7% for AGIs $100k-200k, 96.8% for AGIs over 200k)
Averages for the 2012 tax year for zip code 55410, filed in 2013:
Average Adjusted Gross Income (AGI) in 2012: $118,204 (Individual Income Tax Returns)
Here:
$118,204
State:
$67,192
Salary/wage: $96,933 (reported on 84.0% of returns)
Here:
$96,933
State:
$55,182
(% of AGI for various income ranges: 69.2% for AGIs below $25k, 74.0% for AGIs $25k-50k, 73.1% for AGIs $50k-75k, 72.8% for AGIs $75k-100k, 79.5% for AGIs $100k-200k, 61.6% for AGIs over 200k)
Taxable interest for individuals: $2,013 (reported on 51.3% of returns)
This zip code:
$2,013
Minnesota:
$1,664
(% of AGI for various income ranges: 1.8% for AGIs below $25k, 0.8% for AGIs $25k-50k, 0.7% for AGIs $50k-75k, 0.9% for AGIs $75k-100k, 0.5% for AGIs $100k-200k, 1.1% for AGIs over 200k)
Ordinary dividends: $6,681 (reported on 43.4% of returns)
Here:
$6,681
State:
$5,665
(% of AGI for various income ranges: 5.1% for AGIs below $25k, 2.0% for AGIs $25k-50k, 2.3% for AGIs $50k-75k, 2.6% for AGIs $75k-100k, 2.0% for AGIs $100k-200k, 2.6% for AGIs over 200k)
Net capital gain/loss in AGI: +$25,649 (reported on 35.8% of returns)
Here:
+$25,649
State:
+$16,131
(% of AGI for various income ranges: 0.6% for AGIs below $25k, 0.2% for AGIs $25k-50k, 0.6% for AGIs $50k-75k, 1.3% for AGIs $75k-100k, 1.7% for AGIs $100k-200k, 14.1% for AGIs over 200k)
Profit/loss from business: +$23,245 (reported on 20.8% of returns)
Here:
+$23,245
State:
+$12,430
(% of AGI for various income ranges: 10.0% for AGIs below $25k, 7.1% for AGIs $25k-50k, 5.6% for AGIs $50k-75k, 6.0% for AGIs $75k-100k, 4.6% for AGIs $100k-200k, 2.7% for AGIs over 200k)
Taxable individual retirement arrangement distribution: $21,337 (reported on 13.7% of returns)
55410:
$21,337
Minnesota:
$15,212
(% of AGI for various income ranges: 5.3% for AGIs below $25k, 4.3% for AGIs $25k-50k, 3.2% for AGIs $50k-75k, 3.4% for AGIs $75k-100k, 2.5% for AGIs $100k-200k, 1.9% for AGIs over 200k)
Self-employment retirement plans: $18,252 (reported on 2.8% of returns)
55410:
$18,252
Minnesota:
$17,874
(% of AGI for various income ranges: 0.3% for AGIs $25k-50k, 0.3% for AGIs $50k-75k, 0.4% for AGIs $75k-100k, 0.4% for AGIs $100k-200k, 0.5% for AGIs over 200k)
Total itemized deductions: $31,809 (18% of AGI, reported on 58.9% of returns)
Here:
$31,809
State:
$24,665
Here:
18.0% of AGI
State:
19.6% of AGI
(% of AGI for various income ranges: 18.5% for AGIs below $25k, 13.2% for AGIs $25k-50k, 17.6% for AGIs $50k-75k, 18.3% for AGIs $75k-100k, 18.3% for AGIs $100k-200k, 14.1% for AGIs over 200k)
Charity contributions: $3,799 (reported on 52.7% of returns)
Here:
$3,799
State:
$3,948
(% of AGI for various income ranges: 1.3% for AGIs below $25k, 1.2% for AGIs $25k-50k, 1.7% for AGIs $50k-75k, 1.7% for AGIs $75k-100k, 1.8% for AGIs $100k-200k, 1.7% for AGIs over 200k)
Taxes paid: $16,392 (reported on 58.9% of returns)
55410:
$16,392
State:
$10,589
(% of AGI for various income ranges: 5.6% for AGIs below $25k, 4.6% for AGIs $25k-50k, 7.2% for AGIs $50k-75k, 8.2% for AGIs $75k-100k, 9.1% for AGIs $100k-200k, 8.3% for AGIs over 200k)
Earned income credit: $1,505 (reported on 6.1% of returns)
Here:
$1,505
State:
$2,037
(% of AGI for various income ranges: 2.6% for AGIs below $25k, 0.4% for AGIs $25k-50k)
Percentage of individuals using paid preparers for their 2012 taxes: 53.4%
Here:
53%
State:
55%
(% for various income ranges: 42.8% for AGIs below $25k, 47.8% for AGIs $25k-50k, 52.7% for AGIs $50k-75k, 56.4% for AGIs $75k-100k, 55.6% for AGIs $100k-200k, 74.0% for AGIs over 200k)
Averages for the 2004 tax year for zip code 55410, filed in 2005:
Average Adjusted Gross Income (AGI) in 2004: $79,197 (Individual Income Tax Returns)
Here:
$79,197
State:
$53,560
Salary/wage: $70,057 (reported on 83.5% of returns)
Here:
$70,057
State:
$46,177
(% of AGI for various income ranges: 127.5% for AGIs below $10k, 69.6% for AGIs $10k-25k, 77.3% for AGIs $25k-50k, 77.9% for AGIs $50k-75k, 80.9% for AGIs $75k-100k, 70.7% for AGIs over 100k)
Taxable interest for individuals: $1,911 (reported on 57.5% of returns)
This zip code:
$1,911
Minnesota:
$1,796
(% of AGI for various income ranges: 10.8% for AGIs below $10k, 2.9% for AGIs $10k-25k, 1.5% for AGIs $25k-50k, 1.3% for AGIs $50k-75k, 1.2% for AGIs $75k-100k, 1.3% for AGIs over 100k)
Taxable dividends: $3,661 (reported on 47.5% of returns)
Here:
$3,661
State:
$3,096
(% of AGI for various income ranges: 13.3% for AGIs below $10k, 3.1% for AGIs $10k-25k, 2.0% for AGIs $25k-50k, 1.6% for AGIs $50k-75k, 1.6% for AGIs $75k-100k, 2.4% for AGIs over 100k)
Net capital gain/loss: +$14,323 (reported on 38.3% of returns)
Here:
+$14,323
State:
+$10,864
(% of AGI for various income ranges: -3.8% for AGIs below $10k, 1.8% for AGIs $10k-25k, 0.9% for AGIs $25k-50k, 1.1% for AGIs $50k-75k, 1.4% for AGIs $75k-100k, 10.6% for AGIs over 100k)
Profit/loss from business: +$18,816 (reported on 19.8% of returns)
Here:
+$18,816
State:
+$10,442
(% of AGI for various income ranges: 18.0% for AGIs below $10k, 8.7% for AGIs $10k-25k, 6.7% for AGIs $25k-50k, 5.4% for AGIs $50k-75k, 3.4% for AGIs $75k-100k, 4.2% for AGIs over 100k)
IRA payment deduction: $3,031 (reported on 3.2% of returns)
55410:
$3,031
Minnesota:
$2,955
(% of AGI for various income ranges: 0.8% for AGIs below $10k, 0.3% for AGIs $10k-25k, 0.3% for AGIs $25k-50k, 0.2% for AGIs $50k-75k, 0.2% for AGIs $75k-100k, 0.0% for AGIs over 100k)
Self-employed pension: $13,545 (reported on 3.6% of returns)
Here:
$13,545
Minnesota:
$12,099
(% of AGI for various income ranges: 0.2% for AGIs $10k-25k, 0.4% for AGIs $25k-50k, 0.5% for AGIs $50k-75k, 0.3% for AGIs $75k-100k, 0.8% for AGIs over 100k)
Total itemized deductions: $22,837 (20% of AGI, reported on 59.6% of returns)
Here:
$22,837
State:
$20,035
Here:
19.9% of AGI
State:
21.3% of AGI
(% of AGI for various income ranges: 45.5% for AGIs below $10k, 20.2% for AGIs $10k-25k, 16.2% for AGIs $25k-50k, 20.2% for AGIs $50k-75k, 20.6% for AGIs $75k-100k, 15.6% for AGIs over 100k)
Charity contributions deductions: $3,522 (3% of AGI, reported on 55.5% of returns)
Here:
$3,522
State:
$3,333
Here:
3.0% of AGI
State:
3.4% of AGI
(% of AGI for various income ranges: 2.6% for AGIs below $10k, 2.1% for AGIs $10k-25k, 1.7% for AGIs $25k-50k, 2.2% for AGIs $50k-75k, 2.3% for AGIs $75k-100k, 2.7% for AGIs over 100k)
Total tax: $14,223 (reported on 86.8% of returns)
55410:
$14,223
State:
$8,485
(% of AGI for various income ranges: 5.5% for AGIs below $10k, 5.3% for AGIs $10k-25k, 9.0% for AGIs $25k-50k, 10.7% for AGIs $50k-75k, 11.2% for AGIs $75k-100k, 19.2% for AGIs over 100k)
Earned income credit: $1,176 (reported on 4.9% of returns)
Here:
$1,176
State:
$1,523
Percentage of individuals using paid preparers for their 2004 taxes: 54.9%
Here:
55%
State:
59%
(% for various income ranges: 49.7% for AGIs below $10k, 49.2% for AGIs $10k-25k, 50.4% for AGIs $25k-50k, 57.7% for AGIs $50k-75k, 55.0% for AGIs $75k-100k, 63.8% for AGIs over 100k)
Likely homosexual households (counted as self-reported same-sex unmarried-partner households)
Lesbian couples: 0.1% of all households
Gay men: 0.3% of all households
Household received Food Stamps/SNAP in the past 12 months: 252 Household did not receive Food Stamps/SNAP in the past 12 months: 8,410
Women who had a birth in the past 12 months: 347 (322 now married, 29 unmarried) Women who did not have a birth in the past 12 months: 4,496 (2,490 now married, 2,009 unmarried)
Housing units in zip code 55410 with a mortgage: 5,208 (741 second mortgage, 56 home equity loan, 611 both second mortgage and home equity loan) Houses without a mortgage: 193
Median monthly owner costs for units with a mortgage: $2,868 Median monthly owner costs for units without a mortgage: $1,009
Residents with income below the poverty level in 2022:
This zip code:
2.9%
Whole state:
9.6%
Residents with income below 50% of the poverty level in 2022:
This zip code:
1.1%
Whole state:
5.2%
Median number of rooms in houses and condos:
Here:
7.7
State:
7.1
Median number of rooms in apartments:
Here:
4.3
State:
3.8
Notable locations in this zip code not listed on our city pages
Churches in zip code 55410 include: True Apostolic Assembly Church (A), Saint Thomas the Apostle Church (B), Saint Peter Lutheran Church (C), Saint Johns Episcopal Church (D), Minneapolis Friends Meeting House (E), Lake Harriet United Methodist Church (F), Lake Harriet Spiritual Community Church (G), Lake Harriet Christian Church (H), Christ the King Catholic Church (I). Display/hide their locations on the map
Parks in zip code 55410 include: Linden Hills Field (1), Pershing Field (2), Waveland Park (3), York Park (4), Armatage Park (5), Beard Park (6), Beards Plaisance (7), Chowen Park (8). Display/hide their locations on the map
Tourist attraction (not listed on the city page) : MN Transportation Museum (Cultural Attractions- Events- & Facilities; 2330 West 42nd Street).
4,276 married couples with children.
958 single-parent households (384 men, 574 women).
93.3% of residents of 55410 zip code speak English at home.
1.5% of residents speak Spanish at home (69% very well, 30% well, 1% not well).
2.4% of residents speak other Indo-European language at home (93% very well, 7% well).
1.5% of residents speak Asian or Pacific Island language at home (90% very well, 10% well).
0.5% of residents speak other language at home (81% very well, 19% well).
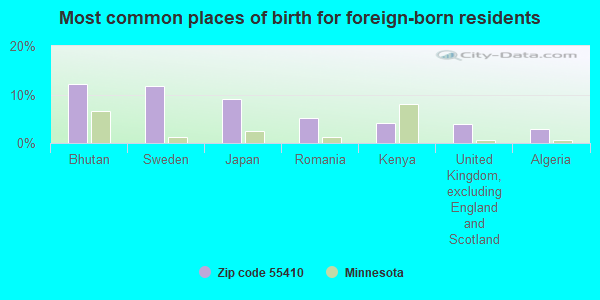
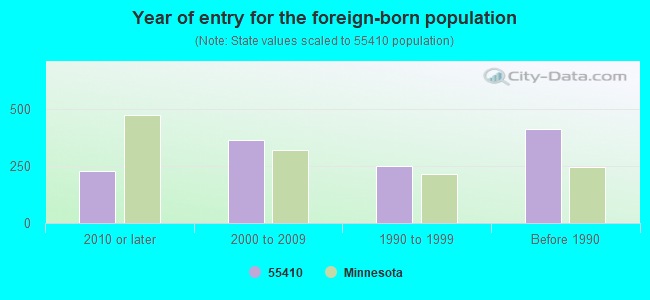
Foreign born population: 1,095 (5.3%) (62.7% of them are naturalized citizens)
Major facilities with environmental interests located in this zip code:
AMERICANA BANK (5050 FRANCE AVE S in EDINA, MN)
STATE MASTER (Minnesota Pollution Control Agency permits and compilance tracking) - RCRAINFO-MNR000002519, CESQG, RCRIS-MNR000002519, (Resource Conservation and Recovery Act (tracking hazardous waste))
MINNEAPOLIS SCHOOLS ARMATAGE (2501 W 56TH ST in MINNEAPOLIS, MN)
STATE MASTER (Minnesota Pollution Control Agency permits and compilance tracking) - RCRAINFO-MNR000022921, CESQG, RCRIS-MNR000022921, (Resource Conservation and Recovery Act (tracking hazardous waste)) Business SIC classification: SCHOOLS AND EDUCATIONAL SERVICES Organizations: SPECIAL SCHOOL DISTRICT NO 1 (CONTACT/OWNER)
ALL JS TIRE CTR INC (5001 XERXES AVE S in MINNEAPOLIS, MN)
STATE MASTER (Minnesota Pollution Control Agency permits and compilance tracking) - RCRAINFO-MND066511767, HAZARDOUS WASTE PROGRAM, RCRIS-MND066511767, Small Quantity Generators, between 100 kg and 1000 kg of hazardous waste/month (Resource Conservation and Recovery Act (tracking hazardous waste)) - notification Organizations: ALL JS TIRE CENTER INC (CONTACT/OWNER)
BLACKS PHOTOGRAPHY 803 (5010 FRANCE AVE S in EDINA, MN)
STATE MASTER (Minnesota Pollution Control Agency permits and compilance tracking) - RCRAINFO-MND985679380, HAZARDOUS WASTE PROGRAM, RCRIS-MND985679380, Small Quantity Generators, between 100 kg and 1000 kg of hazardous waste/month (Resource Conservation and Recovery Act (tracking hazardous waste)) Organizations: SCOTTS HOSPITALITY (CONTACT/OWNER)
MURPHYS EDINA SVC CENTER (5354 FRANCE AVE S in EDINA, MN)
STATE MASTER (Minnesota Pollution Control Agency permits and compilance tracking) - RCRAINFO-MND981798184, CESQG, RCRIS-MND981798184, Conditionally Exempt Small Quantity Generators, less than 100 kg/month of hazardous waste (Resource Conservation and Recovery Act (tracking hazardous waste)) - notification Organizations: MURPHY TIMOTHY (CONTACT/OWNER)
, MURPHYS SERVICE (CONTACT/OWNER)
Alternative names: MURPHYS SERVICE
GARY AUTOMOTIVE INC (3100 W 50TH ST in MINNEAPOLIS, MN)
STATE MASTER (Minnesota Pollution Control Agency permits and compilance tracking) - RCRAINFO-MND022890586, CESQG, RCRIS-MND022890586, Small Quantity Generators, between 100 kg and 1000 kg of hazardous waste/month (Resource Conservation and Recovery Act (tracking hazardous waste)) - notification Business SIC classification: TOP, BODY, AND UPHOLSTERY REPAIR SHOPS AND PAINT SHOPS Business NAICS classification: AUTOMOTIVE BODY, PAINT, AND INTERIOR REPAIR AND MAINTENANCE. Organizations: GREIG GARY (CONTACT/OWNER)
, GARYS AUTOMOTIVE INC (CONTACT/OWNER)
Alternative names: GARYS AUTOMOTIVE INC
EDINA LAUNDRY CO (4500 FRANCE AVE S in EDINA, MN)
STATE MASTER (Minnesota Pollution Control Agency permits and compilance tracking) - RCRAINFO-MND041786658, HAZARDOUS WASTE PROGRAM, RCRIS-MND041786658, SQG Small Quantity Generators, between 100 kg and 1000 kg of hazardous waste/month (Resource Conservation and Recovery Act (tracking hazardous waste)) - notification Organizations: STOTTS DAVID (CONTACT/OWNER)
BEEMAN DENTAL CLINIC (2306 W 50TH ST in MINNEAPOLIS, MN)
STATE MASTER (Minnesota Pollution Control Agency permits and compilance tracking) - RCRAINFO-MND985749944, CESQG, RCRIS-MND985749944, Conditionally Exempt Small Quantity Generators, less than 100 kg/month of hazardous waste (Resource Conservation and Recovery Act (tracking hazardous waste)) - notification Business SIC classification: HEALTH AND ALLIED SERVICES Organizations: BEEMAN TED (CONTACT/OWNER)
ONE HOUR MARTINIZING (5559 XERXES AVE S in MINNEAPOLIS, MN)
STATE MASTER (Minnesota Pollution Control Agency permits and compilance tracking) - RCRAINFO-MND981200025, HAZARDOUS WASTE PROGRAM, RCRIS-MND981200025, SQG Small Quantity Generators, between 100 kg and 1000 kg of hazardous waste/month (Resource Conservation and Recovery Act (tracking hazardous waste)) - notification Business SIC classification: GARMENT PRESSING, AND AGENTS FOR LAUNDRIES AND DRYCLEANERS Business NAICS classification: DRYCLEANING AND LAUNDRY SERVICES (EXCEPT COIN-OPERATED). Alternative names: ONE HOUR MARTINIZING - XERXES AVE S
H AND J INC DBA KENWOOD CYCLERY (4303 UPTON AVE S in MINNEAPOLIS, MN)
STATE MASTER (Minnesota Pollution Control Agency permits and compilance tracking) - RCRAINFO-MNR000011825, CESQG, RCRIS-MNR000011825, Conditionally Exempt Small Quantity Generators, less than 100 kg/month of hazardous waste (Resource Conservation and Recovery Act (tracking hazardous waste)) - notification Organizations: KENWOOD CYCLERY H & J INC (CONTACT/OWNER)
Alternative names: KENWOOD CYCLERY H& J INC
CH & EJ ASSOC INC (4951 FRANCE AVE S in MINNEAPOLIS, MN)
STATE MASTER (Minnesota Pollution Control Agency permits and compilance tracking) - RCRAINFO-MNR000003202, CESQG, RCRIS-MNR000003202, Conditionally Exempt Small Quantity Generators, less than 100 kg/month of hazardous waste (Resource Conservation and Recovery Act (tracking hazardous waste)) - notification Organizations: AMOCO OIL COMPANY (CONTACT/OWNER)
, CH & EJ ASSOCIATES INC (CONTACT/OWNER)
ARMATAGE EL. (2501 W. 56TH ST. in MINNEAPOLIS, MN)
(National Center for Education Statistics) - STATE ID-030001103 Organizations: MINNEAPOLIS (SCHOOL DISTRICT)
BLUESKY CHARTER SCHOOL (4900 RUSSELL AVENUE S. in MINNEAPOLIS, MN)
(National Center for Education Statistics) - STATE ID-074082010
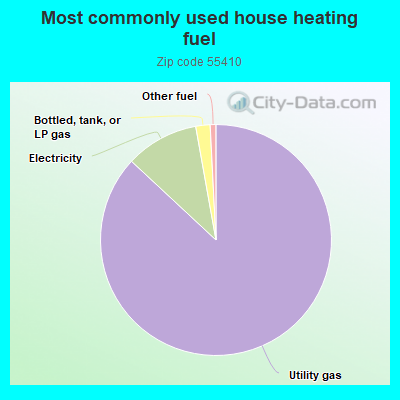
86.6%Utility gas
10.2%Electricity
2.0%Bottled, tank, or LP gas
0.8%Other fuel
Population in 1990: 16,834. Population change in the 1990s: +1,601 (+9.5%).
Place of birth for U.S.-born residents:
This state: 12,887
Northeast: 1,246
Midwest: 3,581
South: 863
West: 962
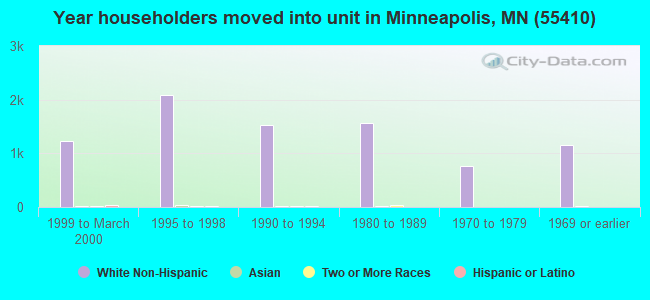
62% of the 55410 zip code residents lived in the same house 5 years ago. Out of people who lived in different houses, 60% lived in this county. Out of people who lived in different counties, 50% lived in Minnesota.
88% of the 55410 zip code residents lived in the same house 1 year ago. Out of people who lived in different houses, 64% moved from this county. Out of people who lived in different houses, 9% moved from different county within same state. Out of people who lived in different houses, 23% moved from different state. Out of people who lived in different houses, 2% moved from abroad.
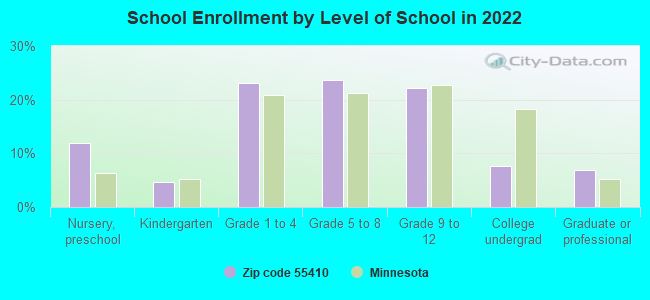
Private vs. public school enrollment:
Students in private schools in grades 1 to 8 (elementary and middle school): 564
Here:
23.9%
Minnesota:
12.9%
Students in private schools in grades 9 to 12 (high school): 211
Here:
19.0%
Minnesota:
8.6%
Students in private undergraduate colleges: 136
Here:
35.4%
Minnesota:
26.2%
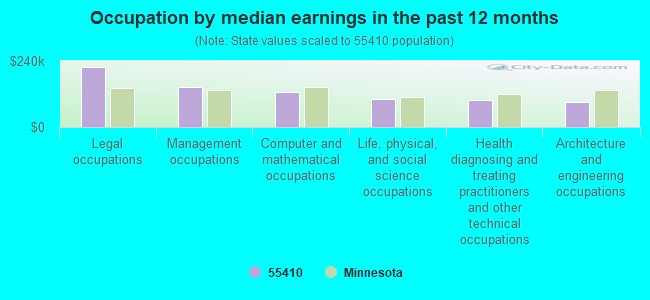
Occupation by median earnings in the past 12 months ($)
218,957Legal occupations
145,850Management occupations
126,823Computer and mathematical occupations
103,148Life, physical, and social science occupations
98,147Health diagnosing and treating practitioners and other technical occupations
90,775Architecture and engineering occupations
Companies with federal contracts located in this zip code (MINNEAPOLIS, MN):
ADGUIDE PUBLICATIONS, INC (3109 W 50 ST STE 121)
$18,000 with Army for Military Personnel Recruitment. Taking place in NY. Signed on 2005-09-10. Completion date: 2005-09-15.
ALPHA SOLUTIONS INC (5637 CHOWEN AVE S; small business)
$15,990 with Army for Hazard-Detecting Instruments and Apparatus. Signed on 2004-07-02. Completion date: 2004-07-30.
SILVER SCREEN ADVERTISING INC (6101 FRANCE AVE S; small business)
$6,934 with Army for Advertising Services. Signed on 2005-08-17. Completion date: 2005-11-04.
PREFERRED INC (3513 W 50TH ST; small business)
$5,300 with Army for Lectures For Training. Signed on 2005-02-10. Completion date: 2005-02-24.
Top industries in this zip code by the number of employees in 2005:
2002 - 2018 National Fire Incident Reporting System (NFIRS) incidents
Based on the data from the years 2002 - 2018 the average number of fires per year is 19. The highest number of fires - 38 took place in 2011, and the least - 2 in 2002. The data has an increasing trend.
When looking into fire subcategories, the most incidents belonged to: Structure Fires (59.6%), and Outside Fires (28.0%).
Fire incident types reported to NFIRS in Zip Code 55410


 Nearest zip codes: 55424, 55419, 55408, 55435, 55416, 55409.


 Based on the data from the years 2002 - 2018 the average number of fires per year is 19. The highest number of fires - 38 took place in 2011, and the least - 2 in 2002. The data has an increasing trend.
 When looking into fire subcategories, the most incidents belonged to: Structure Fires (59.6%), and Outside Fires (28.0%).