Estimated zip code population in 2022: 10,242 Zip code population in 2010: 9,685 Zip code population in 2000: 9,821
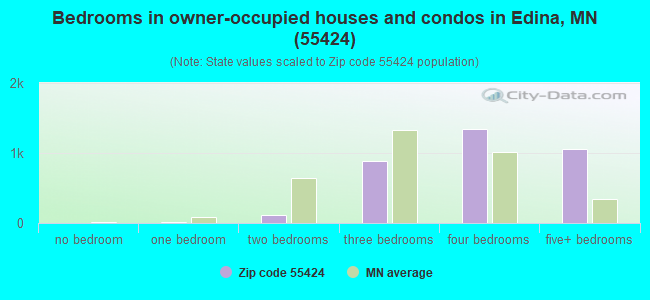
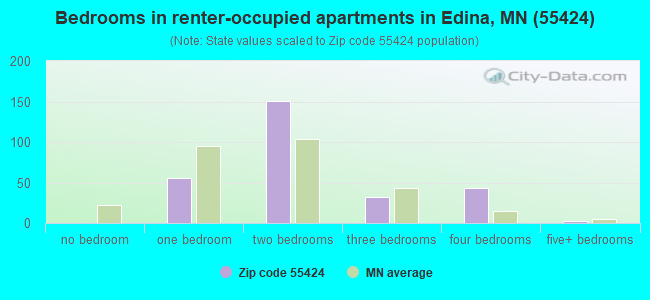
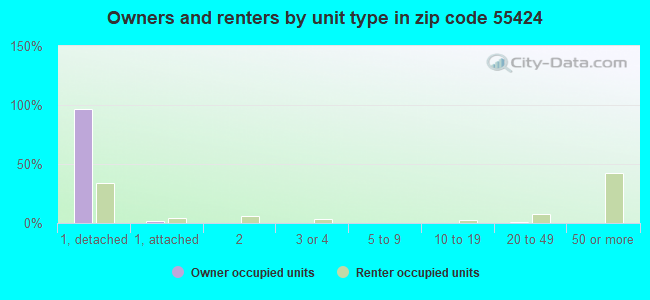
Houses and condos: 3,832 Renter-occupied apartments: 286
% of renters here:
8%
State:
28%
March 2022 cost of living index in zip code 55424: 116.1 (more than average, U.S. average is 100)
Land area: 2.4 sq. mi. Water area: 0.1 sq. mi.
Population density: 4,235 people per square mile
(average).
OSM Map
General Map
Google Map
MSN Map
OSM Map
General Map
Google Map
MSN Map
OSM Map
General Map
Google Map
MSN Map
OSM Map
General Map
Google Map
MSN Map
Please wait while loading the map...
Real estate property taxes paid for housing units in 2022:
This zip code:
1.1% ($10,291)
Minnesota:
1.0% ($3,087)
Median real estate property taxes paid for housing units with mortgages in 2022: $10,238 (1.1%) Median real estate property taxes paid for housing units with no mortgage in 2022: $10,317 (1.1%)
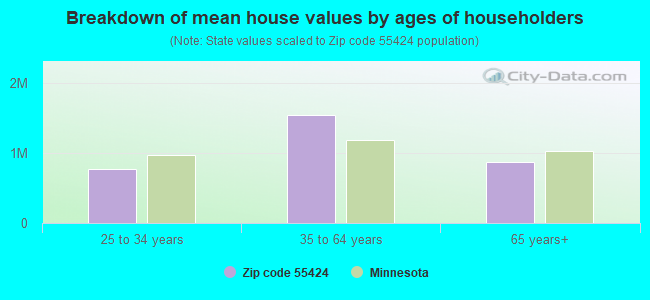
Estimated median house/condo value in 2022: $965,410
55424:
$965,410
Minnesota:
$314,600
According to our research of Minnesota and other state lists, there was 1 registered sex offender living in 55424 zip code as of April 27, 2024. The ratio of all residents to sex offenders in zip code 55424 is 10,001 to 1. The ratio of registered sex offenders to all residents in this zip code is lower than the state average.
Median resident age:
This zip code:
41.4 years
Minnesota median age:
39.0 years
Average household size:
This zip code:
2.8 people
Minnesota:
2.4 people
Averages for the 2020 tax year for zip code 55424, filed in 2021:
Average Adjusted Gross Income (AGI) in 2020: $370,206 (Individual Income Tax Returns)
Here:
$370,206
State:
$82,178
Salary/wage: $289,842 (reported on 80.3% of returns)
Here:
$289,842
State:
$67,438
(% of AGI for various income ranges: 1423.2% for AGIs below $25k, 3790.0% for AGIs $25k-50k, 6909.4% for AGIs $50k-75k, 9017.5% for AGIs $75k-100k, 20594.8% for AGIs $100k-200k, 191523.1% for AGIs over 200k)
Taxable interest for individuals: $6,804 (reported on 61.2% of returns)
This zip code:
$6,804
Minnesota:
$1,814
(% of AGI for various income ranges: 38.3% for AGIs below $25k, 82.4% for AGIs $25k-50k, 188.9% for AGIs $50k-75k, 296.2% for AGIs $75k-100k, 336.1% for AGIs $100k-200k, 3367.5% for AGIs over 200k)
Ordinary dividends: $23,376 (reported on 62.3% of returns)
Here:
$23,376
State:
$6,928
(% of AGI for various income ranges: 162.4% for AGIs below $25k, 360.0% for AGIs $25k-50k, 727.2% for AGIs $50k-75k, 806.9% for AGIs $75k-100k, 2130.0% for AGIs $100k-200k, 11142.9% for AGIs over 200k)
Net capital gain/loss in AGI: +$79,154 (reported on 58.0% of returns)
Here:
+$79,154
State:
+$20,591
(% of AGI for various income ranges: 160.5% for AGIs below $25k, 302.4% for AGIs $25k-50k, 362.8% for AGIs $50k-75k, 676.9% for AGIs $75k-100k, 2035.8% for AGIs $100k-200k, 40125.3% for AGIs over 200k)
Profit/loss from business: +$45,555 (reported on 20.6% of returns)
Here:
+$45,555
State:
+$14,342
(% of AGI for various income ranges: 127.8% for AGIs below $25k, 244.8% for AGIs $25k-50k, 513.9% for AGIs $50k-75k, 886.9% for AGIs $75k-100k, 1636.4% for AGIs $100k-200k, 6833.9% for AGIs over 200k)
Taxable individual retirement arrangement distribution: $38,159 (reported on 14.6% of returns)
55424:
$38,159
Minnesota:
$20,675
(% of AGI for various income ranges: 101.2% for AGIs below $25k, 233.6% for AGIs $25k-50k, 836.1% for AGIs $50k-75k, 854.4% for AGIs $75k-100k, 2158.2% for AGIs $100k-200k, 2932.4% for AGIs over 200k)
Self-employed (Keogh) retirement plans: $34,975 (reported on 6.0% of returns)
55424:
$34,975
Minnesota:
$23,059
(% of AGI for various income ranges: 205.2% for AGIs $100k-200k, 1787.5% for AGIs over 200k)
Total itemized deductions: $60,002 (reported on 39.0% of returns)
Here:
$60,002
State:
$33,311
(% of AGI for various income ranges: 237.6% for AGIs below $25k, 459.2% for AGIs $25k-50k, 1171.7% for AGIs $50k-75k, 1286.9% for AGIs $75k-100k, 2882.4% for AGIs $100k-200k, 18313.9% for AGIs over 200k)
Charity contributions: $32,249 (reported on 35.3% of returns)
Here:
$32,249
State:
$11,879
(% of AGI for various income ranges: 13.4% for AGIs below $25k, 60.0% for AGIs $25k-50k, 159.4% for AGIs $50k-75k, 185.6% for AGIs $75k-100k, 623.3% for AGIs $100k-200k, 9875.5% for AGIs over 200k)
Taxes paid: $9,748 (reported on 38.8% of returns)
55424:
$9,748
State:
$8,252
(% of AGI for various income ranges: 52.9% for AGIs below $25k, 131.2% for AGIs $25k-50k, 372.8% for AGIs $50k-75k, 395.6% for AGIs $75k-100k, 854.2% for AGIs $100k-200k, 2544.1% for AGIs over 200k)
Earned income credit: $1,267 (reported on 1.9% of returns)
Here:
$1,267
State:
$2,055
(% of AGI for various income ranges: 27.8% for AGIs below $25k)
Percentage of individuals using paid preparers for their 2020 taxes: 93.6%
Here:
94%
State:
94%
(% for various income ranges: 91.6% for AGIs below $25k, 89.5% for AGIs $25k-50k, 88.6% for AGIs $50k-75k, 89.7% for AGIs $75k-100k, 93.6% for AGIs $100k-200k, 96.9% for AGIs over 200k)
Averages for the 2012 tax year for zip code 55424, filed in 2013:
Average Adjusted Gross Income (AGI) in 2012: $260,632 (Individual Income Tax Returns)
Here:
$260,632
State:
$67,192
Salary/wage: $212,576 (reported on 79.3% of returns)
Here:
$212,576
State:
$55,182
(% of AGI for various income ranges: 63.5% for AGIs below $25k, 67.3% for AGIs $25k-50k, 61.9% for AGIs $50k-75k, 56.5% for AGIs $75k-100k, 70.0% for AGIs $100k-200k, 64.2% for AGIs over 200k)
Taxable interest for individuals: $6,229 (reported on 59.0% of returns)
This zip code:
$6,229
Minnesota:
$1,664
(% of AGI for various income ranges: 1.8% for AGIs below $25k, 1.4% for AGIs $25k-50k, 1.3% for AGIs $50k-75k, 1.5% for AGIs $75k-100k, 1.5% for AGIs $100k-200k, 1.4% for AGIs over 200k)
Ordinary dividends: $17,600 (reported on 57.3% of returns)
Here:
$17,600
State:
$5,665
(% of AGI for various income ranges: 9.8% for AGIs below $25k, 4.3% for AGIs $25k-50k, 5.2% for AGIs $50k-75k, 3.9% for AGIs $75k-100k, 3.3% for AGIs $100k-200k, 3.9% for AGIs over 200k)
Net capital gain/loss in AGI: +$49,471 (reported on 53.2% of returns)
Here:
+$49,471
State:
+$16,131
(% of AGI for various income ranges: 3.2% for AGIs below $25k, 2.2% for AGIs $25k-50k, 1.4% for AGIs $50k-75k, 1.6% for AGIs $75k-100k, 2.5% for AGIs $100k-200k, 11.8% for AGIs over 200k)
Profit/loss from business: +$34,883 (reported on 20.5% of returns)
Here:
+$34,883
State:
+$12,430
(% of AGI for various income ranges: 7.0% for AGIs below $25k, 5.3% for AGIs $25k-50k, 6.3% for AGIs $50k-75k, 5.7% for AGIs $75k-100k, 4.6% for AGIs $100k-200k, 2.2% for AGIs over 200k)
Taxable individual retirement arrangement distribution: $36,209 (reported on 16.8% of returns)
55424:
$36,209
Minnesota:
$15,212
(% of AGI for various income ranges: 6.7% for AGIs below $25k, 4.1% for AGIs $25k-50k, 4.1% for AGIs $50k-75k, 7.1% for AGIs $75k-100k, 4.8% for AGIs $100k-200k, 1.8% for AGIs over 200k)
Self-employment retirement plans: $26,882 (reported on 4.8% of returns)
55424:
$26,882
Minnesota:
$17,874
Total itemized deductions: $62,962 (17% of AGI, reported on 66.2% of returns)
Here:
$62,962
State:
$24,665
Here:
16.5% of AGI
State:
19.6% of AGI
(% of AGI for various income ranges: 23.6% for AGIs below $25k, 23.7% for AGIs $25k-50k, 22.6% for AGIs $50k-75k, 24.0% for AGIs $75k-100k, 21.6% for AGIs $100k-200k, 14.7% for AGIs over 200k)
Charity contributions: $10,658 (reported on 62.1% of returns)
Here:
$10,658
State:
$3,948
(% of AGI for various income ranges: 1.7% for AGIs below $25k, 2.0% for AGIs $25k-50k, 2.5% for AGIs $50k-75k, 2.4% for AGIs $75k-100k, 2.4% for AGIs $100k-200k, 2.6% for AGIs over 200k)
Taxes paid: $35,233 (reported on 66.0% of returns)
55424:
$35,233
State:
$10,589
(% of AGI for various income ranges: 5.1% for AGIs below $25k, 6.6% for AGIs $25k-50k, 8.2% for AGIs $50k-75k, 9.3% for AGIs $75k-100k, 10.7% for AGIs $100k-200k, 8.8% for AGIs over 200k)
Earned income credit: $1,367 (reported on 3.3% of returns)
Here:
$1,367
State:
$2,037
(% of AGI for various income ranges: 1.5% for AGIs below $25k, 0.3% for AGIs $25k-50k)
Percentage of individuals using paid preparers for their 2012 taxes: 65.4%
Here:
65%
State:
55%
(% for various income ranges: 54.8% for AGIs below $25k, 53.1% for AGIs $25k-50k, 62.2% for AGIs $50k-75k, 60.7% for AGIs $75k-100k, 63.4% for AGIs $100k-200k, 81.8% for AGIs over 200k)
Averages for the 2004 tax year for zip code 55424, filed in 2005:
Average Adjusted Gross Income (AGI) in 2004: $166,766 (Individual Income Tax Returns)
Here:
$166,766
State:
$53,560
Salary/wage: $137,597 (reported on 75.6% of returns)
Here:
$137,597
State:
$46,177
(% of AGI for various income ranges: 58.7% for AGIs $10k-25k, 63.7% for AGIs $25k-50k, 64.6% for AGIs $50k-75k, 63.5% for AGIs $75k-100k, 61.5% for AGIs over 100k)
Taxable interest for individuals: $5,450 (reported on 67.4% of returns)
This zip code:
$5,450
Minnesota:
$1,796
(% of AGI for various income ranges: 5.0% for AGIs $10k-25k, 3.4% for AGIs $25k-50k, 3.1% for AGIs $50k-75k, 2.3% for AGIs $75k-100k, 2.0% for AGIs over 100k)
Taxable dividends: $9,186 (reported on 63.9% of returns)
Here:
$9,186
State:
$3,096
(% of AGI for various income ranges: 8.3% for AGIs $10k-25k, 4.8% for AGIs $25k-50k, 4.1% for AGIs $50k-75k, 3.6% for AGIs $75k-100k, 3.3% for AGIs over 100k)
Net capital gain/loss: +$33,988 (reported on 56.9% of returns)
Here:
+$33,988
State:
+$10,864
(% of AGI for various income ranges: 4.3% for AGIs $10k-25k, 1.6% for AGIs $25k-50k, 1.5% for AGIs $50k-75k, 3.6% for AGIs $75k-100k, 12.8% for AGIs over 100k)
Profit/loss from business: +$31,114 (reported on 19.1% of returns)
Here:
+$31,114
State:
+$10,442
(% of AGI for various income ranges: 7.0% for AGIs $10k-25k, 5.6% for AGIs $25k-50k, 5.4% for AGIs $50k-75k, 6.7% for AGIs $75k-100k, 3.2% for AGIs over 100k)
Profit/loss from farming: +$2,273 (reported on 0.2% of returns)
Here:
+$2,273
State:
-$962
IRA payment deduction: $3,331 (reported on 2.8% of returns)
55424:
$3,331
Minnesota:
$2,955
(% of AGI for various income ranges: 0.4% for AGIs $25k-50k, 0.2% for AGIs $50k-75k, 0.1% for AGIs $75k-100k, 0.0% for AGIs over 100k)
Self-employed pension: $19,876 (reported on 4.8% of returns)
Here:
$19,876
Minnesota:
$12,099
(% of AGI for various income ranges: 0.7% for AGIs $50k-75k, 0.5% for AGIs $75k-100k, 0.6% for AGIs over 100k)
Total itemized deductions: $42,210 (17% of AGI, reported on 65.4% of returns)
Here:
$42,210
State:
$20,035
Here:
17.1% of AGI
State:
21.3% of AGI
(% of AGI for various income ranges: 30.0% for AGIs $10k-25k, 23.4% for AGIs $25k-50k, 26.6% for AGIs $50k-75k, 24.2% for AGIs $75k-100k, 15.2% for AGIs over 100k)
Charity contributions deductions: $8,828 (3% of AGI, reported on 62.1% of returns)
Here:
$8,828
State:
$3,333
Here:
3.4% of AGI
State:
3.4% of AGI
(% of AGI for various income ranges: 2.7% for AGIs $10k-25k, 3.0% for AGIs $25k-50k, 3.5% for AGIs $50k-75k, 3.3% for AGIs $75k-100k, 3.3% for AGIs over 100k)
Total tax: $41,413 (reported on 83.2% of returns)
55424:
$41,413
State:
$8,485
(% of AGI for various income ranges: 4.9% for AGIs $10k-25k, 7.7% for AGIs $25k-50k, 9.2% for AGIs $50k-75k, 10.3% for AGIs $75k-100k, 22.2% for AGIs over 100k)
Earned income credit: $1,225 (reported on 2.2% of returns)
Here:
$1,225
State:
$1,523
Percentage of individuals using paid preparers for their 2004 taxes: 64.9%
Here:
65%
State:
59%
(% for various income ranges: 58.5% for AGIs below $10k, 56.4% for AGIs $10k-25k, 56.9% for AGIs $25k-50k, 65.3% for AGIs $50k-75k, 65.3% for AGIs $75k-100k, 72.7% for AGIs over 100k)
Likely homosexual households (counted as self-reported same-sex unmarried-partner households)
Lesbian couples: 0.0% of all households
Gay men: 0.3% of all households
Household received Food Stamps/SNAP in the past 12 months: 0 Household did not receive Food Stamps/SNAP in the past 12 months: 3,670
Women who had a birth in the past 12 months: 71 (72 now married, 0 unmarried) Women who did not have a birth in the past 12 months: 1,767 (1,168 now married, 601 unmarried)
Housing units in zip code 55424 with a mortgage: 2,341 (269 second mortgage, 278 both second mortgage and home equity loan) Houses without a mortgage: 37
Median monthly owner costs for units with a mortgage: $3,815 Median monthly owner costs for units without a mortgage: $1,365
Residents with income below the poverty level in 2022:
This zip code:
2.4%
Whole state:
9.6%
Residents with income below 50% of the poverty level in 2022:
This zip code:
1.0%
Whole state:
5.2%
Median number of rooms in houses and condos:
Here:
10.0
State:
7.1
Median number of rooms in apartments:
Here:
5.3
State:
3.8
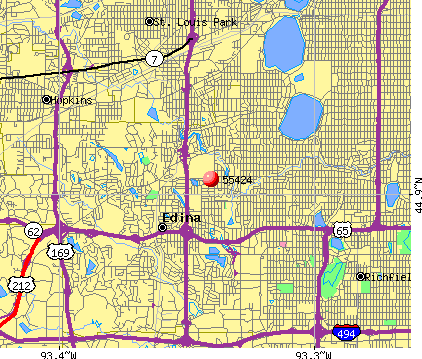
Notable locations in this zip code not listed on our city pages
Churches in zip code 55424 include: Saint Stephens Episcopal Church (A), Edina-Morningside Community Congregational Church (B), Edina Covenant Church (C), Edina Community Lutheran Church (D), Colony Park Baptist Church (E). Display/hide their locations on the map
Parks in zip code 55424 include: Pamela Park (1), Saint Johns Park (2), Wooddale Park (3), Utley Park (4), Arden Park (5), Browndale Park (6). Display/hide their locations on the map
In group quarters: 18 (-1 institutionalized population)
Size of family households: 1,213 2-persons, 663 3-persons, 637 4-persons, 514 5-persons, 37 6-persons
Size of nonfamily households: 549 1-person, 53 2-persons
2,666 married couples with children.
361 single-parent households (127 men, 234 women).
92.9% of residents of 55424 zip code speak English at home.
0.3% of residents speak Spanish at home (100% very well).
3.8% of residents speak other Indo-European language at home (83% very well, 7% well, 10% not well).
2.0% of residents speak Asian or Pacific Island language at home (79% very well, 21% well).
0.3% of residents speak other language at home (100% very well).
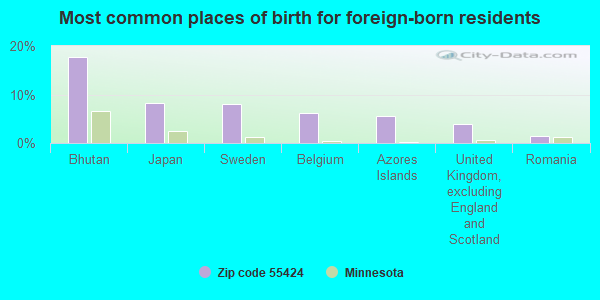
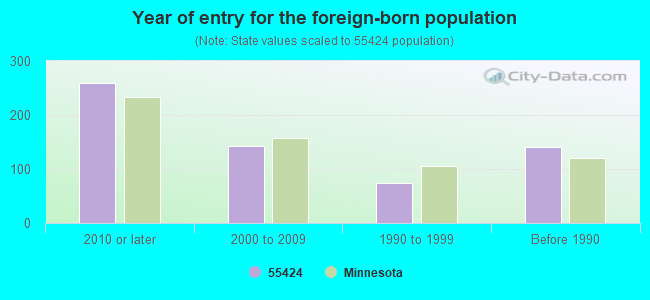
Foreign born population: 520 (5.1%) (53.2% of them are naturalized citizens)
Major facilities with environmental interests located in this zip code:
EDINA COMMUNITY CENTER/SOUTHVIEW MIDDLE (4725 S VIEW LN in EDINA, MN)
STATE MASTER (Minnesota Pollution Control Agency permits and compilance tracking) - PCS-C00012406, NPDES STORMWATER PERMIT (National Center for Education Statistics) - STATE ID-010273019 Organizations: ISD 273 (CONTACT/OWNER)
Alternative names: 273 SO VIEW MIDDLE TS
GREENE RICHARD A DC (5200 WILLSON RD STE 207 in EDINA, MN)
STATE MASTER (Minnesota Pollution Control Agency permits and compilance tracking) - RCRAINFO-MN0000989160, CESQG, RCRIS-MN0000989160, (Resource Conservation and Recovery Act (tracking hazardous waste))
ECKELS AND ANDERSON (3922 W 50TH ST in EDINA, MN)
STATE MASTER (Minnesota Pollution Control Agency permits and compilance tracking) - RCRAINFO-MND985702679, HAZARDOUS WASTE PROGRAM, RCRIS-MND985702679, CESQG (Resource Conservation and Recovery Act (tracking hazardous waste)) Business SIC classification: OFFICES AND CLINICS OF DENTISTS Business NAICS classification: OFFICES OF DENTISTS. Organizations: ANDERSON RICHARD J (CONTACT/OWNER)
, ANDERSON RICHARD J DDS (CONTACT/OWNER)
Alternative names: RICHARD J ANDERSON DDS
FAIRVIEW SOUTHWEST CLINIC (6121 WOODDALE AVE S in EDINA, MN)
STATE MASTER (Minnesota Pollution Control Agency permits and compilance tracking) - RCRAINFO-MND985763341, SQG, RCRIS-MND985763341, (Resource Conservation and Recovery Act (tracking hazardous waste)) Business SIC classification: HEALTH AND ALLIED SERVICES Organizations: FAIRVIEW HOSPITAL AND HEALTHCARE SVC (CONTACT/OWNER)
ANDERSON CLEANERS (4504 VALLEY VIEW RD in EDINA, MN)
STATE MASTER (Minnesota Pollution Control Agency permits and compilance tracking) - RCRAINFO-MND981539935, CESQG, RCRIS-MND981539935, Small Quantity Generators, between 100 kg and 1000 kg of hazardous waste/month (Resource Conservation and Recovery Act (tracking hazardous waste)) - notification Business SIC classification: DRYCLEANING PLANTS, EXCEPT RUG CLEANING Business NAICS classification: DRYCLEANING AND LAUNDRY SERVICES (EXCEPT COIN-OPERATED). Organizations: ROSSMAN J R JR (CONTACT/OWNER)
HOOTEN CLEANERS (3944 W 49 1/2 ST in EDINA, MN)
STATE MASTER (Minnesota Pollution Control Agency permits and compilance tracking) - RCRAINFO-MND022904171, SQG, RCRIS-MND022904171, Conditionally Exempt Small Quantity Generators, less than 100 kg/month of hazardous waste (Resource Conservation and Recovery Act (tracking hazardous waste)) - notification Organizations: PARK SOON (CONTACT/OWNER)
EDINA 5 0 DENTAL WILCOX THOMAS I (3948 W 50TH ST STE 205 in EDINA, MN)
STATE MASTER (Minnesota Pollution Control Agency permits and compilance tracking) - RCRAINFO-MN0000803304, CESQG, RCRIS-MN0000803304, (Resource Conservation and Recovery Act (tracking hazardous waste)) Business SIC classification: HEALTH AND ALLIED SERVICES
33 MINUTE PHOTO INC (3945 W 50TH ST in EDINA, MN)
STATE MASTER (Minnesota Pollution Control Agency permits and compilance tracking) - RCRAINFO-MND985722065, CESQG, RCRIS-MND985722065, Conditionally Exempt Small Quantity Generators, less than 100 kg/month of hazardous waste (Resource Conservation and Recovery Act (tracking hazardous waste)) - notification Organizations: LUND RUSSELL T III (CONTACT/OWNER)
50TH AND FRANCE CHIROPRACTIC GROUPP (3948 WEST 50TH STREET SUITE 203 in EDINA, MN)
STATE MASTER (Minnesota Pollution Control Agency permits and compilance tracking) - RCRAINFO-MN0000967265, CESQG, RCRIS-MN0000967265, Conditionally Exempt Small Quantity Generators, less than 100 kg/month of hazardous waste (Resource Conservation and Recovery Act (tracking hazardous waste)) - notification Business SIC classification: HEALTH AND ALLIED SERVICES Organizations: BOLINE KRISTA R DR (CONTACT/OWNER)
, 50TH & FRANCE CHIROPRACTIC GRP (CONTACT/OWNER)
Alternative names: 50TH AND FRANCE CHIROPRACTIC GRP
BRANDENBURG HEIDI M DS (3948 W 50TH ST 201 in EDINA, MN)
STATE MASTER (Minnesota Pollution Control Agency permits and compilance tracking) - RCRAINFO-MN0000831024, CESQG, RCRIS-MN0000831024, Conditionally Exempt Small Quantity Generators, less than 100 kg/month of hazardous waste (Resource Conservation and Recovery Act (tracking hazardous waste)) - notification Business SIC classification: HEALTH AND ALLIED SERVICES Organizations: BRANDENBURG HEIDI M DDS (CONTACT/OWNER)
, BRANDENBURG HEIDI DDS (CONTACT/OWNER)
Alternative names: BRANDENBURG HEIDI DDS
MYLAN VIRGIL M DDS (4954 LINCOLN DR in EDINA, MN)
STATE MASTER (Minnesota Pollution Control Agency permits and compilance tracking) - RCRAINFO-MN0000803643, CESQG, RCRIS-MN0000803643, Conditionally Exempt Small Quantity Generators, less than 100 kg/month of hazardous waste (Resource Conservation and Recovery Act (tracking hazardous waste)) - notification Business SIC classification: OFFICES AND CLINICS OF DENTISTS Business NAICS classification: OFFICES OF DENTISTS.
EDINA COUNTRY CLUB (5100 WOODDALE AVE in EDINA, MN)
STATE MASTER (Minnesota Pollution Control Agency permits and compilance tracking) - RCRAINFO-MNR000015479, CESQG, RCRIS-MNR000015479, Conditionally Exempt Small Quantity Generators, less than 100 kg/month of hazardous waste (Resource Conservation and Recovery Act (tracking hazardous waste)) - notification Organizations: MEMBER OWNED PRIVATE CLUB (CONTACT/OWNER)
FLYNN CLARENCE S DDS (3939 W 50TH ST STE 210 in EDINA, MN)
STATE MASTER (Minnesota Pollution Control Agency permits and compilance tracking) - RCRAINFO-MND985720606, HAZARDOUS WASTE PROGRAM, RCRIS-MND985720606, Conditionally Exempt Small Quantity Generators, less than 100 kg/month of hazardous waste (Resource Conservation and Recovery Act (tracking hazardous waste)) - notification Business SIC classification: HEALTH AND ALLIED SERVICES
Housing units lacking complete plumbing facilities: 0.7% Housing units lacking complete kitchen facilities: 0.7%
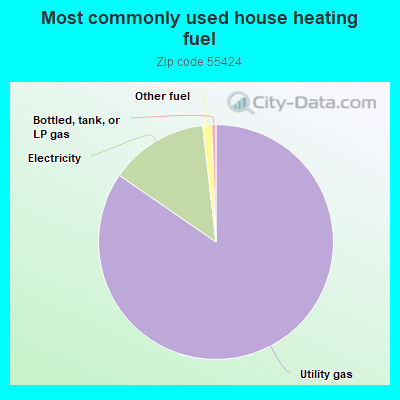
84.7%Utility gas
13.6%Electricity
1.2%Other fuel
0.6%Bottled, tank, or LP gas
Population in 1990: 12,342.
Place of birth for U.S.-born residents:
This state: 5,952
Northeast: 435
Midwest: 2,159
South: 700
West: 388
64% of the 55424 zip code residents lived in the same house 5 years ago. Out of people who lived in different houses, 59% lived in this county. Out of people who lived in different counties, 50% lived in Minnesota.
90% of the 55424 zip code residents lived in the same house 1 year ago. Out of people who lived in different houses, 71% moved from this county. Out of people who lived in different houses, 5% moved from different county within same state. Out of people who lived in different houses, 23% moved from different state.
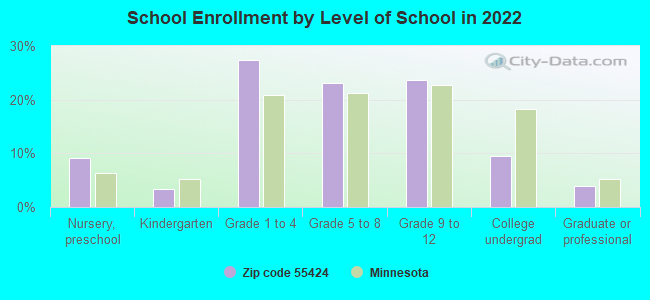
Private vs. public school enrollment:
Students in private schools in grades 1 to 8 (elementary and middle school): 406
Here:
27.1%
Minnesota:
12.9%
Students in private schools in grades 9 to 12 (high school): 154
Here:
22.2%
Minnesota:
8.6%
Students in private undergraduate colleges: 116
Here:
41.6%
Minnesota:
26.2%
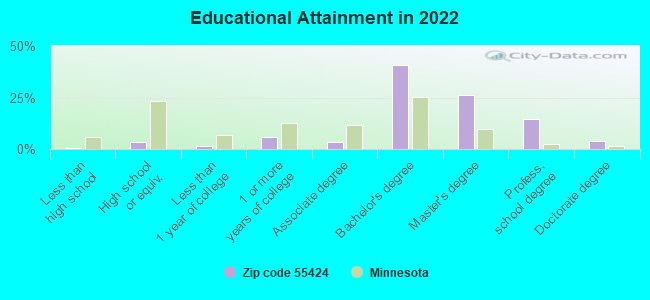
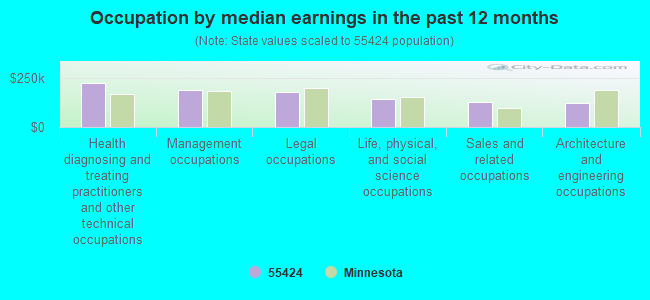
Occupation by median earnings in the past 12 months ($)
223,432Health diagnosing and treating practitioners and other technical occupations
190,379Management occupations
178,726Legal occupations
140,863Life, physical, and social science occupations
126,702Sales and related occupations
123,105Architecture and engineering occupations
Companies with federal contracts located in this zip code:
ADAYTUM, INC (2051 KILLEBREW DRIVE, SUIT in MINNEAPOLIS, In; small business)
-$14,330 with Army for Programming Services. Taking place in AL. Signed on 2002-10-22. Completion date: 2002-11-05.
Top industries in this zip code by the number of employees in 2005:
2002 - 2018 National Fire Incident Reporting System (NFIRS) incidents
Based on the data from the years 2002 - 2018 the average number of fires per year is 23. The highest number of fires - 33 took place in 2005, and the least - 13 in 2018. The data has a decreasing trend.
When looking into fire subcategories, the most incidents belonged to: Structure Fires (70.8%), and Outside Fires (16.6%).
Fire incident types reported to NFIRS in Zip Code 55424


+$2,273
-$962
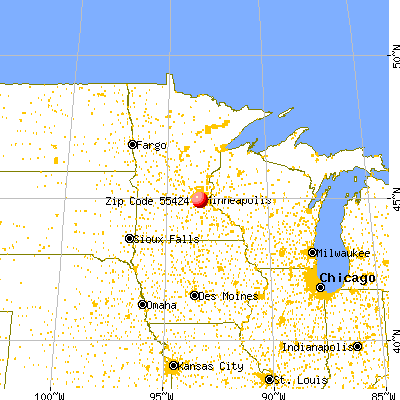
 Nearest zip codes: 55410, 55436, 55435, 55439, 55416, 55419.


 Based on the data from the years 2002 - 2018 the average number of fires per year is 23. The highest number of fires - 33 took place in 2005, and the least - 13 in 2018. The data has a decreasing trend.
 When looking into fire subcategories, the most incidents belonged to: Structure Fires (70.8%), and Outside Fires (16.6%).