Estimated zip code population in 2022: 14,392 Zip code population in 2010: 13,138 Zip code population in 2000: 12,607
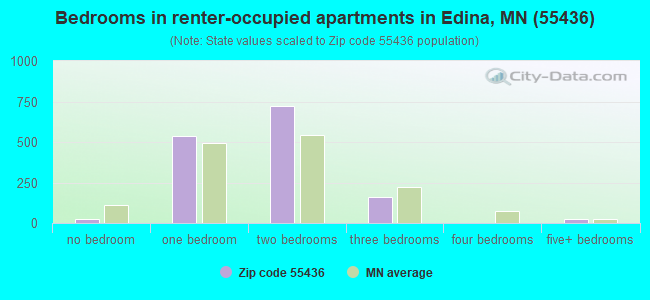
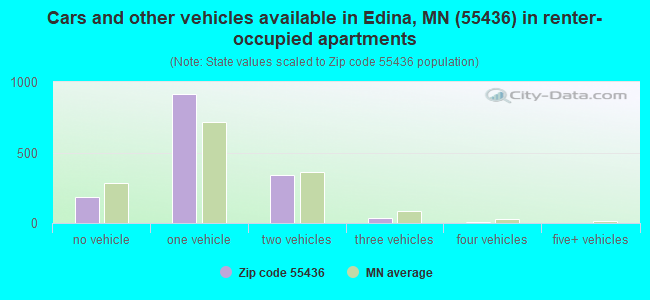
Houses and condos: 6,431 Renter-occupied apartments: 1,475
% of renters here:
24%
State:
28%
March 2022 cost of living index in zip code 55436: 116.4 (more than average, U.S. average is 100)
Land area: 4.7 sq. mi. Water area: 0.2 sq. mi.
Population density: 3,035 people per square mile
(average).
OSM Map
General Map
Google Map
MSN Map
OSM Map
General Map
Google Map
MSN Map
OSM Map
General Map
Google Map
MSN Map
OSM Map
General Map
Google Map
MSN Map
Please wait while loading the map...
Real estate property taxes paid for housing units in 2022:
This zip code:
1.0% ($6,503)
Minnesota:
1.0% ($3,087)
Median real estate property taxes paid for housing units with mortgages in 2022: $6,750 (1.0%) Median real estate property taxes paid for housing units with no mortgage in 2022: $6,108 (1.1%)
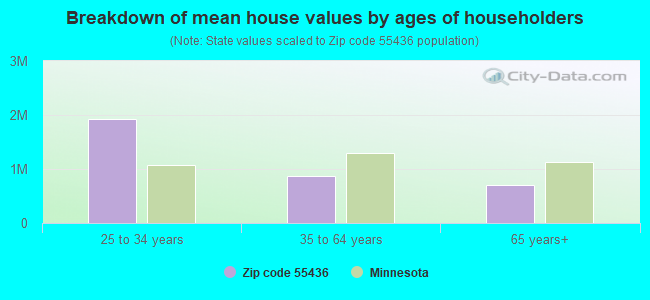
Estimated median house/condo value in 2022: $626,896
55436:
$626,896
Minnesota:
$314,600
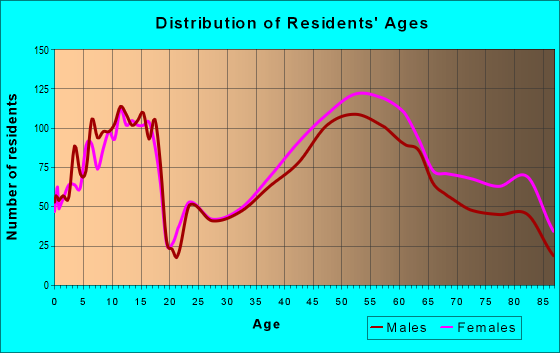
Median resident age:
This zip code:
47.7 years
Minnesota median age:
39.0 years
Average household size:
This zip code:
2.3 people
Minnesota:
2.4 people
Averages for the 2020 tax year for zip code 55436, filed in 2021:
Average Adjusted Gross Income (AGI) in 2020: $253,991 (Individual Income Tax Returns)
Here:
$253,991
State:
$82,178
Salary/wage: $171,838 (reported on 74.5% of returns)
Here:
$171,838
State:
$67,438
(% of AGI for various income ranges: 1049.3% for AGIs below $25k, 3518.1% for AGIs $25k-50k, 6158.7% for AGIs $50k-75k, 8234.7% for AGIs $75k-100k, 19179.7% for AGIs $100k-200k, 134511.3% for AGIs over 200k)
Taxable interest for individuals: $7,575 (reported on 54.0% of returns)
This zip code:
$7,575
Minnesota:
$1,814
(% of AGI for various income ranges: 46.4% for AGIs below $25k, 57.3% for AGIs $25k-50k, 88.7% for AGIs $50k-75k, 230.9% for AGIs $75k-100k, 361.5% for AGIs $100k-200k, 4762.0% for AGIs over 200k)
Ordinary dividends: $26,713 (reported on 53.5% of returns)
Here:
$26,713
State:
$6,928
(% of AGI for various income ranges: 172.8% for AGIs below $25k, 229.4% for AGIs $25k-50k, 436.1% for AGIs $50k-75k, 809.1% for AGIs $75k-100k, 1606.0% for AGIs $100k-200k, 16059.1% for AGIs over 200k)
Net capital gain/loss in AGI: +$94,750 (reported on 49.1% of returns)
Here:
+$94,750
State:
+$20,591
(% of AGI for various income ranges: 93.8% for AGIs below $25k, 156.1% for AGIs $25k-50k, 320.0% for AGIs $50k-75k, 593.1% for AGIs $75k-100k, 1685.8% for AGIs $100k-200k, 59974.5% for AGIs over 200k)
Profit/loss from business: +$35,053 (reported on 18.1% of returns)
Here:
+$35,053
State:
+$14,342
(% of AGI for various income ranges: 170.7% for AGIs below $25k, 152.9% for AGIs $25k-50k, 238.3% for AGIs $50k-75k, 587.8% for AGIs $75k-100k, 1121.9% for AGIs $100k-200k, 6301.6% for AGIs over 200k)
Taxable individual retirement arrangement distribution: $35,644 (reported on 17.9% of returns)
55436:
$35,644
Minnesota:
$20,675
(% of AGI for various income ranges: 129.0% for AGIs below $25k, 319.6% for AGIs $25k-50k, 517.6% for AGIs $50k-75k, 1226.2% for AGIs $75k-100k, 2414.8% for AGIs $100k-200k, 4067.3% for AGIs over 200k)
Self-employed (Keogh) retirement plans: $28,779 (reported on 3.2% of returns)
55436:
$28,779
Minnesota:
$23,059
(% of AGI for various income ranges: 97.9% for AGIs $100k-200k, 1145.5% for AGIs over 200k)
Total itemized deductions: $55,456 (reported on 27.4% of returns)
Here:
$55,456
State:
$33,311
(% of AGI for various income ranges: 184.7% for AGIs below $25k, 273.0% for AGIs $25k-50k, 705.0% for AGIs $50k-75k, 1208.4% for AGIs $75k-100k, 2436.9% for AGIs $100k-200k, 15790.5% for AGIs over 200k)
Charity contributions: $27,522 (reported on 24.9% of returns)
Here:
$27,522
State:
$11,879
(% of AGI for various income ranges: 14.8% for AGIs below $25k, 46.4% for AGIs $25k-50k, 100.6% for AGIs $50k-75k, 199.4% for AGIs $75k-100k, 507.3% for AGIs $100k-200k, 8388.7% for AGIs over 200k)
Taxes paid: $9,353 (reported on 27.3% of returns)
55436:
$9,353
State:
$8,252
(% of AGI for various income ranges: 36.9% for AGIs below $25k, 63.9% for AGIs $25k-50k, 177.6% for AGIs $50k-75k, 368.4% for AGIs $75k-100k, 718.1% for AGIs $100k-200k, 2114.9% for AGIs over 200k)
Earned income credit: $1,308 (reported on 3.4% of returns)
Here:
$1,308
State:
$2,055
(% of AGI for various income ranges: 23.0% for AGIs below $25k, 18.4% for AGIs $25k-50k)
Percentage of individuals using paid preparers for their 2020 taxes: 93.1%
Here:
93%
State:
94%
(% for various income ranges: 89.4% for AGIs below $25k, 91.3% for AGIs $25k-50k, 93.1% for AGIs $50k-75k, 94.8% for AGIs $75k-100k, 94.2% for AGIs $100k-200k, 95.9% for AGIs over 200k)
Averages for the 2012 tax year for zip code 55436, filed in 2013:
Average Adjusted Gross Income (AGI) in 2012: $220,286 (Individual Income Tax Returns)
Here:
$220,286
State:
$67,192
Salary/wage: $142,665 (reported on 74.2% of returns)
Here:
$142,665
State:
$55,182
(% of AGI for various income ranges: 57.0% for AGIs below $25k, 60.6% for AGIs $25k-50k, 61.8% for AGIs $50k-75k, 55.4% for AGIs $75k-100k, 64.8% for AGIs $100k-200k, 43.8% for AGIs over 200k)
Taxable interest for individuals: $7,045 (reported on 59.5% of returns)
This zip code:
$7,045
Minnesota:
$1,664
(% of AGI for various income ranges: 3.2% for AGIs below $25k, 1.8% for AGIs $25k-50k, 1.5% for AGIs $50k-75k, 1.6% for AGIs $75k-100k, 1.1% for AGIs $100k-200k, 2.0% for AGIs over 200k)
Ordinary dividends: $23,735 (reported on 52.8% of returns)
Here:
$23,735
State:
$5,665
(% of AGI for various income ranges: 8.0% for AGIs below $25k, 4.9% for AGIs $25k-50k, 3.9% for AGIs $50k-75k, 4.7% for AGIs $75k-100k, 4.2% for AGIs $100k-200k, 6.0% for AGIs over 200k)
Net capital gain/loss in AGI: +$70,867 (reported on 48.2% of returns)
Here:
+$70,867
State:
+$16,131
(% of AGI for various income ranges: 0.7% for AGIs below $25k, 1.8% for AGIs $25k-50k, 3.1% for AGIs $50k-75k, 2.6% for AGIs $75k-100k, 3.0% for AGIs $100k-200k, 19.3% for AGIs over 200k)
Profit/loss from business: +$36,888 (reported on 18.9% of returns)
Here:
+$36,888
State:
+$12,430
(% of AGI for various income ranges: 7.5% for AGIs below $25k, 4.3% for AGIs $25k-50k, 5.1% for AGIs $50k-75k, 3.2% for AGIs $75k-100k, 4.6% for AGIs $100k-200k, 2.7% for AGIs over 200k)
Taxable individual retirement arrangement distribution: $30,995 (reported on 22.2% of returns)
55436:
$30,995
Minnesota:
$15,212
(% of AGI for various income ranges: 9.3% for AGIs below $25k, 7.7% for AGIs $25k-50k, 7.1% for AGIs $50k-75k, 7.4% for AGIs $75k-100k, 6.6% for AGIs $100k-200k, 2.0% for AGIs over 200k)
Self-employment retirement plans: $26,956 (reported on 3.6% of returns)
55436:
$26,956
Minnesota:
$17,874
(% of AGI for various income ranges: 0.5% for AGIs $50k-75k, 0.5% for AGIs $100k-200k, 0.5% for AGIs over 200k)
Total itemized deductions: $60,916 (18% of AGI, reported on 61.5% of returns)
Here:
$60,916
State:
$24,665
Here:
18.0% of AGI
State:
19.6% of AGI
(% of AGI for various income ranges: 25.4% for AGIs below $25k, 17.8% for AGIs $25k-50k, 18.8% for AGIs $50k-75k, 19.5% for AGIs $75k-100k, 20.6% for AGIs $100k-200k, 16.1% for AGIs over 200k)
Charity contributions: $13,590 (reported on 57.2% of returns)
Here:
$13,590
State:
$3,948
(% of AGI for various income ranges: 1.9% for AGIs below $25k, 2.2% for AGIs $25k-50k, 2.3% for AGIs $50k-75k, 2.7% for AGIs $75k-100k, 2.5% for AGIs $100k-200k, 3.9% for AGIs over 200k)
Taxes paid: $29,744 (reported on 61.4% of returns)
55436:
$29,744
State:
$10,589
(% of AGI for various income ranges: 5.3% for AGIs below $25k, 4.9% for AGIs $25k-50k, 6.8% for AGIs $50k-75k, 8.1% for AGIs $75k-100k, 9.4% for AGIs $100k-200k, 8.3% for AGIs over 200k)
Earned income credit: $1,230 (reported on 3.9% of returns)
Here:
$1,230
State:
$2,037
(% of AGI for various income ranges: 1.5% for AGIs below $25k, 0.2% for AGIs $25k-50k)
Percentage of individuals using paid preparers for their 2012 taxes: 62.8%
Here:
63%
State:
55%
(% for various income ranges: 53.1% for AGIs below $25k, 56.0% for AGIs $25k-50k, 59.5% for AGIs $50k-75k, 66.1% for AGIs $75k-100k, 64.7% for AGIs $100k-200k, 79.0% for AGIs over 200k)
Averages for the 2004 tax year for zip code 55436, filed in 2005:
Average Adjusted Gross Income (AGI) in 2004: $150,176 (Individual Income Tax Returns)
Here:
$150,176
State:
$53,560
Salary/wage: $116,925 (reported on 71.7% of returns)
Here:
$116,925
State:
$46,177
(% of AGI for various income ranges: 47.7% for AGIs $10k-25k, 61.7% for AGIs $25k-50k, 56.6% for AGIs $50k-75k, 60.7% for AGIs $75k-100k, 54.5% for AGIs over 100k)
Taxable interest for individuals: $7,055 (reported on 66.9% of returns)
This zip code:
$7,055
Minnesota:
$1,796
(% of AGI for various income ranges: 7.3% for AGIs $10k-25k, 3.4% for AGIs $25k-50k, 2.8% for AGIs $50k-75k, 2.9% for AGIs $75k-100k, 3.0% for AGIs over 100k)
Taxable dividends: $12,397 (reported on 61.8% of returns)
Here:
$12,397
State:
$3,096
(% of AGI for various income ranges: 8.9% for AGIs $10k-25k, 4.8% for AGIs $25k-50k, 3.9% for AGIs $50k-75k, 3.6% for AGIs $75k-100k, 5.1% for AGIs over 100k)
Net capital gain/loss: +$22,259 (reported on 55.3% of returns)
Here:
+$22,259
State:
+$10,864
(% of AGI for various income ranges: 1.8% for AGIs $10k-25k, 2.0% for AGIs $25k-50k, 1.9% for AGIs $50k-75k, 1.8% for AGIs $75k-100k, 9.3% for AGIs over 100k)
Profit/loss from business: +$26,452 (reported on 19.1% of returns)
Here:
+$26,452
State:
+$10,442
(% of AGI for various income ranges: 8.0% for AGIs $10k-25k, 4.8% for AGIs $25k-50k, 6.4% for AGIs $50k-75k, 6.0% for AGIs $75k-100k, 2.8% for AGIs over 100k)
IRA payment deduction: $3,391 (reported on 3.0% of returns)
55436:
$3,391
Minnesota:
$2,955
(% of AGI for various income ranges: 0.4% for AGIs $10k-25k, 0.3% for AGIs $25k-50k, 0.3% for AGIs $50k-75k, 0.2% for AGIs $75k-100k, 0.0% for AGIs over 100k)
Self-employed pension: $17,382 (reported on 4.4% of returns)
Here:
$17,382
Minnesota:
$12,099
(% of AGI for various income ranges: 0.3% for AGIs $25k-50k, 0.4% for AGIs $50k-75k, 0.6% for AGIs $75k-100k, 0.5% for AGIs over 100k)
Total itemized deductions: $40,773 (17% of AGI, reported on 60.6% of returns)
Here:
$40,773
State:
$20,035
Here:
17.2% of AGI
State:
21.3% of AGI
(% of AGI for various income ranges: 29.9% for AGIs $10k-25k, 20.6% for AGIs $25k-50k, 22.3% for AGIs $50k-75k, 22.1% for AGIs $75k-100k, 15.2% for AGIs over 100k)
Charity contributions deductions: $8,119 (3% of AGI, reported on 57.6% of returns)
Here:
$8,119
State:
$3,333
Here:
3.3% of AGI
State:
3.4% of AGI
(% of AGI for various income ranges: 3.3% for AGIs $10k-25k, 2.7% for AGIs $25k-50k, 3.3% for AGIs $50k-75k, 3.1% for AGIs $75k-100k, 3.1% for AGIs over 100k)
Total tax: $37,856 (reported on 82.6% of returns)
55436:
$37,856
State:
$8,485
(% of AGI for various income ranges: 4.7% for AGIs $10k-25k, 8.5% for AGIs $25k-50k, 10.1% for AGIs $50k-75k, 10.8% for AGIs $75k-100k, 22.8% for AGIs over 100k)
Earned income credit: $1,179 (reported on 2.7% of returns)
Here:
$1,179
State:
$1,523
Percentage of individuals using paid preparers for their 2004 taxes: 64.4%
Here:
64%
State:
59%
(% for various income ranges: 57.5% for AGIs below $10k, 61.0% for AGIs $10k-25k, 58.9% for AGIs $25k-50k, 63.6% for AGIs $50k-75k, 63.0% for AGIs $75k-100k, 73.7% for AGIs over 100k)
Household received Food Stamps/SNAP in the past 12 months: 180 Household did not receive Food Stamps/SNAP in the past 12 months: 5,969
Women who had a birth in the past 12 months: 59 (60 now married, 0 unmarried) Women who did not have a birth in the past 12 months: 2,779 (1,418 now married, 1,362 unmarried)
Housing units in zip code 55436 with a mortgage: 3,018 (611 second mortgage, 513 both second mortgage and home equity loan) Houses without a mortgage: 64
Median monthly owner costs for units with a mortgage: $2,881 Median monthly owner costs for units without a mortgage: $1,077
Residents with income below the poverty level in 2022:
This zip code:
3.1%
Whole state:
9.6%
Residents with income below 50% of the poverty level in 2022:
This zip code:
2.3%
Whole state:
5.2%
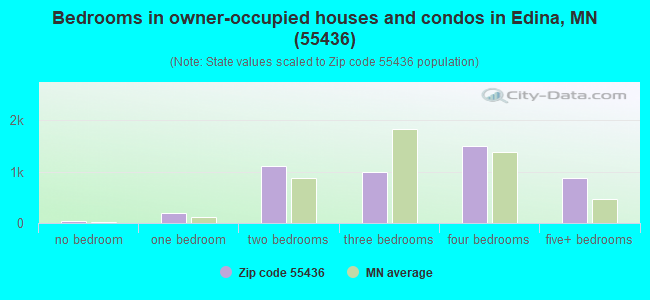
Median number of rooms in houses and condos:
Here:
8.2
State:
7.1
Median number of rooms in apartments:
Here:
4.0
State:
3.8
Notable locations in this zip code not listed on our city pages
Churches in zip code 55436 include: Chapel Hills Church (A), Our Lady of Grace Church (B), Normandale Lutheran Church Edina (C), Good Samaritan United Methodist Church of Edina (D), Colonial Church of Edina (E). Display/hide their locations on the map
Parks in zip code 55436 include: Garden Park (1), Highlands Park (2), Tingdale Park (3), Walnut Ridge Park (4), Bredesen Park (5), Fox Meadow Park (6), Melody Lake Park (7), T Lee Todd Park (8), Birchcrest Park (9). Display/hide their locations on the map
2,701 married couples with children.
265 single-parent households (103 men, 162 women).
92.1% of residents of 55436 zip code speak English at home.
1.3% of residents speak Spanish at home (95% very well, 5% well).
4.8% of residents speak other Indo-European language at home (73% very well, 10% well, 17% not well).
1.5% of residents speak Asian or Pacific Island language at home (53% very well, 47% well).
0.4% of residents speak other language at home (84% very well, 16% well).
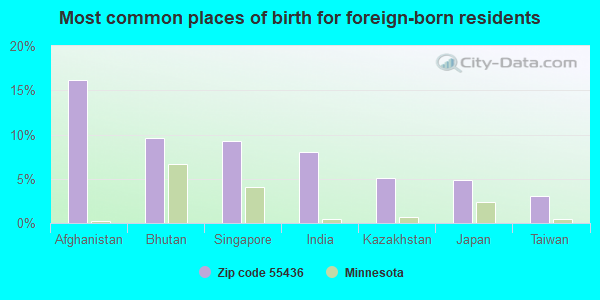
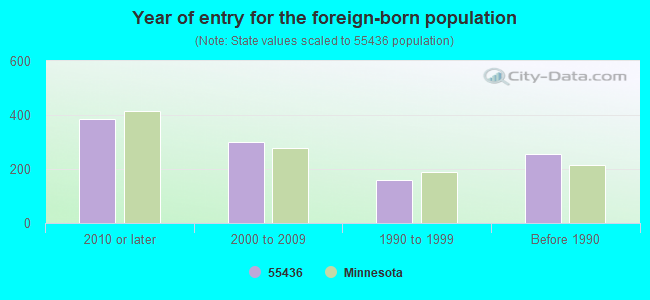
Foreign born population: 962 (6.7%) (65.6% of them are naturalized citizens)
Major facilities with environmental interests located in this zip code:
HIGHLANDS EL. (5505 DONCASTER WAY in EDINA, MN)
(National Center for Education Statistics) - STATE ID-060287687 (National Center for Education Statistics) - STATE ID-010273529 Organizations: INTERMEDIATE SCHOOL DISTRICT 287 (SCHOOL DISTRICT)
, EDINA (SCHOOL DISTRICT)
GRANDVIEW TIRE AND AUTO (5100 VERNON AVE S in EDINA, MN)
STATE MASTER (Minnesota Pollution Control Agency permits and compilance tracking) - RCRAINFO-MND076501733, HAZARDOUS WASTE PROGRAM, RCRIS-MND076501733, (Resource Conservation and Recovery Act (tracking hazardous waste)) Organizations: GRANDVIEW TIRE & AUTO (CONTACT/OWNER)
MINNESOTA WANNER CO (5145 EDEN AVE S in MINNEAPOLIS, MN)
STATE MASTER (Minnesota Pollution Control Agency permits and compilance tracking) - RCRAINFO-MND006479034, SQG, RCRIS-MND006479034, Small Quantity Generators, between 100 kg and 1000 kg of hazardous waste/month (Resource Conservation and Recovery Act (tracking hazardous waste)) - notification Business SIC classification: PUMPS AND PUMPING EQUIPMENT Organizations: WANNER KE (CONTACT/OWNER)
NORMANDALE LUTHERAN CHURCH (6100 NORMANDALE RD in EDINA, MN)
STATE MASTER (Minnesota Pollution Control Agency permits and compilance tracking) - RCRAINFO-MNR000021873, CESQG, RCRIS-MNR000021873, (Resource Conservation and Recovery Act (tracking hazardous waste)) Business SIC and NAICS classification: RELIGIOUS ORGANIZATIONS
NORWEST BANK EDINA NA (5116 VERNON AVE in EDINA, MN)
STATE MASTER (Minnesota Pollution Control Agency permits and compilance tracking) - RCRAINFO-MN0000230193, CESQG, RCRIS-MN0000230193, Conditionally Exempt Small Quantity Generators, less than 100 kg/month of hazardous waste (Resource Conservation and Recovery Act (tracking hazardous waste)) - notification TRANSPORTER (Resource Conservation and Recovery Act (tracking hazardous waste)) - notification Organizations: NORWEST CORPORATION (CONTACT/OWNER)
CHERNE INDUSTRIES INC (5700 LINCOLN DR in MINNEAPOLIS, MN)
STATE MASTER (Minnesota Pollution Control Agency permits and compilance tracking) - RCRAINFO-MND047244900, CESQG, RCRIS-MND047244900, Conditionally Exempt Small Quantity Generators, less than 100 kg/month of hazardous waste (Resource Conservation and Recovery Act (tracking hazardous waste)) - notification Business SIC classification: FABRICATED RUBBER PRODUCTS Business NAICS classification: ALL OTHER RUBBER PRODUCT MANUFACTURING. Organizations: LLOYD G CHERNE (CONTACT/OWNER)
, OATEY CO (CONTACT/OWNER)
EDINA CITY OF (5146 EDEN AVE in EDINA, MN)
STATE MASTER (Minnesota Pollution Control Agency permits and compilance tracking) - RCRAINFO-MND985716968, HAZARDOUS WASTE PROGRAM, RCRIS-MND985716968, Conditionally Exempt Small Quantity Generators, less than 100 kg/month of hazardous waste (Resource Conservation and Recovery Act (tracking hazardous waste)) - notification Business SIC classification: GENERAL AUTOMOTIVE REPAIR SHOPS Business NAICS classification: GENERAL AUTOMOTIVE REPAIR.
EDINA FAMILY PHYSICIANS (5203 VERNON AVE in EDINA, MN)
STATE MASTER (Minnesota Pollution Control Agency permits and compilance tracking) - RCRAINFO-MN0000736777, CESQG, RCRIS-MN0000736777, Conditionally Exempt Small Quantity Generators, less than 100 kg/month of hazardous waste (Resource Conservation and Recovery Act (tracking hazardous waste)) - notification
EDINA PET HOSPITAL PA (5237 EDEN AVE in EDINA, MN)
STATE MASTER (Minnesota Pollution Control Agency permits and compilance tracking) - RCRAINFO-MND985757806, CESQG, RCRIS-MND985757806, Conditionally Exempt Small Quantity Generators, less than 100 kg/month of hazardous waste (Resource Conservation and Recovery Act (tracking hazardous waste)) - notification Business SIC classification: VETERINARY SERVICES FOR ANIMAL SPECIALTIES Business NAICS classification: VETERINARY SERVICES. Organizations: SHEBUSKI DANIEL (CONTACT/OWNER)
HONEYWELL (1625 ZARTHAN AVE S in SAINT LOUIS PARK, MN)
AIR MINOR (AIRS/AFS) TSD (Resource Conservation and Recovery Act (tracking hazardous waste)) TRI REPORTER (Tracking of toxic chemicals releasing facilities) Business SIC classification: SEARCH, DETECTION, NAVIGATION, GUIDANCE, AERONAUTICAL, AND NAUTICAL SYSTEMS AND INSTRUMENTS Alternative names: HONEYWELL MN17-1510 AVIONICS
NO NAME GIVEN (5201 VERNON AVE SO in EDINA, MN)
(Resource Conservation and Recovery Act (tracking hazardous waste)) Organizations: MUELLER JASON (CONTACT/OWNER)
NOONAN CONSTRUCTION (5244 EDEN CIRCLE in EDINA, MN)
(Resource Conservation and Recovery Act (tracking hazardous waste)) Organizations: NOONAN EDWARD (CONTACT/OWNER)
ALAN MJOLSNES DDS (5100 EDEN AVENUE SUITE 210 in EDINA, MN)
Small Quantity Generators, between 100 kg and 1000 kg of hazardous waste/month (Resource Conservation and Recovery Act (tracking hazardous waste)) - notification Organizations: MJOLSNES ALAN (CONTACT/OWNER)
Alternative names: MJOLSNES ALAN DDS
Housing units lacking complete plumbing facilities: 0.2% Housing units lacking complete kitchen facilities: 0.6%
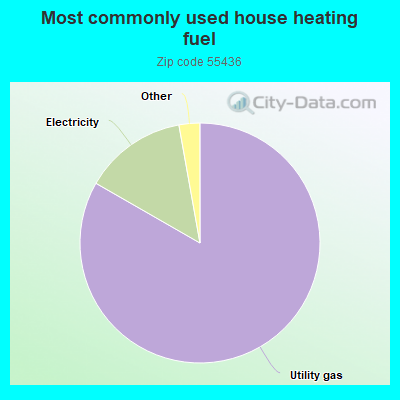
83.3%Utility gas
13.9%Electricity
0.9%Other fuel
0.8%Bottled, tank, or LP gas
0.7%Fuel oil, kerosene, etc.
Population in 1990: 11,750. Population change in the 1990s: +857 (+7.3%).
Place of birth for U.S.-born residents:
This state: 8,123
Northeast: 521
Midwest: 3,212
South: 620
West: 798
64% of the 55436 zip code residents lived in the same house 5 years ago. Out of people who lived in different houses, 68% lived in this county. Out of people who lived in different counties, 50% lived in Minnesota.
88% of the 55436 zip code residents lived in the same house 1 year ago. Out of people who lived in different houses, 66% moved from this county. Out of people who lived in different houses, 13% moved from different county within same state. Out of people who lived in different houses, 13% moved from different state. Out of people who lived in different houses, 5% moved from abroad.
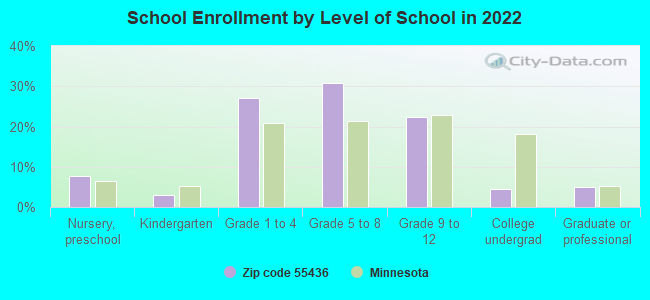
Private vs. public school enrollment:
Students in private schools in grades 1 to 8 (elementary and middle school): 363
Here:
20.5%
Minnesota:
12.9%
Students in private schools in grades 9 to 12 (high school): 121
Here:
17.8%
Minnesota:
8.6%
Students in private undergraduate colleges: 53
Here:
38.3%
Minnesota:
26.2%
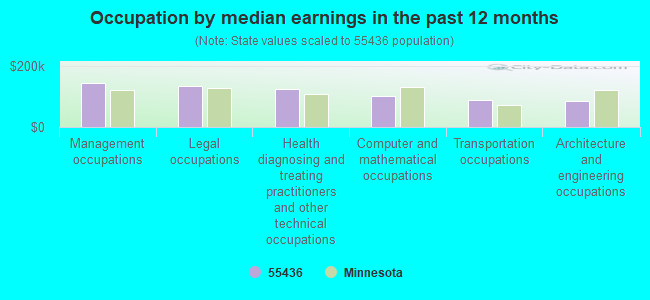
Occupation by median earnings in the past 12 months ($)
144,013Management occupations
135,682Legal occupations
123,087Health diagnosing and treating practitioners and other technical occupations
101,243Computer and mathematical occupations
88,135Transportation occupations
84,866Architecture and engineering occupations
Companies with federal contracts located in this zip code:
ALLIANT TECHSYSTEMS INC (5050 LINCOLN DRIVE in EDINA, MN) : $2,666,488,424 in 1182 contractsfrom 1999 to 2006
Contracts for Ammunition, through 30 mm, Ammunition, 75 mm through 125 mm, Fuzes and Primers, Maintenance, Repair and Rebuilding of Equipment -- Instruments and Laboratory Equipment, and moreby Army, Air Force, Navy, Federal Bureau of Investigation, and others Signed by year:2000: $367,706,118; 2001: $396,716,106; 2002: $266,844,696; 2003: $327,085,359; 2004: $571,199,885; 2005: $462,535,129; 2006: $262,411,292.
Biggest contracts:
$231,330,520 with Army for Ammunition, through 30 mm. Taking place in MO. Signed on 2004-11-24. Completion date: 2008-12-31.
$155,645,317, same as above.Signed on 2005-12-22. Completion date: 2008-12-31.
$133,652,235, same as above.Signed on 2006-02-28. Completion date: 2008-12-31.
$104,015,953 with Army for Ammunition, through 30 mm. Signed on 2000-03-31. Completion date: 2000-12-31.
Top industries in this zip code by the number of employees in 2005:
Finance and Insurance: Direct Health and Medical Insurance Carriers (over 1000 employees: 1 establishment)
Management of Companies and Enterprises: Corporate, Subsidiary, and Regional Managing Offices (100-249: 2, 50-99: 1, 20-49: 2, 1-4: 1)
Other Services (except Public Administration): Religious Organizations (50-99: 2, 20-49: 1, 10-19: 1, 1-4: 2)
Real Estate and Rental and Leasing: Residential Property Managers (100-249: 1, 1-4: 4)
Arts, Entertainment, and Recreation: Golf Courses and Country Clubs (100-249: 1)
Health Care and Social Assistance: Offices of Physicians (except Mental Health Specialists) (50-99: 1, 5-9: 1, 1-4: 2)
Educational Services: Sports and Recreation Instruction (50-99: 1, 1-4: 1)
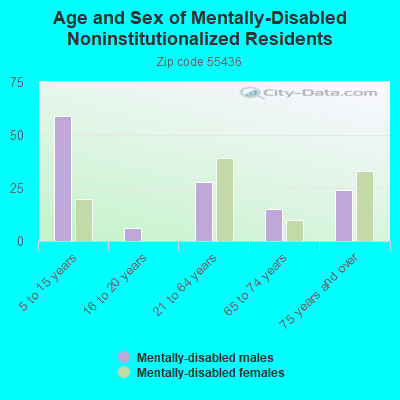
People in group quarters in 2010:
30 people in group homes intended for adults
5 people in residential treatment centers for adults
People in group quarters in 2000:
12 people in homes for the mentally retarded
3 people in other nonhousehold living situations
Fatal accident statistics in 2013:
Fatal accident count: 1
Vehicles involved in fatal accidents: 2
Fatal accidents caused by drunken drivers: 0
Fatalities: 1
Persons involved in fatal accidents: 3
Pedestrians involved in fatal accidents: 0
Fatal accident statistics in 2010:
Fatal accident count: 1
Vehicles involved in fatal accidents: 2
Fatal accidents caused by drunken drivers: 1
Fatalities: 1
Persons involved in fatal accidents: 2
Pedestrians involved in fatal accidents: 0
Home Mortgage Disclosure Act Aggregated Statistics For Year 2009 (Based on 2 full and 4 partial tracts)
A) FHA, FSA/RHS & VA Home Purchase Loans
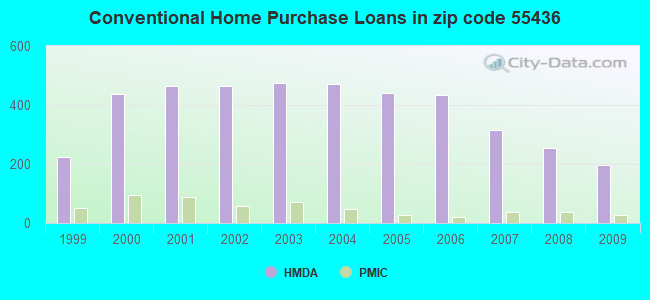
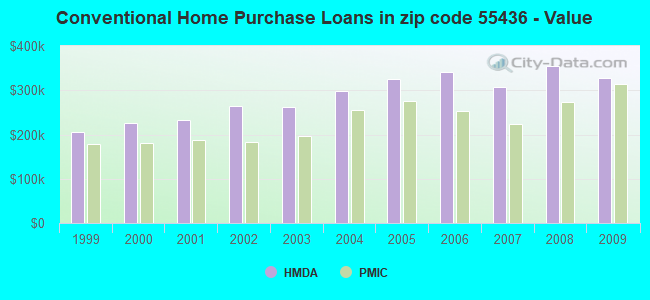
B) Conventional Home Purchase Loans
C) Refinancings
D) Home Improvement Loans
F) Non-occupant Loans on < 5 Family Dwellings (A B C & D)
Number
Average Value
Number
Average Value
Number
Average Value
Number
Average Value
Number
Average Value
LOANS ORIGINATED
47
$231,809
197
$326,825
1,098
$307,037
39
$159,493
30
$271,370
APPLICATIONS APPROVED, NOT ACCEPTED
4
$277,405
8
$613,210
71
$314,785
6
$168,273
0
$0
APPLICATIONS DENIED
6
$239,740
18
$382,078
161
$318,461
16
$142,811
18
$245,347
APPLICATIONS WITHDRAWN
3
$142,687
15
$359,725
120
$303,314
12
$289,360
3
$261,207
FILES CLOSED FOR INCOMPLETENESS
0
$0
3
$326,163
35
$320,771
8
$104,276
2
$63,680
Aggregated Statistics For Year 2008 (Based on 2 full and 4 partial tracts)
A) FHA, FSA/RHS & VA Home Purchase Loans
B) Conventional Home Purchase Loans
C) Refinancings
D) Home Improvement Loans
E) Loans on Dwellings For 5+ Families
F) Non-occupant Loans on < 5 Family Dwellings (A B C & D)
Number
Average Value
Number
Average Value
Number
Average Value
Number
Average Value
Number
Average Value
Number
Average Value
LOANS ORIGINATED
17
$211,488
253
$355,202
351
$332,030
66
$181,044
0
$0
39
$196,727
APPLICATIONS APPROVED, NOT ACCEPTED
2
$211,960
49
$391,960
48
$282,221
20
$39,712
0
$0
6
$135,075
APPLICATIONS DENIED
2
$276,550
20
$716,286
106
$333,154
8
$56,878
2
$454,850
9
$247,438
APPLICATIONS WITHDRAWN
2
$136,455
18
$515,547
53
$305,671
13
$140,105
0
$0
3
$286,323
FILES CLOSED FOR INCOMPLETENESS
2
$135,545
0
$0
15
$223,541
2
$99,680
0
$0
2
$409,685
Aggregated Statistics For Year 2007 (Based on 2 full and 4 partial tracts)
A) FHA, FSA/RHS & VA Home Purchase Loans
B) Conventional Home Purchase Loans
C) Refinancings
D) Home Improvement Loans
F) Non-occupant Loans on < 5 Family Dwellings (A B C & D)
Number
Average Value
Number
Average Value
Number
Average Value
Number
Average Value
Number
Average Value
LOANS ORIGINATED
4
$220,455
314
$307,789
355
$292,277
71
$158,709
40
$265,305
APPLICATIONS APPROVED, NOT ACCEPTED
0
$0
38
$296,703
32
$291,448
13
$222,379
10
$262,550
APPLICATIONS DENIED
0
$0
48
$347,116
164
$309,152
13
$98,097
26
$369,987
APPLICATIONS WITHDRAWN
0
$0
36
$281,326
75
$349,591
7
$288,587
2
$109,165
FILES CLOSED FOR INCOMPLETENESS
0
$0
2
$251,985
21
$361,228
4
$128,185
0
$0
Aggregated Statistics For Year 2006 (Based on 2 full and 4 partial tracts)
A) FHA, FSA/RHS & VA Home Purchase Loans
B) Conventional Home Purchase Loans
C) Refinancings
D) Home Improvement Loans
F) Non-occupant Loans on < 5 Family Dwellings (A B C & D)
Number
Average Value
Number
Average Value
Number
Average Value
Number
Average Value
Number
Average Value
LOANS ORIGINATED
4
$133,070
434
$341,041
426
$338,960
71
$128,924
69
$286,684
APPLICATIONS APPROVED, NOT ACCEPTED
0
$0
23
$481,844
67
$345,034
8
$111,995
8
$229,250
APPLICATIONS DENIED
0
$0
33
$466,217
149
$509,230
21
$92,311
9
$350,566
APPLICATIONS WITHDRAWN
1
$136,950
29
$227,730
101
$448,600
14
$146,469
7
$268,207
FILES CLOSED FOR INCOMPLETENESS
0
$0
4
$112,390
48
$265,687
10
$63,737
2
$272,910
Aggregated Statistics For Year 2005 (Based on 2 full and 4 partial tracts)
A) FHA, FSA/RHS & VA Home Purchase Loans
B) Conventional Home Purchase Loans
C) Refinancings
D) Home Improvement Loans
F) Non-occupant Loans on < 5 Family Dwellings (A B C & D)
Number
Average Value
Number
Average Value
Number
Average Value
Number
Average Value
Number
Average Value
LOANS ORIGINATED
5
$229,386
441
$326,334
587
$342,834
57
$179,826
48
$235,770
APPLICATIONS APPROVED, NOT ACCEPTED
0
$0
42
$277,636
57
$312,841
9
$99,832
3
$146,700
APPLICATIONS DENIED
2
$179,425
40
$394,094
128
$427,543
10
$47,034
13
$191,158
APPLICATIONS WITHDRAWN
0
$0
51
$213,508
126
$328,181
16
$140,776
8
$258,130
FILES CLOSED FOR INCOMPLETENESS
0
$0
24
$226,669
42
$404,228
1
$10,990
0
$0
Aggregated Statistics For Year 2004 (Based on 2 full and 4 partial tracts)
A) FHA, FSA/RHS & VA Home Purchase Loans
B) Conventional Home Purchase Loans
C) Refinancings
D) Home Improvement Loans
F) Non-occupant Loans on < 5 Family Dwellings (A B C & D)
Number
Average Value
Number
Average Value
Number
Average Value
Number
Average Value
Number
Average Value
LOANS ORIGINATED
6
$151,338
470
$297,462
628
$266,090
57
$103,479
55
$253,367
APPLICATIONS APPROVED, NOT ACCEPTED
1
$176,690
40
$365,682
75
$327,005
4
$143,458
6
$173,137
APPLICATIONS DENIED
2
$131,905
53
$219,699
120
$288,634
33
$70,323
11
$175,589
APPLICATIONS WITHDRAWN
0
$0
60
$265,876
113
$287,015
4
$104,815
15
$227,647
FILES CLOSED FOR INCOMPLETENESS
0
$0
8
$441,289
37
$226,086
7
$83,827
0
$0
Aggregated Statistics For Year 2003 (Based on 2 full and 4 partial tracts)
A) FHA, FSA/RHS & VA Home Purchase Loans
B) Conventional Home Purchase Loans
C) Refinancings
D) Home Improvement Loans
F) Non-occupant Loans on < 5 Family Dwellings (A B C & D)
Number
Average Value
Number
Average Value
Number
Average Value
Number
Average Value
Number
Average Value
LOANS ORIGINATED
4
$186,952
474
$263,059
2,281
$254,405
46
$67,422
62
$187,699
APPLICATIONS APPROVED, NOT ACCEPTED
0
$0
36
$306,883
158
$229,349
15
$35,790
12
$215,288
APPLICATIONS DENIED
1
$162,320
34
$169,491
255
$273,167
20
$39,737
15
$141,605
APPLICATIONS WITHDRAWN
0
$0
29
$300,492
213
$216,661
5
$202,462
4
$223,112
FILES CLOSED FOR INCOMPLETENESS
0
$0
7
$572,331
61
$317,371
2
$19,935
2
$272,910
Aggregated Statistics For Year 2002 (Based on 2 full and 4 partial tracts)
A) FHA, FSA/RHS & VA Home Purchase Loans
B) Conventional Home Purchase Loans
C) Refinancings
D) Home Improvement Loans
E) Loans on Dwellings For 5+ Families
F) Non-occupant Loans on < 5 Family Dwellings (A B C & D)
Number
Average Value
Number
Average Value
Number
Average Value
Number
Average Value
Number
Average Value
Number
Average Value
LOANS ORIGINATED
9
$151,404
465
$263,345
1,741
$248,166
36
$54,666
0
$0
72
$237,444
APPLICATIONS APPROVED, NOT ACCEPTED
0
$0
30
$261,253
122
$208,991
18
$60,633
2
$181,940
2
$72,775
APPLICATIONS DENIED
0
$0
23
$205,531
185
$308,239
45
$51,280
0
$0
7
$139,227
APPLICATIONS WITHDRAWN
2
$95,520
68
$238,548
143
$236,361
7
$98,414
0
$0
4
$70,502
FILES CLOSED FOR INCOMPLETENESS
0
$0
6
$154,640
72
$275,501
1
$63,410
0
$0
2
$58,220
Aggregated Statistics For Year 2001 (Based on 2 full and 4 partial tracts)
A) FHA, FSA/RHS & VA Home Purchase Loans
B) Conventional Home Purchase Loans
C) Refinancings
D) Home Improvement Loans
E) Loans on Dwellings For 5+ Families
F) Non-occupant Loans on < 5 Family Dwellings (A B C & D)
Number
Average Value
Number
Average Value
Number
Average Value
Number
Average Value
Number
Average Value
Number
Average Value
LOANS ORIGINATED
16
$207,241
463
$233,825
1,245
$226,550
91
$82,336
18
$81,671
38
$201,526
APPLICATIONS APPROVED, NOT ACCEPTED
0
$0
21
$254,516
89
$226,078
25
$62,467
0
$0
3
$91,560
APPLICATIONS DENIED
0
$0
26
$133,625
117
$172,984
22
$74,529
0
$0
5
$147,620
APPLICATIONS WITHDRAWN
0
$0
24
$451,867
135
$195,464
6
$51,677
0
$0
3
$195,523
FILES CLOSED FOR INCOMPLETENESS
0
$0
6
$118,530
39
$230,225
7
$54,790
0
$0
1
$190,220
Aggregated Statistics For Year 2000 (Based on 2 full and 4 partial tracts)
A) FHA, FSA/RHS & VA Home Purchase Loans
B) Conventional Home Purchase Loans
C) Refinancings
D) Home Improvement Loans
E) Loans on Dwellings For 5+ Families
F) Non-occupant Loans on < 5 Family Dwellings (A B C & D)
Number
Average Value
Number
Average Value
Number
Average Value
Number
Average Value
Number
Average Value
Number
Average Value
LOANS ORIGINATED
8
$102,214
438
$225,603
305
$190,659
123
$60,880
2
$2,387,965
14
$113,276
APPLICATIONS APPROVED, NOT ACCEPTED
0
$0
17
$220,417
43
$174,567
15
$80,545
0
$0
3
$202,943
APPLICATIONS DENIED
2
$97,340
39
$159,832
81
$186,922
26
$79,802
0
$0
3
$289,453
APPLICATIONS WITHDRAWN
0
$0
24
$281,752
54
$173,964
2
$231,975
0
$0
0
$0
FILES CLOSED FOR INCOMPLETENESS
1
$114,130
0
$0
32
$197,075
0
$0
0
$0
2
$11,960
Aggregated Statistics For Year 1999 (Based on 1 full and 2 partial tracts)
A) FHA, FSA/RHS & VA Home Purchase Loans
B) Conventional Home Purchase Loans
C) Refinancings
D) Home Improvement Loans
F) Non-occupant Loans on < 5 Family Dwellings (A B C & D)
2002 - 2018 National Fire Incident Reporting System (NFIRS) incidents
Based on the data from the years 2002 - 2018 the average number of fire incidents per year is 24. The highest number of reported fire incidents - 38 took place in 2006, and the least - 15 in 2017. The data has a declining trend.
When looking into fire subcategories, the most reports belonged to: Structure Fires (60.9%), and Outside Fires (21.5%).
Fire incident types reported to NFIRS in Zip Code 55436
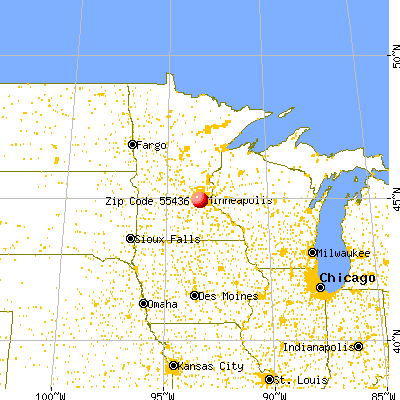


 Nearest zip codes: 55424, 55439, 55343, 55435, 55410, 55426.


 Based on the data from the years 2002 - 2018 the average number of fire incidents per year is 24. The highest number of reported fire incidents - 38 took place in 2006, and the least - 15 in 2017. The data has a declining trend.
 When looking into fire subcategories, the most reports belonged to: Structure Fires (60.9%), and Outside Fires (21.5%).