Bryant neighborhood in Minneapolis, Minnesota (MN), 55407, 55409 detailed profile
Settings
X

Business Search - 14 Million verified businesses
Area: 0.298 square miles
Population: 2,775
Population density:
| Bryant: | 9,303 people per square mile |
| Minneapolis: | 7,744 people per square mile |

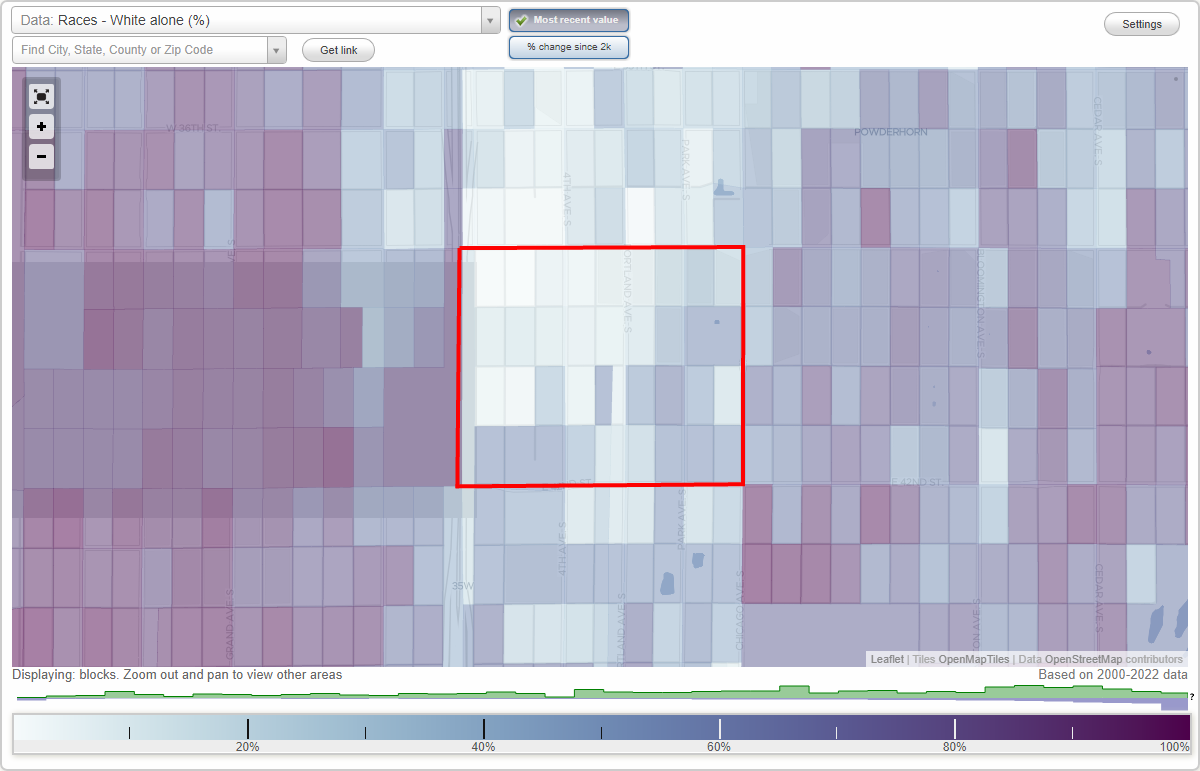
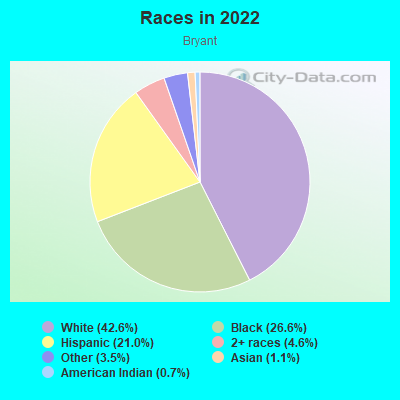
- 1,23442.6%White
- 77026.6%Black
- 60921.0%Hispanic or Latino
- 1324.6%Two or more races
- 1013.5%Some other race
- 311.1%Asian
- 190.7%American Indian
Median household income in 2022:
| Bryant: | $104,221 |
| Minneapolis: | $74,473 |
Distribution of median household income
![Distribution of median household income]()
- 40Less than $10,000
- 168$10,000 to $19,999
- 108$20,000 to $29,999
- 53$30,000 to $39,999
- 120$40,000 to $49,999
- 46$50,000 to $59,999
- 179$60,000 to $74,999
- 187$75,000 to $99,999
- 92$100,000 to $124,999
- 71$125,000 to $149,999
- 184$150,000 to $199,999
- 75$200,000 or more

Distribution of owner-occupied house/condo value
![Distribution of owner-occupied house/condo value]()
- 69Less than $50,000
- 23$50,000 to $99,999
- 35$100,000 to $149,999
- 94$150,000 to $199,999
- 158$200,000 to $249,999
- 158$250,000 to $299,999
- 325$300,000 to $399,999
- 24$400,000 to $499,999
- 165$500,000 to $749,999
- 31$750,000 to $999,999
- 33$1,000,000 or more

Distribution of rent paid by renters
![Distribution of rent paid by renters]()
- 50Less than $100
- 40$200 to $299
- 70$500 to $599
- 35$600 to $699
- 10$700 to $799
- 45$800 to $899
- 15$900 to $999
- 140$1,000 to $1,249
- 74$1,250 to $1,499
- 48$1,500 to $1,999
- 49$2,000 or more

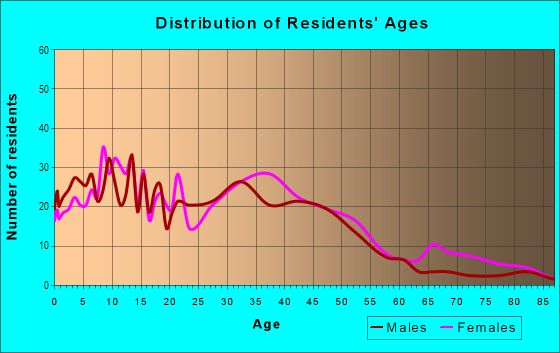
| Males: | 1,461 |
| Females: | 1,314 |
Males:
| This neighborhood: | 36.6 years |
| Whole city: | 33.3 years |
| This neighborhood: | 38.2 years |
| Whole city: | 33.2 years |
Average household size:
| Bryant: | 2.7 people |
| Minneapolis: | 2.1 people |
Percentage of family households:
| Bryant: | 66.2% |
| Minneapolis: | 34.1% |
| Here: | 51.5% |
| Minneapolis: | 29.8% |
Percentage of married-couple families with children (among all households):
| Bryant: | 24.2% |
| Minneapolis: | 31.8% |
Percentage of single-mother households (among all households):
| Bryant: | 4.3% |
| Minneapolis: | 10.5% |
Percentage of never married males 15 years old and over:
Percentage of never married females 15 years old and over:
| Bryant: | 24.1% |
| Minneapolis: | 27.0% |
Percentage of never married females 15 years old and over:
| Bryant: | 13.5% |
| city: | 25.4% |
Percentage of people that speak English not well or not at all:
| Bryant: | 14.4% |
| Minneapolis: | 3.8% |
Percentage of people born in this state:
Percentage of people born in another U.S. state:
Percentage of native residents but born outside the U.S.:
Percentage of foreign born residents:
| Here: | 48.2% |
| Minneapolis: | 51.9% |
Percentage of people born in another U.S. state:
| Bryant: | 27.9% |
| Minneapolis: | 31.8% |
Percentage of native residents but born outside the U.S.:
| Here: | 1.9% |
| city: | 1.5% |
Percentage of foreign born residents:
| Here: | 22.0% |
| Minneapolis: | 14.7% |
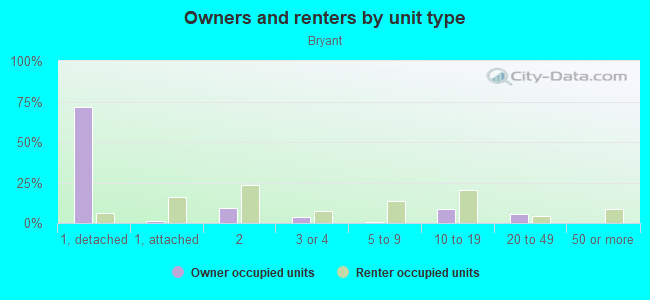
Owner-occupied
Renter-occupied

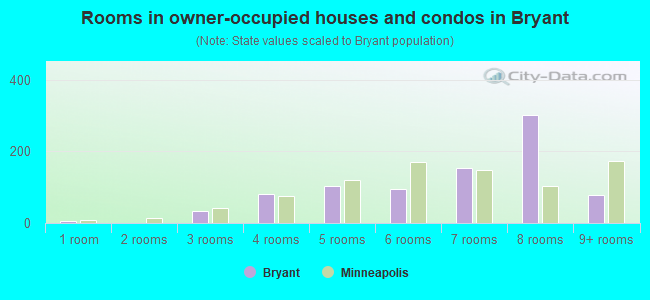
- Rooms in owner-occupied houses and condos in Bryant
- 61 room
- 02 rooms
- 343 rooms
- 804 rooms
- 1045 rooms
- 956 rooms
- 1537 rooms
- 3028 rooms
- 799+ rooms
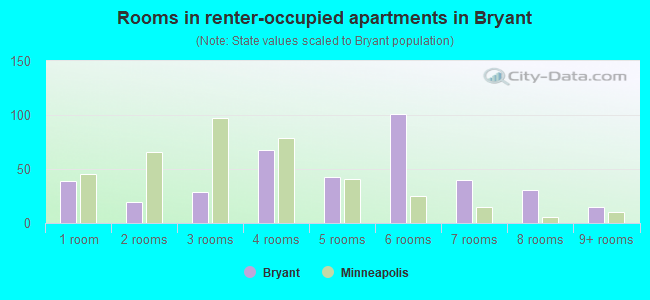
- Rooms in renter-occupied apartments in Bryant
- 391 room
- 192 rooms
- 293 rooms
- 684 rooms
- 435 rooms
- 1016 rooms
- 407 rooms
- 318 rooms
- 159+ rooms
Owner-occupied
Renter-occupied
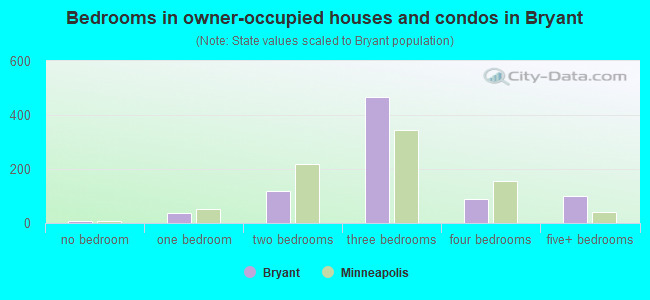
- Bedrooms in owner-occupied houses and condos in Bryant
- 6no bedroom
- 361 bedroom
- 1202 bedrooms
- 4683 bedrooms
- 884 bedrooms
- 1015+ bedrooms
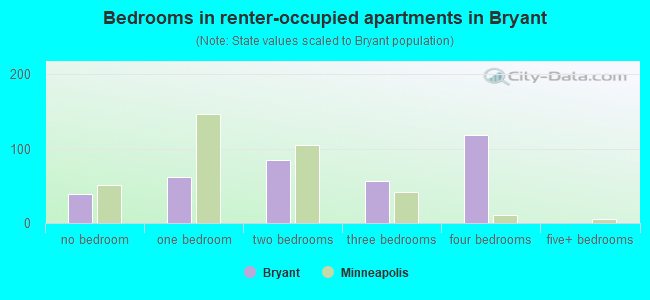
- Bedrooms in renter-occupied apartments in Bryant
- 39no bedroom
- 621 bedroom
- 842 bedrooms
- 573 bedrooms
- 1184 bedrooms
- 05+ bedrooms
Average number of cars or other vehicles available in houses/condos:
Average number of cars or other vehicles available in apartments:
| This neighborhood: | 1.9 |
| Minneapolis: | 1.6 |
Average number of cars or other vehicles available in apartments:
| Here: | 1.4 |
| city: | 1.1 |
Percentage of units with a mortgage:
| Bryant: | 79.5% |
| Minneapolis: | 71.8% |
Average estimated value of detached houses in 2022 (76.3% of all units):
| Bryant: | $371,269 |
| Minnesota: | $374,552 |
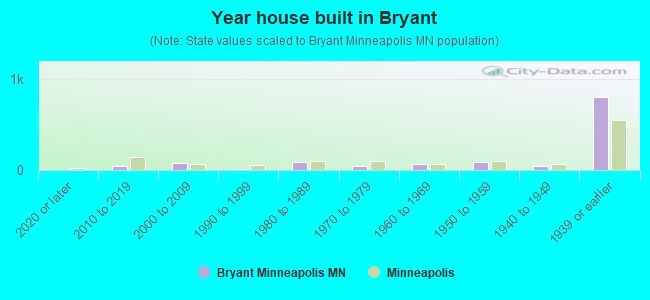
- Year house built in Bryant
- 02020 or later
- 492010 to 2019
- 802000 to 2009
- 151990 to 1999
- 861980 to 1989
- 411970 to 1979
- 681960 to 1969
- 881950 to 1959
- 481940 to 1949
- 7951939 or earlier
City-data.com crime index for city in 2020 (higher means more crime):
| City: | 600.2 |
| U.S. average: | 219.5 |
Travel time to work (commute)
![Travel time to work (commute)]()
- 112Less than 5 minutes
- 1125 to 9 minutes
- 15610 to 14 minutes
- 17515 to 19 minutes
- 31520 to 24 minutes
- 21525 to 29 minutes
- 30730 to 34 minutes
- 10035 to 39 minutes
- 3240 to 44 minutes
- 19945 to 59 minutes
- 3360 to 89 minutes
- 4190 or more minutes

Means of transportation to work
![Means of transportation to work]()
- 67.3%1,065Drove a car alone
- 5.5%87Carpooled
- 14.5%230Bus
- 1.0%16Light rail, streetcar or trolley
- 2.8%44Taxi
- 2.5%40Motorcycle
- 3.2%50Bicycle
- 2.0%31Walked
- 2.1%34Other means
- 9.5%151Worked at home

Time leaving home to go to work
![Time leaving home to go to work]()
- 3112:00 a.m. to 4:59 a.m.
- 485:00 a.m. to 5:29 a.m.
- 245:30 a.m. to 5:59 a.m.
- 1896:00 a.m. to 6:29 a.m.
- 1526:30 a.m. to 6:59 a.m.
- 1047:00 a.m. to 7:29 a.m.
- 2617:30 a.m. to 7:59 a.m.
- 2158:00 a.m. to 8:29 a.m.
- 968:30 a.m. to 8:59 a.m.
- 1779:00 a.m. to 9:59 a.m.
- 4310:00 a.m. to 10:59 a.m.
- 911:00 a.m. to 11:59 a.m.
- 13212:00 p.m. to 3:59 p.m.
- 724:00 p.m. to 11:59 p.m.

Occupations of males:
- Percentage of males in management occupations (except farmers):
Here: 7.5% city: 12.1%
- Percentage of males in business and financial operations occupations:
Here: 15.3% city: 9.1%
- Percentage of males in computer and mathematical occupations:
Here: 12.8% city: 8.4%
- Percentage of males in architecture and engineering occupations:
Here: 2.7% city: 4.6%
- Percentage of males in community and social services occupations:
Here: 4.0% city: 1.8%
- Percentage of males in education, training, and library occupations:
Here: 3.3% city: 5.2%
- Percentage of males in arts, design, entertainment, sports, and media occupations:
Here: 7.3% city: 4.0%
- Percentage of males in healthcare practitioners and technical occupations:
Here: 2.0% city: 3.6%
- Percentage of males in service occupations:
Here: 17.3% city: 12.6%
- Percentage of males in sales and office occupations:
Here: 5.1% city: 15.3%
- Percentage of males in farming, fishing, and forestry occupations:
Here: 3.2% city: 0.3%
- Percentage of males in construction, extraction, and maintenance occupations:
Here: 2.1% city: 3.3%
- Percentage of males in production occupations:
Here: 3.1% city: 5.8%
- Percentage of males in transportation occupations:
Here: 1.6% city: 4.1%
- Percentage of males in material moving occupations:
Here: 6.4% city: 3.6%
Occupations of females:
- Percentage of females in management occupations (except farmers):
Here: 17.7% city: 11.4%
- Percentage of females in business and financial operations occupations:
Here: 3.0% city: 9.8%
- Percentage of females in computer and mathematical occupations:
Here: 1.2% city: 2.6%
- Percentage of females in community and social services occupations:
Here: 5.7% city: 3.8%
- Percentage of females in education, training, and library occupations:
Here: 13.5% city: 10.6%
- Percentage of females in arts, design, entertainment, sports, and media occupations:
Here: 1.7% city: 5.6%
- Percentage of females in healthcare practitioners and technical occupations:
Here: 3.5% city: 8.3%
- Percentage of females in service occupations:
Here: 25.5% city: 17.8%
- Percentage of females in sales and office occupations:
Here: 19.7% city: 18.7%
- Percentage of females in production occupations:
Here: 5.3% city: 2.7%
- Percentage of females in transportation occupations:
Here: 3.2% city: 0.9%
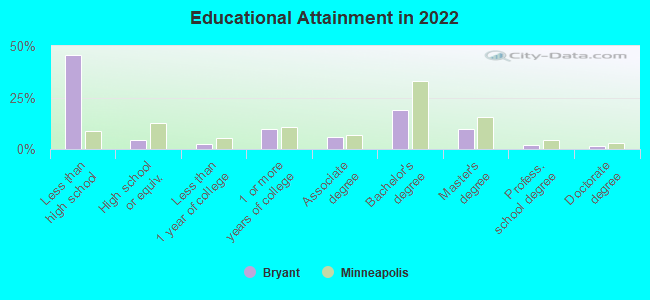
Education in this neighborhood (subdivision or community):
- Percentage of people 3 years and older in K-12 schools:
Bryant: 20.9% Minneapolis: 14.0%
- Percentage of people 3 years and older in undergraduate colleges:
Bryant: 3.7% Minneapolis: 8.6%
- Percentage of people 3 years and older in grad. or professional schools:
Bryant: 0.9% Minneapolis: 2.9%
- Percentage of students K-12 enrolled in private schools:
Bryant: 33.5% Minneapolis: 14.1%
Percentage of population below poverty level:
| Bryant: | 12.8% |
| Minneapolis: | 17.2% |
Median year owner moved in (as recorded in 2022):
| Bryant: | 2003 |
| Minneapolis: | 2012 |
Percentage of married-couple families with both working:
| Bryant: | 72.4% |
| Minneapolis: | 73.9% |
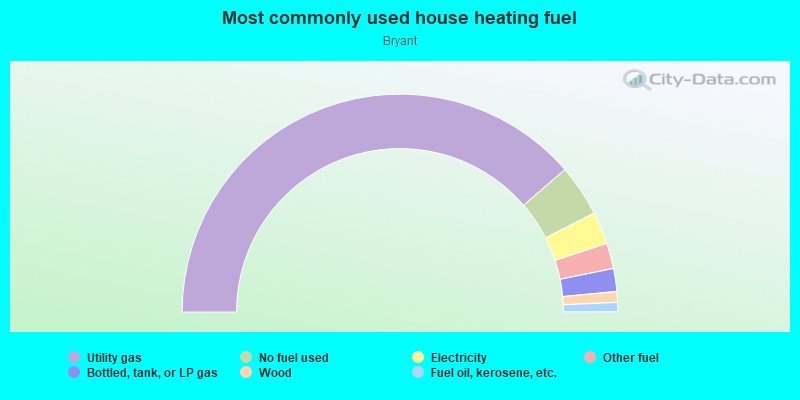
- 77.4%Utility gas
- 7.7%No fuel used
- 4.8%Electricity
- 3.8%Other fuel
- 3.4%Bottled, tank, or LP gas
- 1.6%Wood
- 1.4%Fuel oil, kerosene, etc.
Roads and streets:
E 39th St
Length: 0.80 miles
Direction: E-W
Address range: 200 to 799
Direction: E-W
Address range: 200 to 799
E 40th St
Length: 0.80 miles
Direction: E-W
Address range: 200 to 799
Direction: E-W
Address range: 200 to 799
E 41st St
Length: 0.79 miles
Direction: E-W
Address range: 200 to 799
Direction: E-W
Address range: 200 to 799
E 42nd St
Length: 0.61 miles
Directions: E-W, SW-NE
Address range: 200 to 799
Directions: E-W, SW-NE
Address range: 200 to 799
4th Ave S
Length: 0.37 miles
Directions: N-S, SW-NE
Address range: 3900 to 4199
Directions: N-S, SW-NE
Address range: 3900 to 4199
2nd Ave S
Length: 0.37 miles
Direction: N-S
Address range: 3900 to 4199
Direction: N-S
Address range: 3900 to 4199
3rd Ave S
Length: 0.37 miles
Direction: N-S
Address range: 3900 to 4199
Direction: N-S
Address range: 3900 to 4199
5th Ave S
Length: 0.37 miles
Direction: N-S
Address range: 3900 to 4199
Direction: N-S
Address range: 3900 to 4199
Co Rd 35 (Portland Ave S)
Length: 0.37 miles
Directions: N-S, SE-NW
Address range: 3900 to 4199
Directions: N-S, SE-NW
Address range: 3900 to 4199
Oakland Ave S
Length: 0.37 miles
Direction: N-S
Address range: 3900 to 4199
Direction: N-S
Address range: 3900 to 4199
Park Ave S (Co Rd 33)
Length: 0.37 miles
Directions: N-S, SW-NE
Address range: 3900 to 4199
Directions: N-S, SW-NE
Address range: 3900 to 4199
Clinton Ave S
Length: 0.33 miles
Directions: N-S, SE-NW
Address range: 3900 to 4199
Directions: N-S, SE-NW
Address range: 3900 to 4199
Columbus Ave S
Length: 0.25 miles
Direction: N-S
Address range: 4000 to 4199
Direction: N-S
Address range: 4000 to 4199
Chicago Ave S
Length: 0.12 miles
Directions: N-S, SW-NE
Address range: 4100 to 4199
Directions: N-S, SW-NE
Address range: 4100 to 4199