| Fire incidents reported |
|---|
| Sreet name | Count |
|---|
| SHEPARD RD | 132 | | GREENWOODS RD | 74 | | LITCHFIELD RD | 56 | | NORTH ST | 40 | | MOUNTAIN RD | 30 | | WEST SIDE RD | 24 | | STATION PL | 22 | | GOLF DR | 20 | | LAUREL WAY | 18 | | HIGHFIELD RD | 14 | | ASHPOHTAG RD | 12 | | SUNSET RIDGE RDG | 12 | | BRUEY RD | 10 | | DOOLITTLE DR | 10 | | MAPLE AVE | 10 | | COLEBROOK RD | 8 | | WINCHESTER RD | 8 | | EMERSON ST | 6 | | LAUREL WAY EXT | 6 | | LOONMEADOW DR | 6 | | RIVER PL | 6 | | TERRACE VW | 6 | | ESTEY RD | 4 | | ESTEY RD | 4 | | GOSHEN EAST ST | 4 |
| | | Fire incidents reported |
|---|
| Sreet name | Count |
|---|
| GRANTVILLE RD | 4 | | MEEKER TOWN RD | 4 | | PARKER HILL RD | 4 | | SCHOOL HOUSE RD | 4 | | SUNSET HILL RD | 4 | | TOWER HILL RD | 4 | | VALLEY VIEW RD | 4 | | ASHPOHTAG RD | 2 | | ASHPOHTAG ROAD RD | 2 | | ASHPOTAUG RD | 2 | | BERRY ROAD | 2 | | BLACKBERRY ST | 2 | | CANAAN VALLEY RD | 2 | | CREAM HILL RD | 2 | | DEERFIELD RD | 2 | | ELMORE RD | 2 | | GAMEFIELDPVT RD | 2 | | GOLF DR | 2 | | GRANT ST | 2 | | GREEN WOODS ROAD EAST | 2 | | HIGHVIEW DR | 2 | | JOHN CURTISS RD | 2 | | LITCHFIELD | 2 | | LITCHFIELD RD. | 2 | | |
|
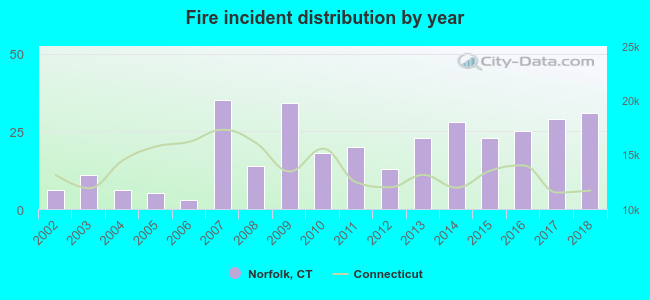 Based on the data from the years 2002 - 2018 the average number of fire incidents per year is 19. The highest number of fire incidents - 35 took place in 2007, and the least - 3 in 2006. The data has an increasing trend.
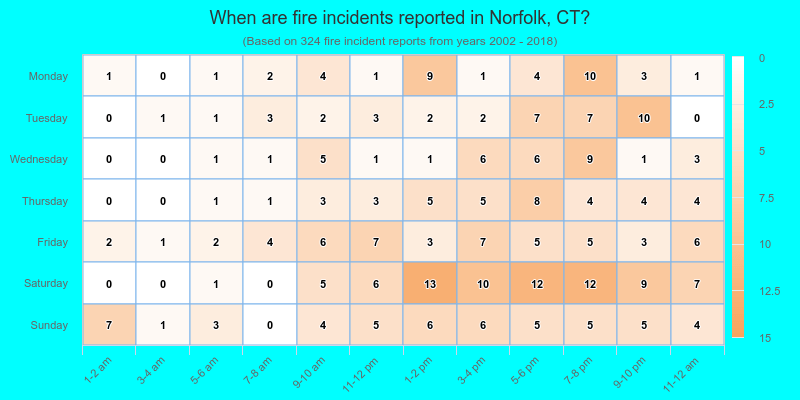
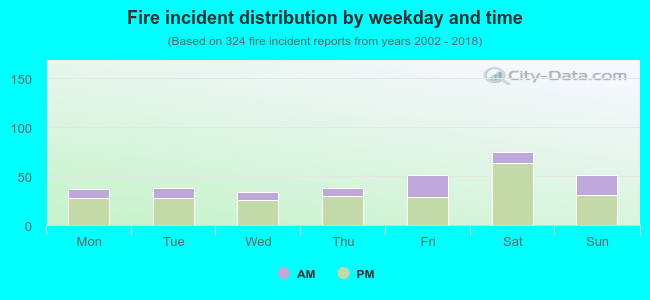 27.5% incidents where reported in the morning and 72.5% in the evening. The most fires (23.1%) took place on Saturday, and the least (10.5%) on Wednesday.
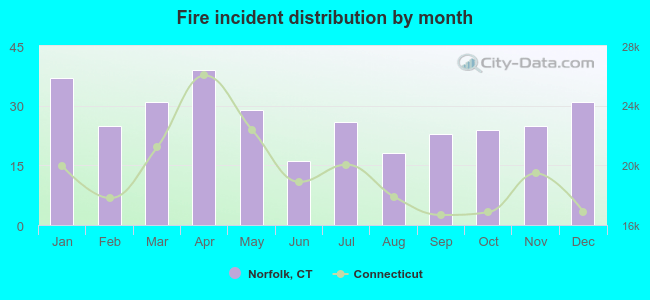 Based on the 324 fire incident reports from years 2002 - 2018 most fires (12.0%) took place during April, and the least (4.9%) in June.
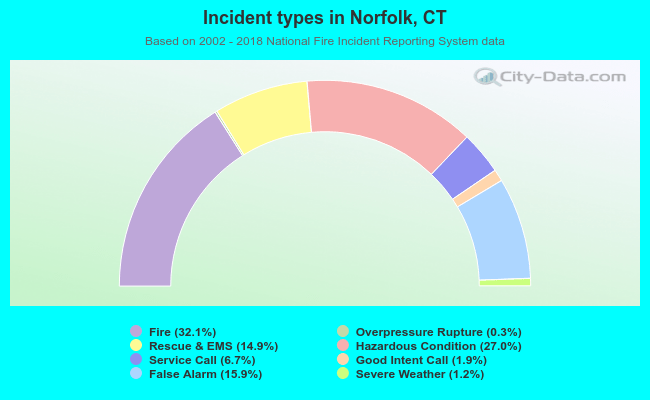 Out of all 1,010 cases reported during the years 2002 - 2018, the most belonged to the categories: Fire (32.1%), Hazardous Condition (27.0%), and False Alarm (15.9%).
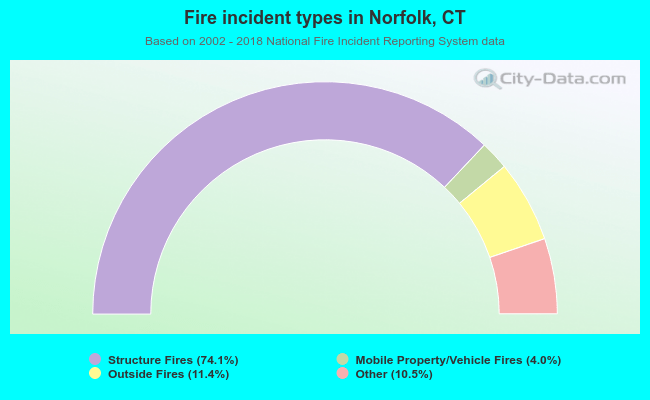 When looking into fire subcategories, the most reports belonged to: Structure Fires (74.1%), and Outside Fires (11.4%).