Poplar Bluff: Fire Incidents, Missouri (MO)
Where are fire incidents reported in Poplar Bluff, MO
Something went wrong! Please refresh the page.
| Fire incidents reported | |
|---|---|
| Sreet name | Count |
| WESTWOOD BLVD | 306 |
| HWY 53 | 150 |
| HWY B | 146 |
| MAIN ST | 120 |
| HWY 142 | 106 |
| HWY T | 104 |
| 11TH ST | 82 |
| HWY 67 | 82 |
| CR 450 | 80 |
| HWY PP | 78 |
| BROADWAY ST | 74 |
| B ST | 72 |
| CR 309 | 72 |
| CR 606 | 68 |
| HWY 60 | 68 |
| HWY W | 68 |
| HARPER ST | 66 |
| 10TH ST | 64 |
| C ST | 64 |
| D ST | 64 |
| HWY M | 64 |
| PINE ST | 60 |
| 53 HWY | 58 |
| CR 523 | 56 |
| HENRY ST | 54 |
| HWY AA | 54 |
| SPRING ST | 54 |
| ALICE ST | 52 |
| CR 605 | 52 |
| HWY 67 SOUTH | 52 |
| Other | 2,174 |
2002 - 2018 National Fire Incident Reporting System (NFIRS) incidents
- Incident types reported to NFIRS in Poplar Bluff, MO
- 4,66446.0%Fire
- 1,45814.4%Hazardous Condition
- 1,45114.3%Service Call
- 1,06810.5%Good Intent Call
- 8898.8%False Alarm
- 5855.8%Rescue & EMS
- 130.1%Overpressure Rupture
- Fire incident types reported to NFIRS in Poplar Bluff, MO
- 2,02043.3%Outside Fires
- 1,75237.6%Structure Fires
- 84218.1%Mobile Property/Vehicle Fires
- 501.1%Other
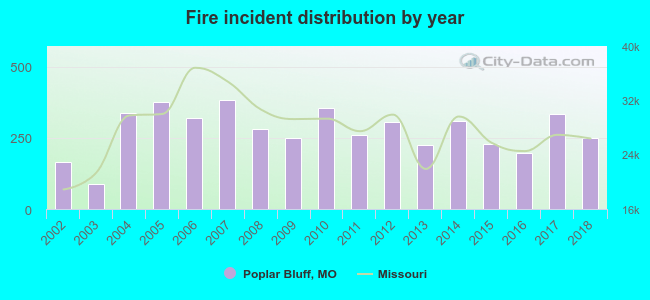 Based on the data from the years 2002 - 2018 the average number of fires per year is 274. The highest number of reported fires - 382 took place in 2007, and the least - 88 in 2003. The data has a rising trend.
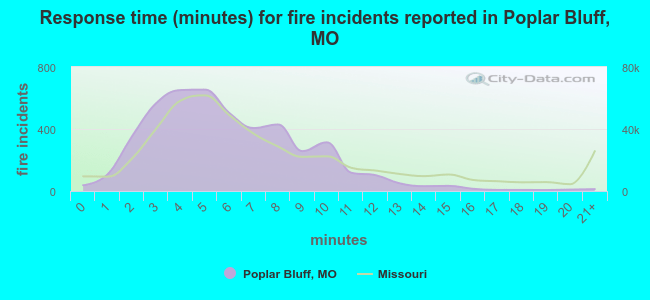 The median response time based on all reported fire incidents is 5 minutes. This is lower compared to the state median value.
The median response time in Poplar Bluff, MO compared to nearest cities:
(Note: Based on data for all years, including only cities with at least 500 fire incidents)
| Poplar Bluff: | 5 minutes |
| Dexter: | 4 minutes |
| Malden: | 4 minutes |
| Rector: | 7 minutes |
| Kennett: | 3 minutes |
| Portageville: | 9 minutes |
| Ellington: | 11 minutes |
| Sikeston: | 5 minutes |
| Pocahontas: | 5 minutes |
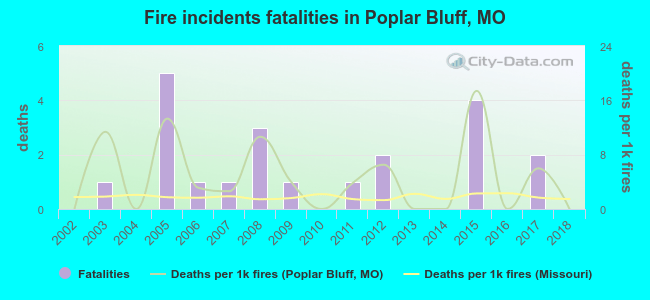 Based on the data from the years 2002 - 2018 the average number of fire-related yearly deaths is 1. The highest number of reported deaths - 5 took place in 2005, and the lowest - 0 in 2002. The data has a constant trend.
The average number of fatalities per 1,000 fires is 5. This indicator was the highest - 17 in 2015, and the lowest 0 in 2002. The trend for fatalities per 1,000 fires is declining. Compared to the Missouri value the number of fatalities per 1,000 fires is much higher.
Based on the data from the years 2002 - 2018 the average number of fire-related yearly deaths is 1. The highest number of reported deaths - 5 took place in 2005, and the lowest - 0 in 2002. The data has a constant trend.
The average number of fatalities per 1,000 fires is 5. This indicator was the highest - 17 in 2015, and the lowest 0 in 2002. The trend for fatalities per 1,000 fires is declining. Compared to the Missouri value the number of fatalities per 1,000 fires is much higher.Deaths per 1,000 incidents in Poplar Bluff, MO compared to nearest cities:
(Note: Based on data for all years, including only cities with at least 2,500 fire incidents)
| Poplar Bluff: | 4.5 |
| Sikeston: | 2.7 |
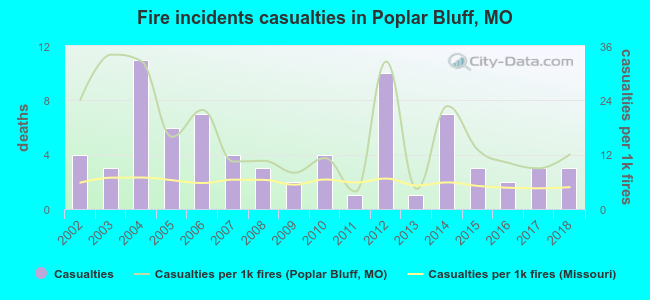 According to the reports from the years 2002 - 2018 the average number of fire-related casualties per year is 4. The highest number of reported injuries - 11 took place in 2004, and the lowest - 1 in 2011. The data has a decreasing trend.
The average number of casualties per 1,000 fire incidents is 16. This indicator was the highest - 34 in 2003, and the lowest 4 in 2011. The trend for injuries per 1,000 incidents is declining. Compared to the Missouri value the number of casualties per 1,000 fires is much higher.
According to the reports from the years 2002 - 2018 the average number of fire-related casualties per year is 4. The highest number of reported injuries - 11 took place in 2004, and the lowest - 1 in 2011. The data has a decreasing trend.
The average number of casualties per 1,000 fire incidents is 16. This indicator was the highest - 34 in 2003, and the lowest 4 in 2011. The trend for injuries per 1,000 incidents is declining. Compared to the Missouri value the number of casualties per 1,000 fires is much higher.Casualties per 1,000 incidents in Poplar Bluff, MO compared to nearest cities:
(Note: Based on data for all years, including only cities with at least 500 fire incidents)
| Poplar Bluff: | 15.9 |
| Dexter: | 1.0 |
| Malden: | 0.0 |
| Rector: | 17.6 |
| Kennett: | 27.5 |
| Portageville: | 0.0 |
| Ellington: | 1.9 |
| Sikeston: | 11.2 |
| Pocahontas: | 1.2 |
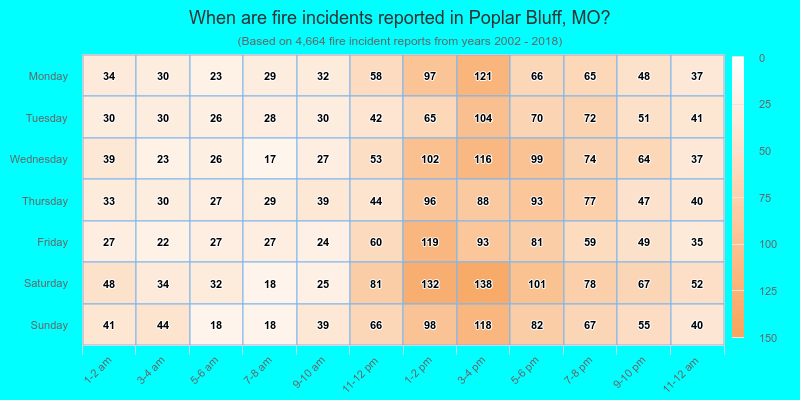
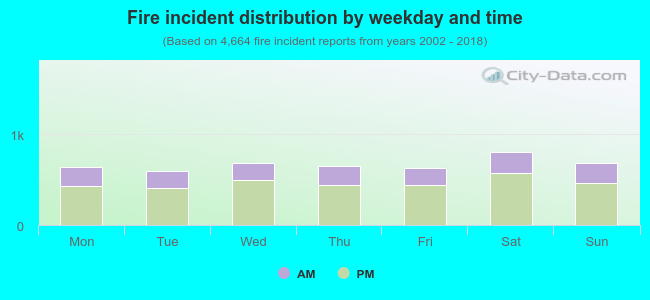 30.7% incidents where reported in the morning and 69.3% in the evening. The most fires (17.3%) took place on Saturday, and the least (12.6%) on Tuesday.
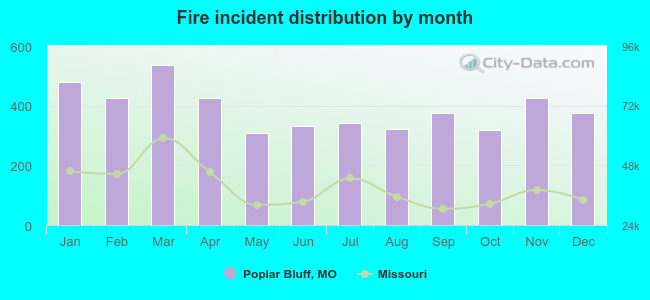 Based on the 4,664 fires from years 2002 - 2018 most fires (11.5%) took place during March, and the least (6.6%) in May.
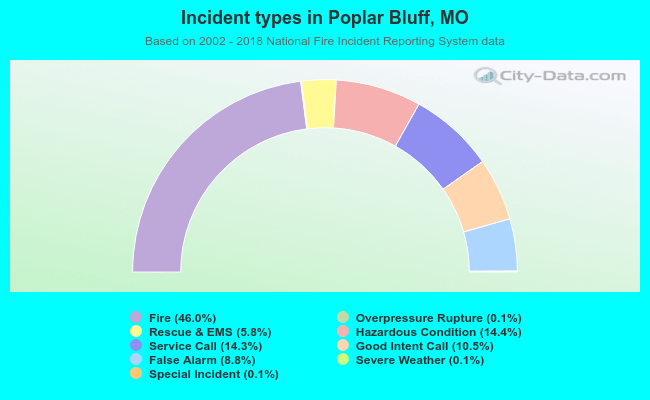 Out of all 10,142 cases reported during the years 2002 - 2018, the most belonged to the categories: Fire (46.0%), Hazardous Condition (14.4%), and Service Call (14.3%).
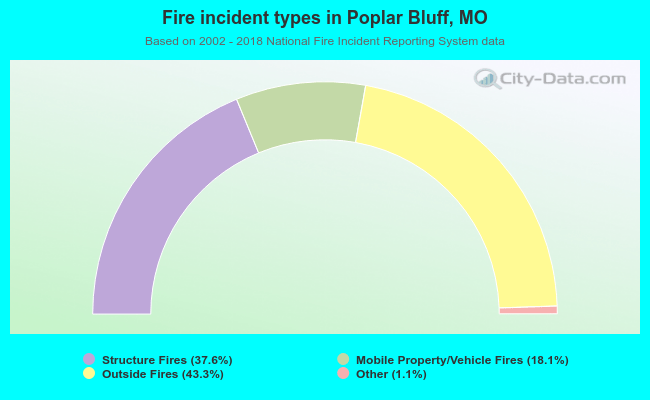 When looking into fire subcategories, the most reports belonged to: Outside Fires (43.3%), and Structure Fires (37.6%).