Port Barre: Fire Incidents, Louisiana (LA)
Where are fire incidents reported in Port Barre, LA
Something went wrong! Please refresh the page.
|
| |||||||||||||||||||||||||||||||||||||||||||||||||||||||||||||||||||||||||||||||||||||||||||||||||||||||||||||
2002 - 2017 National Fire Incident Reporting System (NFIRS) incidents
- Incident types reported to NFIRS in Port Barre, LA
- 45750.1%Fire
- 22724.9%Hazardous Condition
- 667.2%Good Intent Call
- 586.4%Rescue & EMS
- 465.0%False Alarm
- 363.9%Service Call
- 141.5%Overpressure Rupture
- 80.9%Special Incident
- 10.1%Severe Weather
- Fire incident types reported to NFIRS in Port Barre, LA
- 23852.1%Outside Fires
- 11424.9%Structure Fires
- 5612.3%Mobile Property/Vehicle Fires
- 4910.7%Other
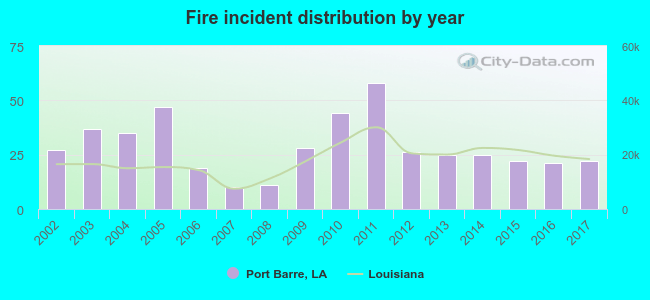 Based on the data from the years 2002 - 2017 the average number of fires per year is 29. The highest number of fire incidents - 58 took place in 2011, and the least - 10 in 2007. The data has a declining trend.
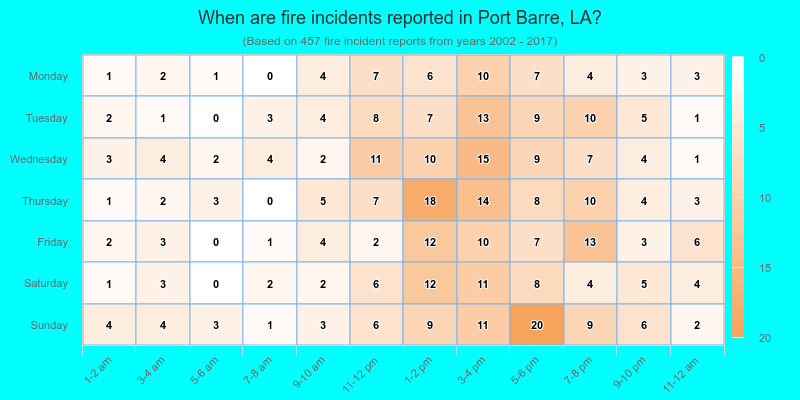
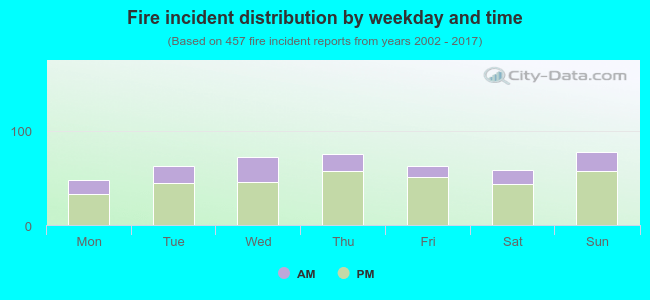 27.1% incidents where reported in the morning and 72.9% in the evening. The most fires (17.1%) took place on Sunday, and the least (10.5%) on Monday.
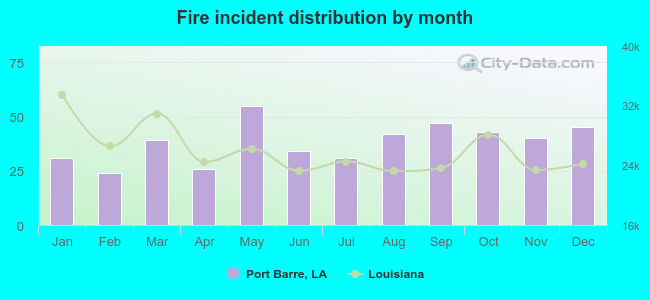 According to the 457 fire incident reports from years 2002 - 2017 most fires (12.0%) took place during May, and the least (5.3%) in February.
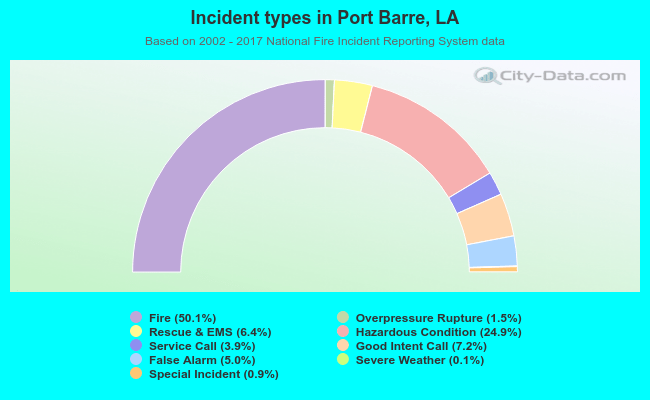 Out of all 913 cases reported during the years 2002 - 2017, the most belonged to the categories: Fire (50.1%), Hazardous Condition (24.9%), and Good Intent Call (7.2%).
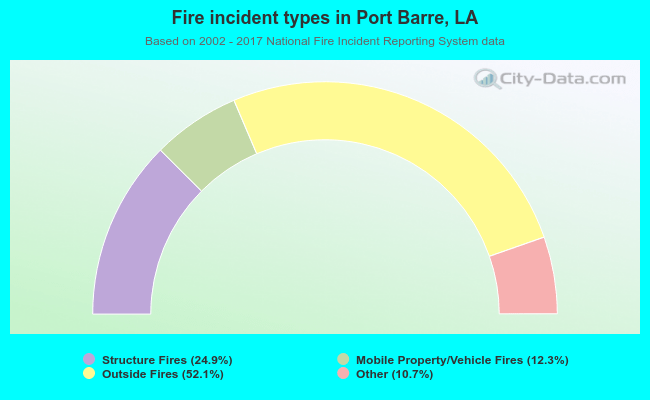 When looking into fire subcategories, the most incidents belonged to: Outside Fires (52.1%), and Structure Fires (24.9%).