Portland: Fire Incidents, Connecticut (CT)
Where are fire incidents reported in Portland, CT
Something went wrong! Please refresh the page.
| Fire incidents reported | |
|---|---|
| Sreet name | Count |
| MAIN ST | 192 |
| MARLBOROUGH ST | 54 |
| HIGH ST | 44 |
| PORTLAND-COBALT RD | 44 |
| AIRLINE AVE | 40 |
| PENFIELD HILL RD | 32 |
| FREESTONE AVE | 28 |
| BROWNSTONE AVE | 26 |
| COX RD | 26 |
| GLASTONBURY TPKE | 26 |
| COMMERCE ST | 24 |
| OLD MARLBOROUGH TPKE | 22 |
| MULFORD RD | 20 |
| PORTLANDCOBALT RD | 20 |
| CHATHAM CT | 18 |
| SAND HILL RD | 18 |
| INDIAN HILL AVE | 16 |
| JOBS POND RD | 16 |
| DEL REEVES RD | 14 |
| RIVERSIDE ST | 14 |
| RIVERVIEW ST | 14 |
| STEPHEN TOM RD | 14 |
| PORTLAND FAIRGROUNDS | 12 |
| BELLE VISTA HTS | 10 |
| COE AVE | 10 |
| GOSPEL LA | 10 |
| GREAT HILL POND RD | 10 |
| MIDDLE HADDAM RD | 10 |
| WAVERLY AVE | 10 |
| BREEZY CORNERS RD | 8 |
2002 - 2018 National Fire Incident Reporting System (NFIRS) incidents
- Incident types reported to NFIRS in Portland, CT
- 2,96358.4%Rescue & EMS
- 65312.9%Hazardous Condition
- 64912.8%Fire
- 3316.5%False Alarm
- 2394.7%Service Call
- 1953.8%Good Intent Call
- 310.6%Special Incident
- 70.1%Overpressure Rupture
- Fire incident types reported to NFIRS in Portland, CT
- 30146.4%Structure Fires
- 23335.9%Outside Fires
- 7211.1%Mobile Property/Vehicle Fires
- 436.6%Other
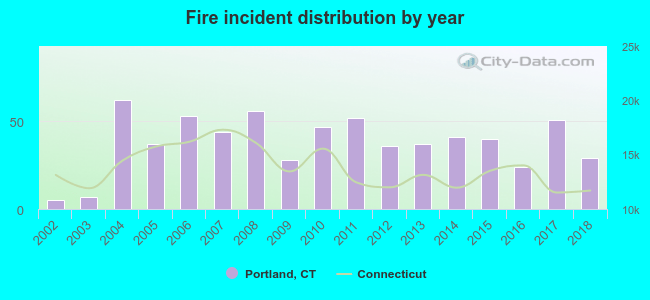 According to the data from the years 2002 - 2018 the average number of fire incidents per year is 38. The highest number of fire incidents - 62 took place in 2004, and the least - 5 in 2002. The data has a growing trend.
The average number of yearly fire incidents per 10k residents in Portland, CT compared to nearest cities:
(Note: Based on data for the last 3 years, including only cities with population 5,000 and above)
| Portland: | 59.1 |
| Middletown: | 37.9 |
| Cromwell: | 27.8 |
| Rocky Hill: | 51.8 |
| Berlin: | 15.6 |
| Glastonbury: | 19.0 |
| Wethersfield: | 22.0 |
| Newington: | 31.2 |
| Marlborough: | 23.9 |
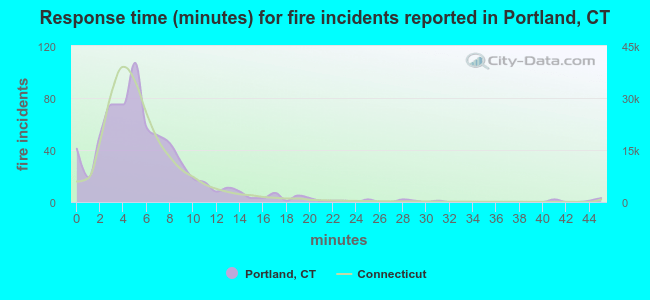 The median response time based on all reported fire incidents is 5 minutes. This is similar to the Connecticut median value.
The median response time in Portland, CT compared to nearest cities:
(Note: Based on data for all years, including only cities with at least 500 fire incidents)
| Portland: | 5 minutes |
| Middletown: | 5 minutes |
| Cromwell: | 7 minutes |
| Rocky Hill: | 7 minutes |
| East Hampton: | 6 minutes |
| Berlin: | 6 minutes |
| Glastonbury: | 6 minutes |
| Wethersfield: | 7 minutes |
| Newington: | 6 minutes |
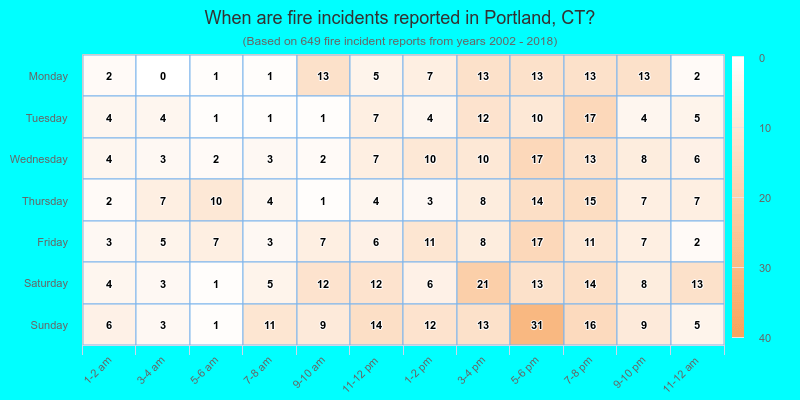
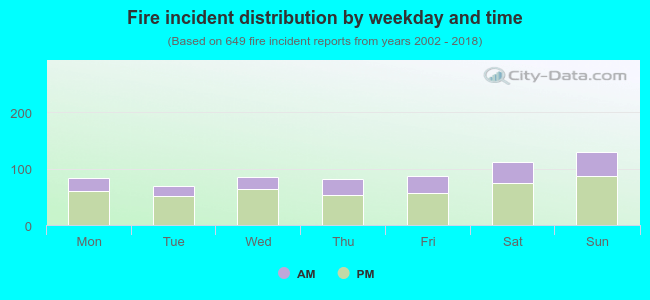 31.0% incidents where reported in the morning and 69.0% in the evening. The most fires (20.0%) took place on Sunday, and the least (10.8%) on Tuesday.
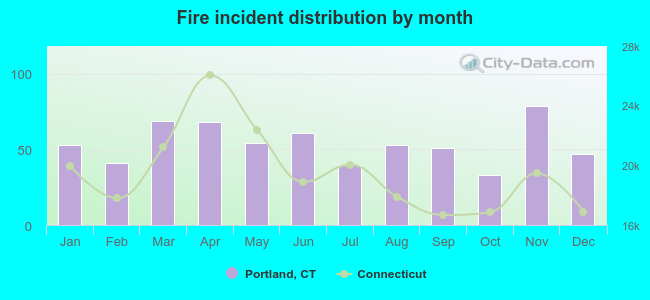 Based on the 649 incident reports from years 2002 - 2018 most fires (12.2%) took place during November, and the least (5.1%) in October.
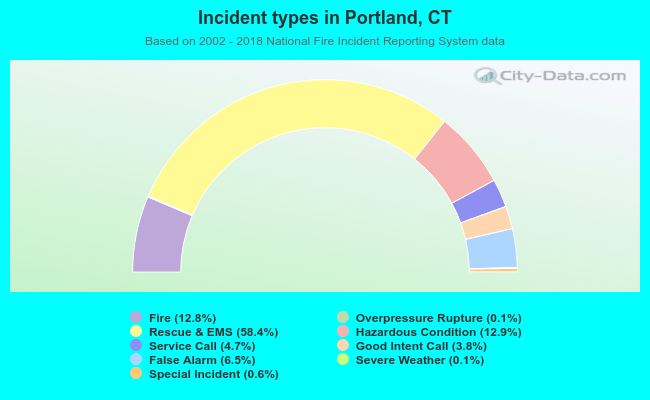 Out of all 5,072 cases reported during the years 2002 - 2018, the most belonged to the categories: Rescue & EMS (58.4%), Hazardous Condition (12.9%), and Fire (12.8%).
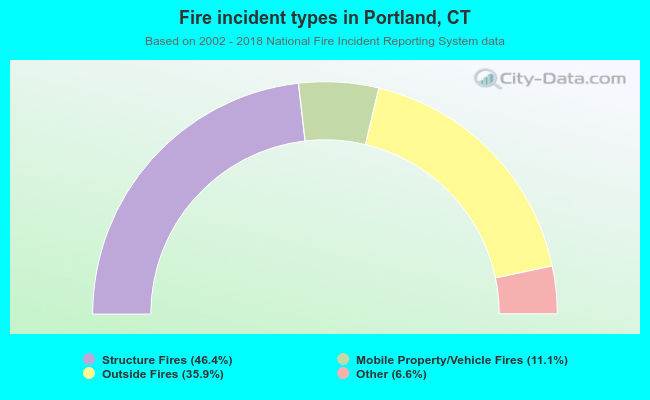 When looking into fire subcategories, the most incidents belonged to: Structure Fires (46.4%), and Outside Fires (35.9%).