Middletown: Fire Incidents, Connecticut (CT)
Where are fire incidents reported in Middletown, CT
Something went wrong! Please refresh the page.
| Fire incidents reported | |
|---|---|
| Sreet name | Count |
| MAIN ST | 542 |
| WASHINGTON ST | 236 |
| MIDDLETOWN | 170 |
| NEWFIELD ST | 128 |
| HIGH ST | 112 |
| CHURCH ST | 110 |
| I-91 | 106 |
| RIVER ROAD | 90 |
| BROAD ST | 80 |
| EAST MAIN STREET | 78 |
| ROUTE 9 | 74 |
| RIVER RD | 72 |
| SAYBROOK RD | 64 |
| SOUTH MAIN STREET | 60 |
| SAYBROOK ROAD | 58 |
| LIBERTY ST | 56 |
| RANDOLPH RD | 50 |
| SPRING ST | 48 |
| STONEYCREST DR | 48 |
| CRESCENT ST | 44 |
| FERRY ST | 44 |
| MIDDLE ST | 44 |
| JOHNSON ST | 42 |
| PEARL ST | 42 |
| PINE ST | 38 |
| ROSE CIR | 38 |
| GRAND ST | 36 |
| PLAZA DR | 36 |
| SILVER ST | 36 |
| SOUTH FIRE DIST. | 36 |
| Other | 856 |
2002 - 2018 National Fire Incident Reporting System (NFIRS) incidents
- Incident types reported to NFIRS in Middletown, CT
- 25,12753.2%Rescue & EMS
- 5,59911.8%Hazardous Condition
- 4,98310.5%False Alarm
- 4,81610.2%Good Intent Call
- 3,4747.3%Fire
- 3,0246.4%Service Call
- 1690.4%Special Incident
- 590.1%Overpressure Rupture
- Fire incident types reported to NFIRS in Middletown, CT
- 1,73650.0%Structure Fires
- 1,07030.8%Outside Fires
- 55415.9%Mobile Property/Vehicle Fires
- 1143.3%Other
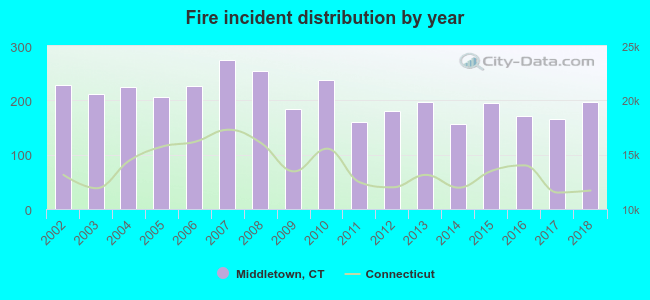 Based on the data from the years 2002 - 2018 the average number of fire incidents per year is 204. The highest number of reported fires - 274 took place in 2007, and the least - 156 in 2014. The data has a decreasing trend.
The average number of yearly fire incidents per 10k residents in Middletown, CT compared to nearest cities:
(Note: Based on data for the last 3 years, including only cities with population 5,000 and above)
| Middletown: | 37.9 |
| Portland: | 59.1 |
| Cromwell: | 27.8 |
| Berlin: | 15.6 |
| Meriden: | 36.2 |
| Rocky Hill: | 51.8 |
| Haddam: | 19.6 |
| Newington: | 31.2 |
| Wethersfield: | 22.0 |
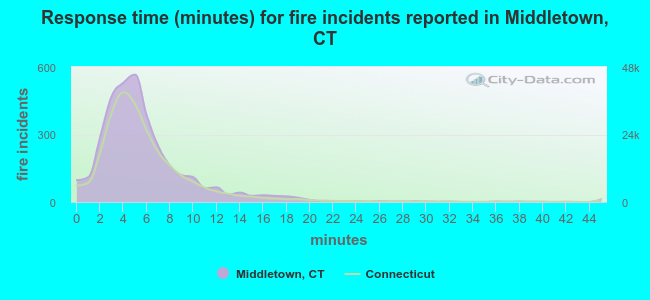 The median response time based on all reported fire incidents is 5 minutes. This is comparable to the Connecticut median value.
The median response time in Middletown, CT compared to nearest cities:
(Note: Based on data for all years, including only cities with at least 500 fire incidents)
| Middletown: | 5 minutes |
| Portland: | 5 minutes |
| Cromwell: | 7 minutes |
| Berlin: | 6 minutes |
| Meriden: | 4 minutes |
| Rocky Hill: | 7 minutes |
| East Hampton: | 6 minutes |
| Newington: | 6 minutes |
| Wethersfield: | 7 minutes |
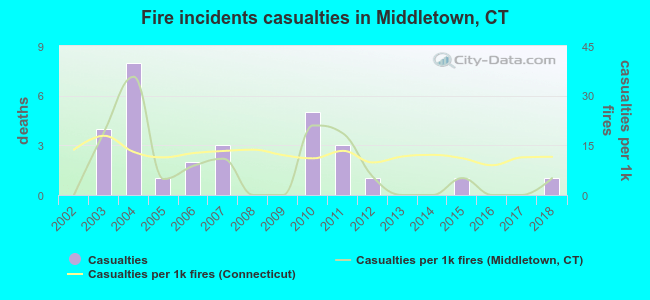 According to the data from the years 2002 - 2018 the average number of fire-related casualties per year is 2. The highest number of casualties - 8 took place in 2004, and the lowest - 0 in 2002. The data has a rising trend.
The average number of injuries per 1,000 fires is 8. This indicator was the highest - 36 in 2004, and the lowest 0 in 2002. The trend for casualties per 1,000 fire incidents is rising. Compared to the Connecticut value the number of injuries per 1,000 incidents is lower.
According to the data from the years 2002 - 2018 the average number of fire-related casualties per year is 2. The highest number of casualties - 8 took place in 2004, and the lowest - 0 in 2002. The data has a rising trend.
The average number of injuries per 1,000 fires is 8. This indicator was the highest - 36 in 2004, and the lowest 0 in 2002. The trend for casualties per 1,000 fire incidents is rising. Compared to the Connecticut value the number of injuries per 1,000 incidents is lower.Casualties per 1,000 incidents in Middletown, CT compared to nearest cities:
(Note: Based on data for all years, including only cities with at least 500 fire incidents)
| Middletown: | 8.3 |
| Portland: | 0.0 |
| Cromwell: | 5.4 |
| Berlin: | 10.8 |
| Meriden: | 12.3 |
| Rocky Hill: | 7.2 |
| East Hampton: | 4.3 |
| Newington: | 2.6 |
| Wethersfield: | 21.5 |
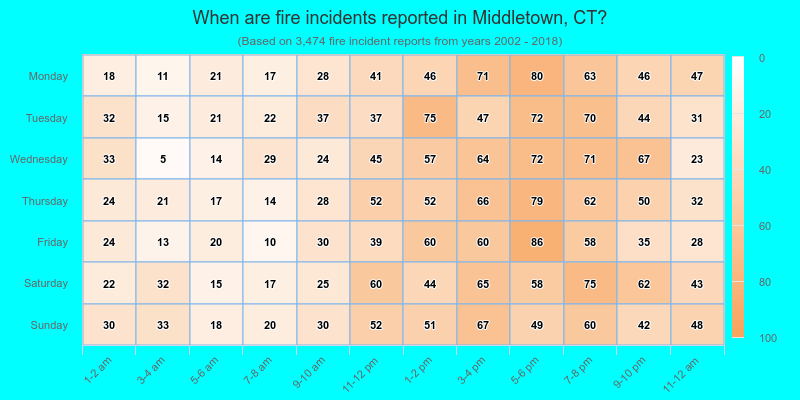
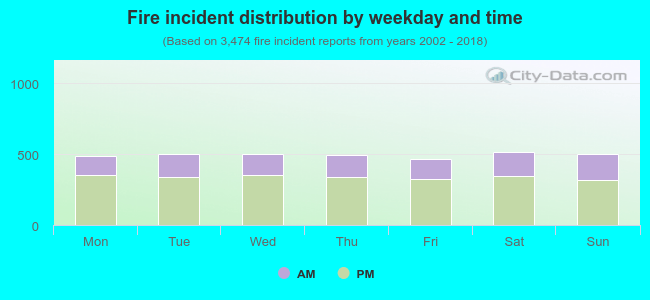 31.5% incidents where reported in the morning and 68.5% in the evening. The most fires (14.9%) took place on Saturday, and the least (13.3%) on Friday.
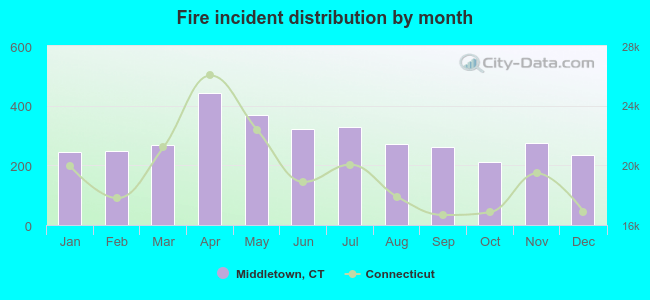 Based on the 3,474 fires from years 2002 - 2018 most fires (12.8%) took place during April, and the least (6.1%) in October.
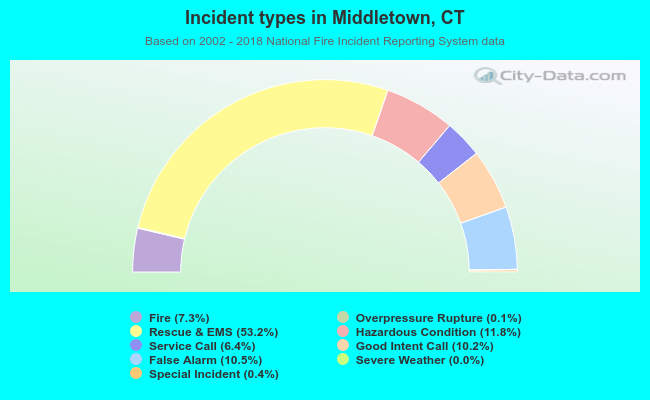 Out of all 47,274 cases reported during the years 2002 - 2018, the most belonged to the categories: Rescue & EMS (53.2%), Hazardous Condition (11.8%), and False Alarm (10.5%).
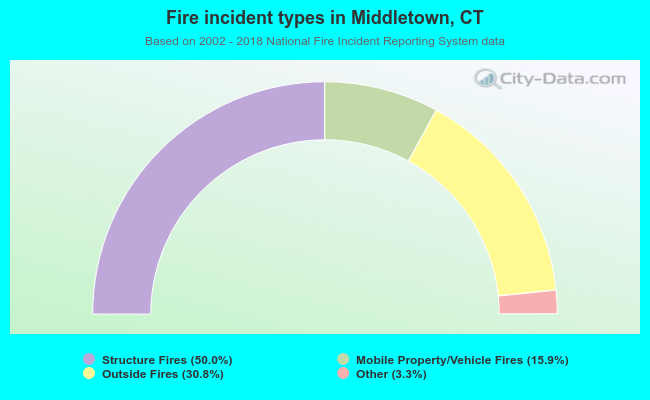 When looking into fire subcategories, the most incidents belonged to: Structure Fires (50.0%), and Outside Fires (30.8%).