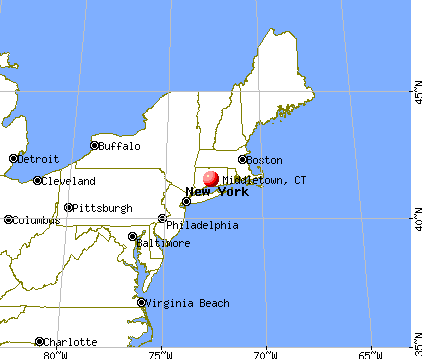
Middletown, Connecticut
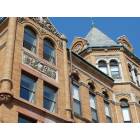
Middletown: MIDDLETOWN, CT - FORMER HIGH SCHOOL

Middletown: Wesleyan University - College Row
- add
your
Submit your own pictures of this city and show them to the world
- OSM Map
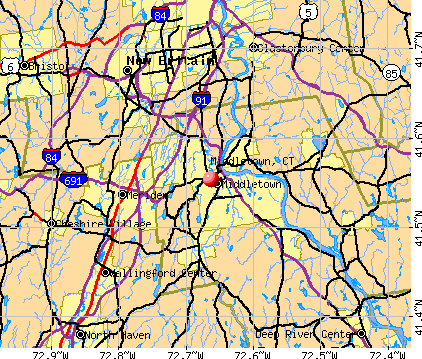
- General Map
- Google Map
- MSN Map
Population change since 2000: +12.9%
 |
| Males: 23,759 | |
| Females: 24,970 |
| Median resident age: | 37.5 years |
| Connecticut median age: | 40.9 years |
Zip codes: 06457.
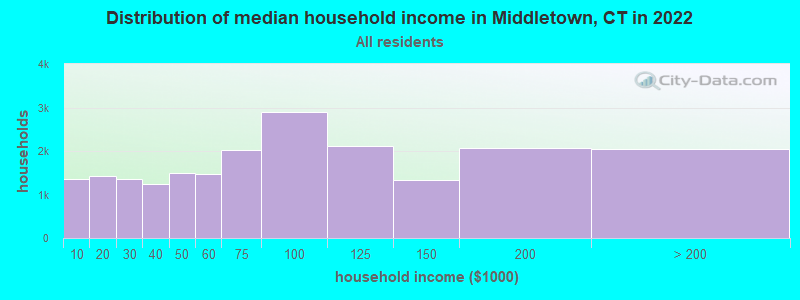
| Middletown: | $73,634 |
| CT: | $88,429 |
Estimated per capita income in 2022: $42,826 (it was $25,720 in 2000)
Middletown city income, earnings, and wages data
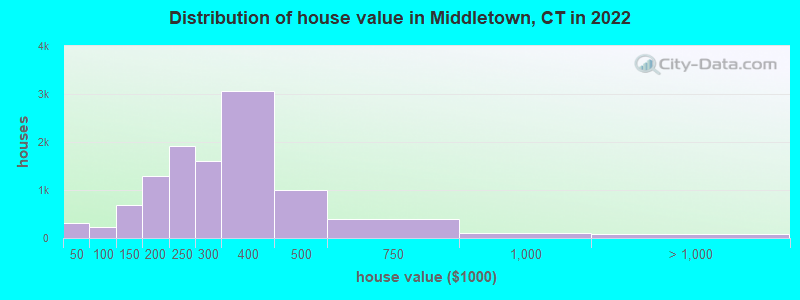
Estimated median house or condo value in 2022: $276,516 (it was $134,400 in 2000)
| Middletown: | $276,516 |
| CT: | $347,200 |
Mean prices in 2022: all housing units: $290,228; detached houses: $318,268; townhouses or other attached units: $194,504; in 2-unit structures: $222,431; in 3-to-4-unit structures: $163,796; in 5-or-more-unit structures: $180,033
Median gross rent in 2022: $1,298.
(8.2% for White Non-Hispanic residents, 18.9% for Black residents, 21.0% for Hispanic or Latino residents, 70.9% for American Indian residents, 38.4% for other race residents, 18.4% for two or more races residents)
Detailed information about poverty and poor residents in Middletown, CT


Compare current foreclosures in Middletown, CT:
| Photo | Address | Area | Beds / Baths | Price | Details |
|---|---|---|---|---|---|

|
#1
Jacobs Ter
Middletown, CT 06457
|
982 sq. feet
|
1 baths 2 beds |
show details | |

|
#2
E Main St
Middletown, CT 06457
|
1,736 sq. feet
|
2 baths 3 beds |
show details | |

|
#3
Poplar Rd
Middletown, CT 06457
|
1,242 sq. feet
|
1 baths 3 beds |
show details | |

|
#4
Long Hill Rd
Middletown, CT 06457
|
1,360 sq. feet
|
1 baths 3 beds |
show details | |

|
#5
Butternut St
Middletown, CT 06457
|
1,498 sq. feet
|
1 baths 4 beds |
show details | |

|
#6
Blue Acre Rd
Middletown, CT 06457
|
1,346 sq. feet
|
2 baths 3 beds |
show details | |

|
#7
Middlefield St
Middletown, CT 06457
|
1,288 sq. feet
|
1 baths 3 beds |
show details | |

|
#8
Eastern Dr
Middletown, CT 06457
|
1,554 sq. feet
|
2 baths 3 beds |
show details | |

|
#9
E Main St
Middletown, CT 06457
|
998 sq. feet
|
1 baths 1 beds |
show details | |

|
#10
Delwood Ave
Middletown, CT 06457
|
1,037 sq. feet
|
2 baths 3 beds |
show details |
| Photo | Address | Area | Beds / Baths | Price | Details |
|---|---|---|---|---|---|

|
#11
Frisbie St
Middletown, CT 06457
|
1,296 sq. feet
|
2 baths 3 beds |
show details | |

|
#12
Hunting Hill Ave
Middletown, CT 06457
|
3,372 sq. feet
|
3 baths 6 beds |
show details | |

|
#13
Jacobs Ter
Middletown, CT 06457
|
982 sq. feet
|
1 baths 2 beds |
show details | |

|
#14
Ridge Rd # 2
Middletown, CT 06457
|
2,862 sq. feet
|
3 baths 5 beds |
show details | |

|
#15
Barry Ct
Middletown, CT 06457
|
912 sq. feet
|
1 baths 2 beds |
show details | |

|
#16
Inverness Ln
Middletown, CT 06457
|
988 sq. feet
|
1 baths 3 beds |
show details | |

|
#17
East St
Middletown, CT 06457
|
1,598 sq. feet
|
1 baths 3 beds |
show details | |

|
#18
Vale St
Middletown, CT 06457
|
960 sq. feet
|
1 baths 3 beds |
show details | |

|
#19
Meech Rd
Middletown, CT 06457
|
1,075 sq. feet
|
1 baths 3 beds |
show details | |

|
#20
Longworth Ave
Middletown, CT 06457
|
1,456 sq. feet
|
2 baths 3 beds |
show details |
| Photo | Address | Area | Beds / Baths | Price | Details |
|---|---|---|---|---|---|

|
#21
Cimarron Rd
Middletown, CT 06457
|
1,346 sq. feet
|
2 baths 3 beds |
show details | |

|
#22
Washington St # 9
Middletown, CT 06457
|
880 sq. feet
|
1 baths 2 beds |
show details | |

|
#23
Saybrook Rd
Middletown, CT 06457
|
1,587 sq. feet
|
2 baths 4 beds |
show details | |

|
#24
Middlefield St
Middletown, CT 06457
|
1,318 sq. feet
|
1 baths 3 beds |
show details | |

|
#25
Pearl St
Middletown, CT 06457
|
2,832 sq. feet
|
2 baths 4 beds |
show details | |

|
#26
Pine St
Middletown, CT 06457
|
1,906 sq. feet
|
2 baths 3 beds |
show details | |

|
#27
Gowin Rd
Middletown, CT 06457
|
912 sq. feet
|
1 baths 3 beds |
show details | |

|
#28
Burgundy Hill Ln
Middletown, CT 06457
|
563 sq. feet
|
1 baths 1 beds |
show details | |

|
#29
Chamberlain Rd # B
Middletown, CT 06457
|
- sq. feet
|
- baths - beds |
show details | |

|
#30
Plaza Dr
Middletown, CT 06457
|
- sq. feet
|
- baths - beds |
show details |
| Photo | Address | Area | Beds / Baths | Price | Details |
|---|---|---|---|---|---|

|
#31
Russett Ln
Middletown, CT 06457
|
- sq. feet
|
- baths - beds |
show details | |

|
#32
Town Pl
Middletown, CT 06457
|
- sq. feet
|
- baths - beds |
show details | |

|
#33
Woodbury Cir
Middletown, CT 06457
|
- sq. feet
|
- baths - beds |
show details | |

|
#34
Russett Ln
Middletown, CT 06457
|
- sq. feet
|
- baths - beds |
show details | |

|
#35
Beverly Hts
Middletown, CT 06457
|
- sq. feet
|
- baths - beds |
show details | |

|
Check over 1 million property listings on Foreclosure.com!
|
browse all offers | |||


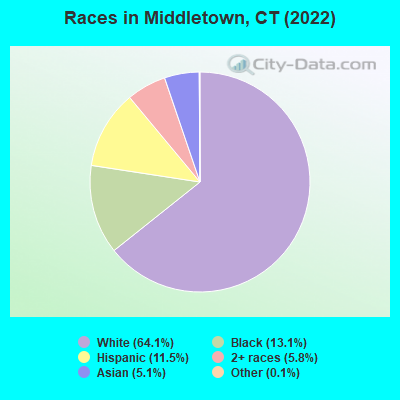
- 30,98564.1%White alone
- 6,34013.1%Black alone
- 5,55511.5%Hispanic
- 2,7845.8%Two or more races
- 2,4685.1%Asian alone
- 640.1%Other race alone
- 300.06%American Indian alone
Races in Middletown detailed stats: ancestries, foreign born residents, place of birth
According to our research of Connecticut and other state lists, there were 81 registered sex offenders living in Middletown, Connecticut as of April 27, 2024.
The ratio of all residents to sex offenders in Middletown is 577 to 1.
Type |
2009 |
2010 |
2011 |
2012 |
2013 |
2014 |
2015 |
2016 |
2017 |
2018 |
2019 |
2020 |
2021 |
2022 |
|---|---|---|---|---|---|---|---|---|---|---|---|---|---|---|
| Murders (per 100,000) | 1 (2.1) | 0 (0.0) | 0 (0.0) | 1 (2.1) | 0 (0.0) | 0 (0.0) | 1 (2.1) | 0 (0.0) | 0 (0.0) | 3 (6.5) | 0 (0.0) | 3 (6.5) | 3 (6.5) | 0 (0.0) |
| Rapes (per 100,000) | 0 (0.0) | 4 (8.4) | 10 (20.9) | 1 (2.1) | 12 (25.4) | 4 (8.5) | 7 (14.9) | 5 (10.7) | 6 (12.9) | 3 (6.5) | 6 (13.1) | 6 (13.0) | 9 (19.6) | 7 (14.8) |
| Robberies (per 100,000) | 30 (62.1) | 20 (42.0) | 30 (62.8) | 25 (52.2) | 22 (46.6) | 25 (52.9) | 19 (40.5) | 23 (49.4) | 9 (19.4) | 8 (17.3) | 11 (23.9) | 11 (23.9) | 16 (34.9) | 9 (19.0) |
| Assaults (per 100,000) | 27 (55.9) | 35 (73.5) | 37 (77.5) | 45 (94.0) | 26 (55.1) | 51 (107.9) | 37 (78.9) | 42 (90.2) | 36 (77.6) | 22 (47.5) | 24 (52.2) | 31 (67.2) | 24 (52.3) | 32 (67.7) |
| Burglaries (per 100,000) | 213 (441.0) | 158 (331.6) | 143 (299.6) | 156 (325.8) | 87 (184.2) | 96 (203.1) | 89 (189.8) | 108 (231.9) | 69 (148.8) | 78 (168.4) | 64 (139.2) | 69 (149.7) | 43 (93.8) | 46 (97.3) |
| Thefts (per 100,000) | 1,205 (2,495) | 926 (1,943) | 820 (1,718) | 664 (1,387) | 666 (1,410) | 700 (1,481) | 582 (1,241) | 732 (1,571) | 593 (1,279) | 431 (930.6) | 478 (1,040) | 489 (1,061) | 480 (1,047) | 628 (1,329) |
| Auto thefts (per 100,000) | 92 (190.5) | 59 (123.8) | 60 (125.7) | 83 (173.4) | 74 (156.7) | 64 (135.4) | 58 (123.7) | 87 (186.8) | 71 (153.1) | 75 (161.9) | 77 (167.5) | 63 (136.6) | 81 (176.7) | 97 (205.3) |
| Arson (per 100,000) | 4 (8.3) | 3 (6.3) | 2 (4.2) | 3 (6.3) | 0 (0.0) | 1 (2.1) | 0 (0.0) | 0 (0.0) | 0 (0.0) | 0 (0.0) | 0 (0.0) | 1 (2.2) | 1 (2.2) | 1 (2.1) |
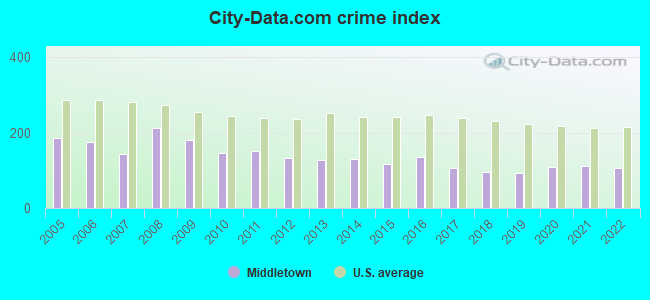
| City-Data.com crime index | 179.9 | 144.9 | 150.9 | 132.5 | 127.2 | 128.5 | 117.0 | 135.5 | 105.5 | 94.8 | 92.8 | 107.9 | 112.3 | 107.5 |
The City-Data.com crime index weighs serious crimes and violent crimes more heavily. Higher means more crime, U.S. average is 246.1. It adjusts for the number of visitors and daily workers commuting into cities.
Crime rate in Middletown detailed stats: murders, rapes, robberies, assaults, burglaries, thefts, arson
Full-time law enforcement employees in 2021, including police officers: 120 (106 officers - 96 male; 10 female).
| Officers per 1,000 residents here: | 2.31 |
| Connecticut average: | 2.10 |
 Recent articles from our blog. Our writers, many of them Ph.D. graduates or candidates, create easy-to-read articles on a wide variety of topics.

 | 2024 Connecticut Town Tournament VI (Celebrating the 10-Year Anniversary & Dazzleman's Memorial) (705 replies) |
| Current Real estate markets (3987 replies) |
| Apartment in Middletown/Cromwell area (7 replies) |
| Looking for a private room in Middletown, CT (1 reply) |
| Middletown area development (30 replies) |
| Job offer in Middletown -- Very disappointing (158 replies) |
Latest news from Middletown, CT collected exclusively by city-data.com from local newspapers, TV, and radio stations
Middletown, CT City Guides:
Ancestries: Italian (15.5%), Irish (7.5%), Polish (7.4%), American (6.9%), Jamaican (4.6%), German (3.5%).
Current Local Time: EST time zone
Incorporated on 09/11/1651
Elevation: 100 feet
Land area: 40.9 square miles.
Population density: 1,191 people per square mile (low).
5,861 residents are foreign born (3.6% Asia, 3.5% Europe, 3.4% Latin America).
| This city: | 12.1% |
| Connecticut: | 15.0% |
Median real estate property taxes paid for housing units with mortgages in 2022: $5,936 (2.2%)
Median real estate property taxes paid for housing units with no mortgage in 2022: $5,621 (2.0%)
Nearest city with pop. 50,000+: Meriden, CT  (7.2 miles , pop. 58,244).
Nearest city with pop. 200,000+: North Hempstead, NY (74.9 miles , pop. 222,611).
Nearest city with pop. 1,000,000+: Bronx, NY (79.7 miles , pop. 1,332,650).
Nearest cities:
), Latitude: 41.55 N, Longitude: 72.66 W
Daytime population change due to commuting: +5,988 (+12.4%)
Workers who live and work in this city: 12,145 (46.0%)
Area code: 860

Middletown, Connecticut accommodation & food services, waste management - Economy and Business Data
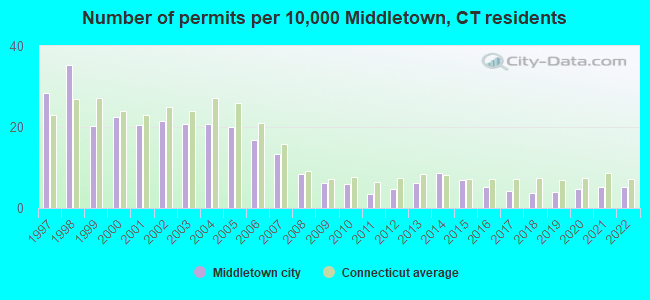
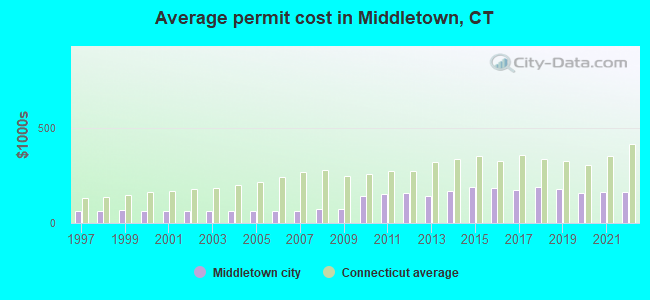
Single-family new house construction building permits:
- 2022: 22 buildings, average cost: $162,600
- 2021: 22 buildings, average cost: $164,000
- 2020: 20 buildings, average cost: $158,900
- 2019: 17 buildings, average cost: $181,400
- 2018: 16 buildings, average cost: $188,900
- 2017: 18 buildings, average cost: $172,400
- 2016: 22 buildings, average cost: $181,700
- 2015: 30 buildings, average cost: $188,000
- 2014: 37 buildings, average cost: $167,200
- 2013: 27 buildings, average cost: $143,900
- 2012: 20 buildings, average cost: $159,600
- 2011: 15 buildings, average cost: $153,600
- 2010: 26 buildings, average cost: $143,200
- 2009: 27 buildings, average cost: $73,400
- 2008: 36 buildings, average cost: $75,200
- 2007: 58 buildings, average cost: $65,200
- 2006: 72 buildings, average cost: $65,200
- 2005: 86 buildings, average cost: $65,200
- 2004: 89 buildings, average cost: $65,200
- 2003: 89 buildings, average cost: $65,300
- 2002: 93 buildings, average cost: $65,200
- 2001: 88 buildings, average cost: $65,300
- 2000: 97 buildings, average cost: $65,100
- 1999: 87 buildings, average cost: $66,200
- 1998: 152 buildings, average cost: $62,600
- 1997: 123 buildings, average cost: $61,300
| Here: | 3.3% |
| Connecticut: | 3.9% |
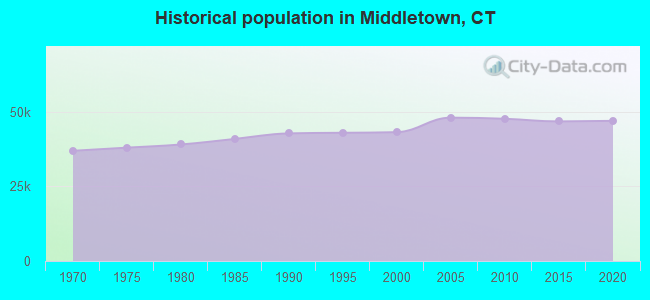
Population change in the 1990s: +316 (+0.7%).
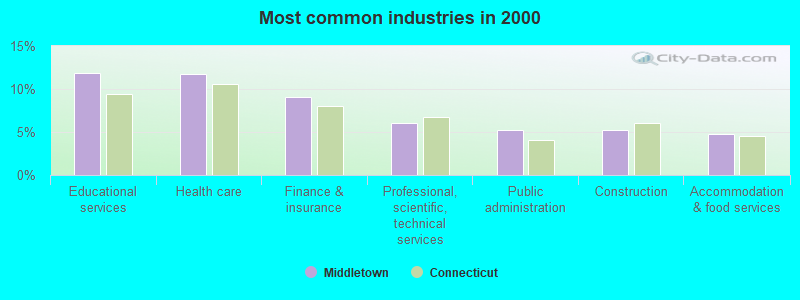
- Educational services (11.9%)
- Health care (11.8%)
- Finance & insurance (9.1%)
- Professional, scientific, technical services (6.1%)
- Public administration (5.2%)
- Construction (5.2%)
- Accommodation & food services (4.7%)
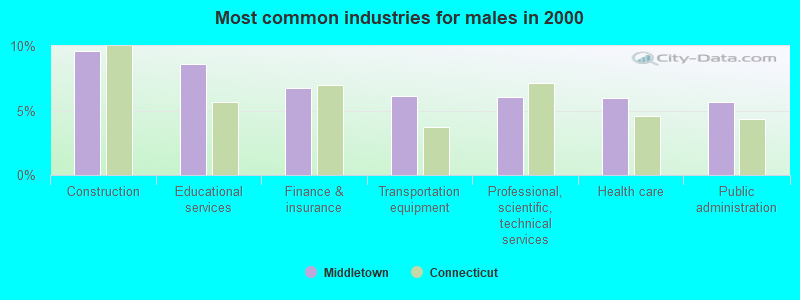
- Construction (9.6%)
- Educational services (8.6%)
- Finance & insurance (6.8%)
- Transportation equipment (6.1%)
- Professional, scientific, technical services (6.0%)
- Health care (6.0%)
- Public administration (5.7%)
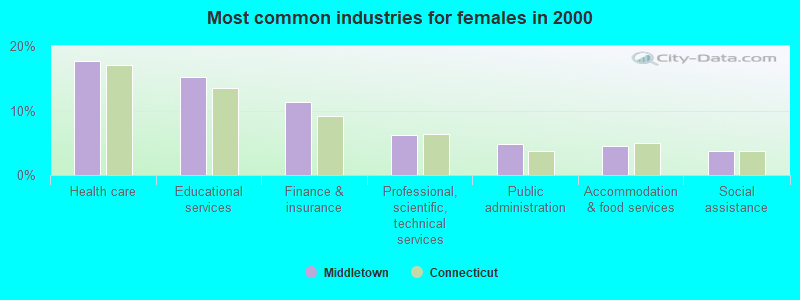
- Health care (17.6%)
- Educational services (15.2%)
- Finance & insurance (11.4%)
- Professional, scientific, technical services (6.2%)
- Public administration (4.8%)
- Accommodation & food services (4.5%)
- Social assistance (3.7%)
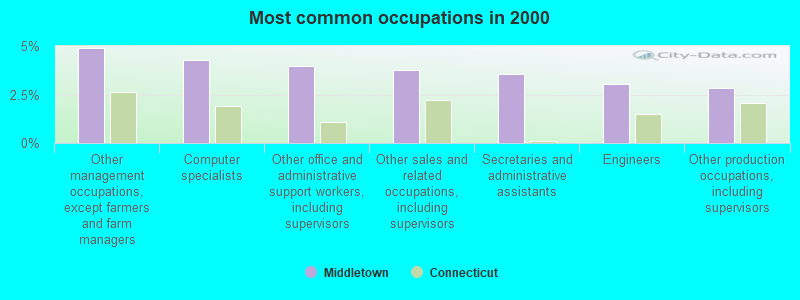
- Other management occupations, except farmers and farm managers (4.9%)
- Computer specialists (4.3%)
- Other office and administrative support workers, including supervisors (4.0%)
- Other sales and related occupations, including supervisors (3.8%)
- Secretaries and administrative assistants (3.6%)
- Engineers (3.1%)
- Other production occupations, including supervisors (2.8%)
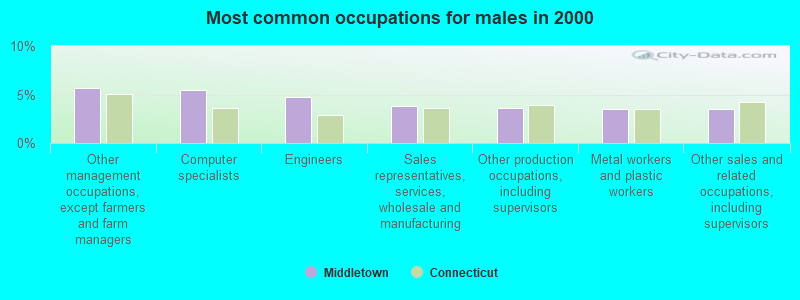
- Other management occupations, except farmers and farm managers (5.6%)
- Computer specialists (5.5%)
- Engineers (4.7%)
- Sales representatives, services, wholesale and manufacturing (3.8%)
- Other production occupations, including supervisors (3.6%)
- Metal workers and plastic workers (3.5%)
- Other sales and related occupations, including supervisors (3.5%)
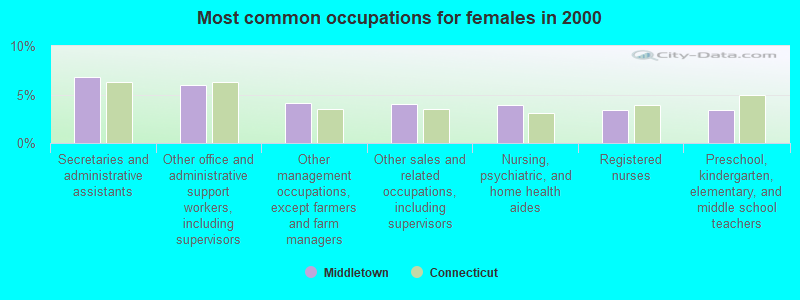
- Secretaries and administrative assistants (6.8%)
- Other office and administrative support workers, including supervisors (6.0%)
- Other management occupations, except farmers and farm managers (4.1%)
- Other sales and related occupations, including supervisors (4.0%)
- Nursing, psychiatric, and home health aides (3.9%)
- Registered nurses (3.4%)
- Preschool, kindergarten, elementary, and middle school teachers (3.4%)
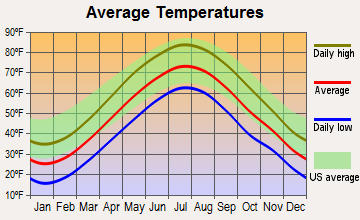
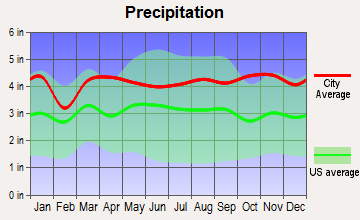
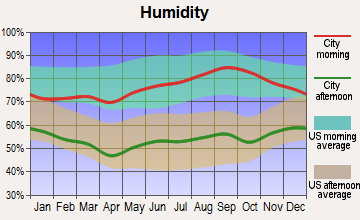
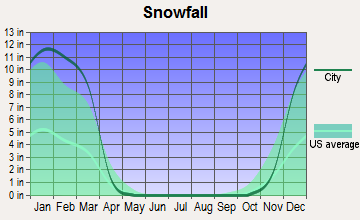
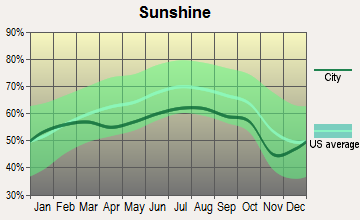
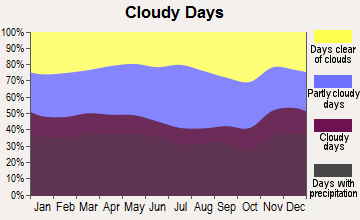
Average climate in Middletown, Connecticut
Based on data reported by over 4,000 weather stations
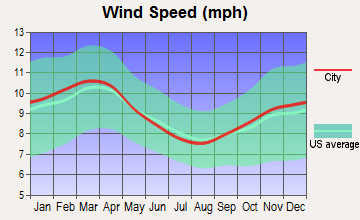
(lower is better)
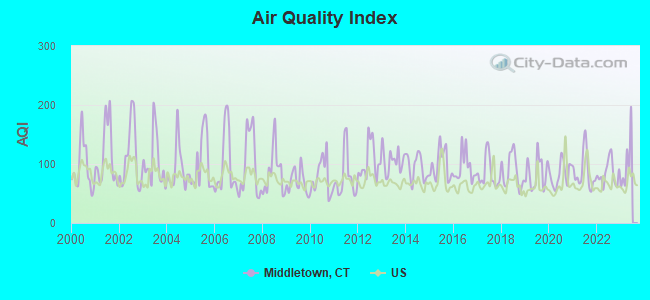
Air Quality Index (AQI) level in 2022 was 84.5. This is about average.
| City: | 84.5 |
| U.S.: | 72.6 |
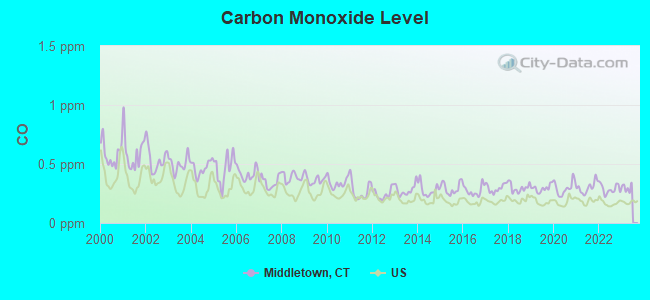
Carbon Monoxide (CO) [ppm] level in 2022 was 0.288. This is about average. Closest monitor was 10.0 miles away from the city center.
| City: | 0.288 |
| U.S.: | 0.251 |
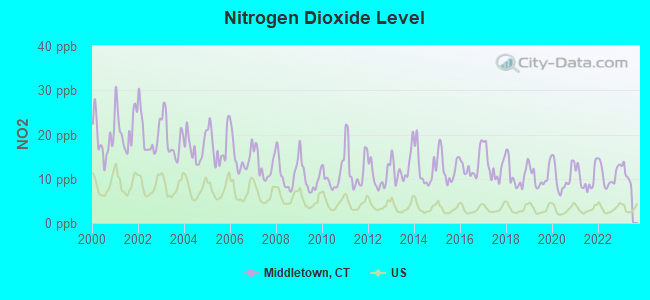
Nitrogen Dioxide (NO2) [ppb] level in 2022 was 10.8. This is significantly worse than average. Closest monitor was 1.0 miles away from the city center.
| City: | 10.8 |
| U.S.: | 5.1 |
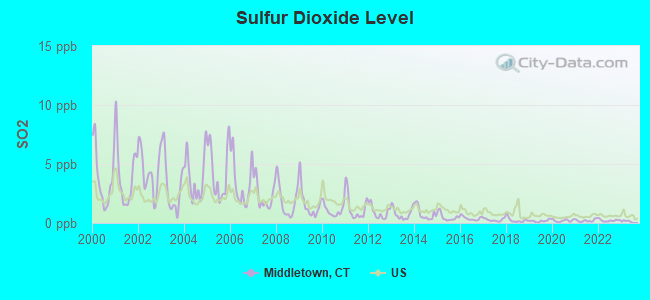
Sulfur Dioxide (SO2) [ppb] level in 2022 was 0.214. This is significantly better than average. Closest monitor was 1.0 miles away from the city center.
| City: | 0.214 |
| U.S.: | 1.515 |
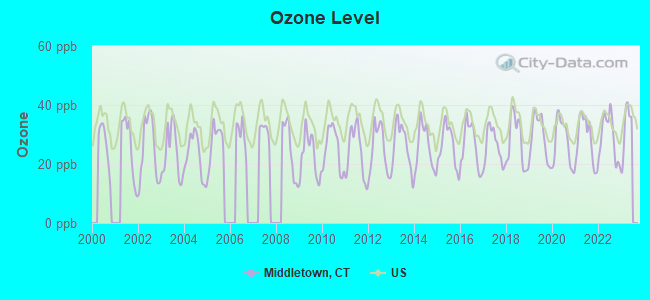
Ozone [ppb] level in 2022 was 29.1. This is about average. Closest monitor was 1.0 miles away from the city center.
| City: | 29.1 |
| U.S.: | 33.3 |
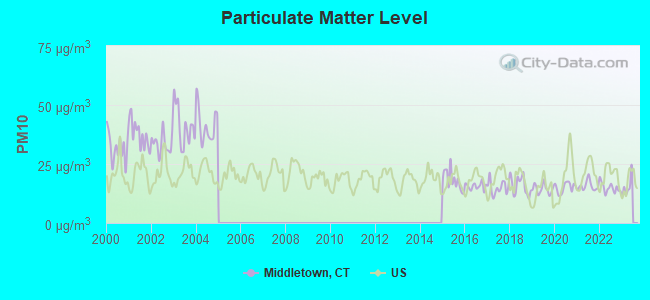
Particulate Matter (PM10) [µg/m3] level in 2022 was 14.9. This is better than average. Closest monitor was 6.6 miles away from the city center.
| City: | 14.9 |
| U.S.: | 19.2 |
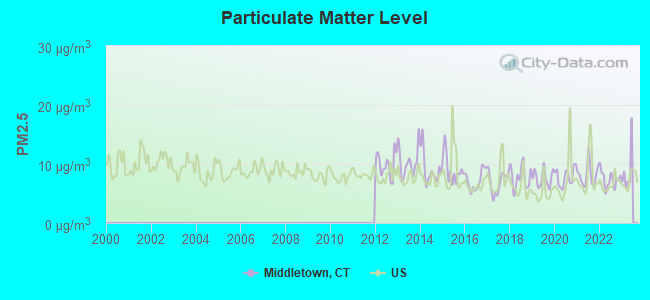
Particulate Matter (PM2.5) [µg/m3] level in 2022 was 7.42. This is about average. Closest monitor was 13.1 miles away from the city center.
| City: | 7.42 |
| U.S.: | 8.11 |
Tornado activity:
Middletown-area historical tornado activity is near Connecticut state average. It is 29% smaller than the overall U.S. average.
On 7/10/1989, a category F4 (max. wind speeds 207-260 mph) tornado 17.2 miles away from the Middletown city center injured 40 people and caused between $50,000,000 and $500,000,000 in damages.
On 10/3/1979, a category F4 tornado 22.6 miles away from the city center killed 3 people and injured 500 people and caused between $50,000,000 and $500,000,000 in damages.
Earthquake activity:
Middletown-area historical earthquake activity is significantly above Connecticut state average. It is 71% smaller than the overall U.S. average.On 10/7/1983 at 10:18:46, a magnitude 5.3 (5.1 MB, 5.3 LG, 5.1 ML, Class: Moderate, Intensity: VI - VII) earthquake occurred 186.6 miles away from the city center
On 4/20/2002 at 10:50:47, a magnitude 5.3 (5.3 ML, Depth: 3.0 mi) earthquake occurred 211.2 miles away from Middletown center
On 4/20/2002 at 10:50:47, a magnitude 5.2 (5.2 MB, 4.2 MS, 5.2 MW, 5.0 MW) earthquake occurred 209.8 miles away from Middletown center
On 1/19/1982 at 00:14:42, a magnitude 4.7 (4.5 MB, 4.7 MD, 4.5 LG, Class: Light, Intensity: IV - V) earthquake occurred 145.1 miles away from Middletown center
On 8/23/2011 at 17:51:04, a magnitude 5.8 (5.8 MW, Depth: 3.7 mi) earthquake occurred 377.0 miles away from the city center
On 10/16/2012 at 23:12:25, a magnitude 4.7 (4.7 ML, Depth: 10.0 mi) earthquake occurred 174.4 miles away from Middletown center
Magnitude types: regional Lg-wave magnitude (LG), body-wave magnitude (MB), duration magnitude (MD), local magnitude (ML), surface-wave magnitude (MS), moment magnitude (MW)
Natural disasters:
The number of natural disasters in Middlesex County (21) is greater than the US average (15).Major Disasters (Presidential) Declared: 12
Emergencies Declared: 9
Causes of natural disasters: Hurricanes: 6, Storms: 6, Floods: 5, Blizzards: 3, Snowstorms: 3, Winter Storms: 3, Snow: 1, Snowfall: 1, Tropical Storm: 1, Wind: 1 (Note: some incidents may be assigned to more than one category).
Hospitals in Middletown:
- CONNECTICUT VALLEY HOSP (SILVER ST)
- MIDDLESEX HOSPITAL (Voluntary non-profit - Private, 28 CRESCENT ST)
- MIDDLESEX SURGICAL CENTER (530 SAYBROOK RD)
Nursing Homes in Middletown:
- APPLE REHAB MIDDLETOWN (600 HIGHLAND AVE)
- LUTHERAN HOME OF MIDDLETOWN INC (628 CONGDON ST W)
- MIDDLESEX CONVALESCENT CTR (100 RANDOLPH RD)
- MIDDLESEX HEALTH CARE CENTER (100 RANDOLPH RD)
- RIDGEWOOD CENTRAL INC (959 WASHINGTON ST EXT)
- WADSWORTH GLEN HEALTH CARE CEN (30 BOSTON RD)
- WATER'S EDGE CENTER FOR HEALTH AND REHAB (111 CHURCH STREET)
Dialysis Facilities in Middletown:
Home Health Centers in Middletown:
Heliports located in Middletown:
See details about Heliports located in Middletown, CTAmtrak stations near Middletown:
- 8 miles: MERIDEN (60 STATE ST.) . Services: ticket office, partially wheelchair accessible, enclosed waiting area, public restrooms, public payphones, vending machines, call for car rental service, call for taxi service, public transit connection.
- 8 miles: BERLIN (KENSINGTON, DEPOT RD.) . Services: ticket office, partially wheelchair accessible, enclosed waiting area, public restrooms, public payphones, free short-term parking, free long-term parking, call for car rental service, call for taxi service, public transit connection.
- 11 miles: WALLINGFORD (37 HALL AVE.) . Services: partially wheelchair accessible, enclosed waiting area, public payphones, free short-term parking, call for car rental service, call for taxi service.
Colleges/Universities in Middletown:
- Wesleyan University (Full-time enrollment: 3,517; Location: 237 High St; Private, not-for-profit; Website: www.wesleyan.edu; Offers Doctor's degree)
- Middlesex Community College (Full-time enrollment: 1,813; Location: 100 Training Hill Rd; Public; Website: www.mxcc.commnet.edu)
- Vinal Technical High School (Full-time enrollment: 57; Location: 60 Daniels St; Public; Website: www.cttech.org/vinal)
Other colleges/universities with over 2000 students near Middletown:
- Central Connecticut State University (about 11 miles; New Britain, CT; Full-time enrollment: 9,989)
- Goodwin College (about 14 miles; East Hartford, CT; FT enrollment: 3,017)
- Trinity College (about 14 miles; Hartford, CT; FT enrollment: 2,355)
- Capital Community College (about 15 miles; Hartford, CT; FT enrollment: 2,609)
- Quinnipiac University (about 16 miles; Hamden, CT; FT enrollment: 8,153)
- Manchester Community College (about 16 miles; Manchester, CT; FT enrollment: 4,667)
- Tunxis Community College (about 16 miles; Farmington, CT; FT enrollment: 2,787)
Biggest public high schools in Middletown:
- MIDDLETOWN HIGH SCHOOL (Students: 1,094, Location: 200 LAROSA LANE, Grades: 9-12)
- VINAL TECHNICAL HIGH SCHOOL (Students: 651, Location: 60 DANIELS STREET, Grades: 9-12)
- RIVERVIEW SCHOOL (Location: 915 RIVER RD, Grades: 7-12)
- WALTER G CADY SCHOOL (Location: 1225 SILVER STREET, Grades: 8-12)
- CONNECTICUT VALLEY HOSPITAL - WHITING FORENSIC - B (Location: 70 OBRIEN DRIVE, Grades: 10-12)
- TRANSITION TO LIFE CENTER (Location: 670 NEWFIELD STREET, Grades: 11-12)
- EVENING PROGRAM - MHS (Location: 200 LAROSA LANE, Grades: 9-12)
- MHS - ALTERNATIVE EDUCATION PROGRAM 1 (Location: 200 LAROSA LANE, Grades: 9-12)
- VIRTUAL LEARNING ACADEMY - MHS (Location: 200 LAROSA LANE, Grades: 9-12)
- MHS - ALTERNATIVE EDUCATION PROGRAM 2 (Location: 200 LAROSA LANE, Grades: 9-12)
Private high schools in Middletown:
Biggest public elementary/middle schools in Middletown:
- WOODROW WILSON MIDDLE SCHOOL (Students: 640, Location: 1 WILDERMAN'S WAY, Grades: 7-8)
- MOODY SCHOOL (Students: 451, Location: 300 COUNTRY CLUB ROAD, Grades: KG-5)
- BIELEFIELD SCHOOL (Students: 414, Location: 70 MAYNARD STREET, Grades: KG-6)
- SNOW SCHOOL (Students: 414, Location: 299 WADSWORTH STREET, Grades: PK-5)
- SPENCER SCHOOL (Students: 411, Location: 207 WESTFIELD STREET, Grades: KG-5)
- WESLEY SCHOOL (Students: 376, Location: 10 WESLEYAN HILLS ROAD, Grades: KG-5)
- KEIGWIN MIDDLE SCHOOL (Students: 374, Location: 99 SPRUCE STREET, Grades: 6)
- LAWRENCE SCHOOL (Students: 362, Location: KAPLAN DRIVE, Grades: KG-5)
- FARM HILL SCHOOL (Students: 358, Location: 390 RIDGE ROAD, Grades: KG-5)
- MACDONOUGH SCHOOL (Students: 259, Location: 66 SPRING STREET, Grades: KG-5)
Private elementary/middle schools in Middletown:
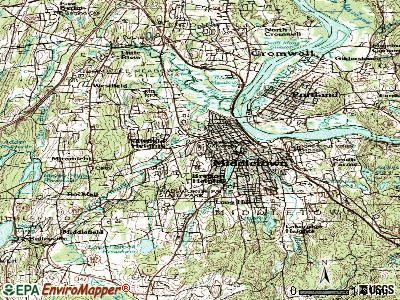
Points of interest:
Notable locations in Middletown: Little River (A), South Farms (B), Crystal Lake State Access Area (C), Middletown Fire Department Headquarters (D), South District Fire Department (E), Middletown Fire Department Station 2 (F), Westfield Volunteer Fire Department (G), Zilka Gallery (H), Tremaine Library (I), Submarine Library Museum (J), Science Library (K), Russell Library (L), Public Affairs Center (M), Olin Memorial Library (N), Oddfellows Playhouse Youth Theater (O), Middletown City Hall (P), Middlesex County Historical Society Library (Q), Middlesex County Historical Society Building (R), Mansfield Freeman Center for East Asian Studies (S), Malcolm X House (T). Display/hide their locations on the map
Shopping Centers: Riverview Center Shopping Center (1), Metro Square Shopping Center (2), The Clock Tower Shopping Center (3), Washington Plaza Shopping Center (4). Display/hide their locations on the map
Churches in Middletown include: Bethel Apostolic Church (A), Christ Lutheran Church (B), Church of the Holy Trinity (C), Congregation Adath Israel (D), Connecticut Valley Hindu Temple (E), Cross Street African Methodist Episcopal Zion Church (F), First Baptist Church (G), First Church of Christ (H), First Church of Christ Scientist (I). Display/hide their locations on the map
Cemeteries: Old South Hill Cemetery (1), Old Westfield Cemetery (2), Pine Grove Cemetery (3), Calhoun Cemetery (4), Saint Johns Cemetery (5), West Burying Ground (6), Indian Hill Cemetery (7). Display/hide their locations on the map
Lakes and reservoirs: Wilcox Pond (A), Zoar Pond (B), Highland Pond (C), Hubbard Pond (D), Starr Millpond (E), Miner Pond (F), Pameacha Pond (G), Adder Reservoir (H). Display/hide their locations on the map
Streams, rivers, and creeks: Long Hill Brook (A), Manthey Brook (B), Mattabesset River (C), Prout Brook (D), Reservoir Brook (E), Richards Brook (F), Roaring Brook (G), Round Hill Brook (H), Sawmill Brook (I). Display/hide their locations on the map
Parks in Middletown include: Broad Street Historic District (1), Butternut Hollow Park (2), Union Park (3), Union Green (4), Tynan Memorial Park (5), Spear Park (6), Smith Park (7), Seven Falls Highway Park (8), Dart Island State Park (9). Display/hide their locations on the map
Tourist attractions: Kidcity Children's Museum (119 Washington Street) (1), Special Education Resource Center (Cultural Attractions- Events- & Facilities; 25 Industrial Park Road) (2), CT River Valley & Shoreline Visitors Council (393 Main Street) (3), Resler & Associates (Arcades & Amusements; 37 Afton Terrace) (4), Dattco (Tours & Charters; 131 Tuttle Road) (5). Display/hide their approximate locations on the map
Hotels: Best Way Inn (31 Meriden Road) (1), Wesley Inn & Suites (988 Washington Street) (2), Inn at Middletown (70 Main Street) (3), Monte Green Motel (1310 South Main Street) (4). Display/hide their approximate locations on the map
Courts: Connecticut State - Judicial Branch- Superior Court Housing- Middlesex Judicial Dist (1 Court Street) (1), Middletown City - Probate Court (94 Court Street) (2). Display/hide their approximate locations on the map
Birthplace of: Willie Pep - Italian- boxer, Dean Acheson - (1893-1971), USA Secretary, John Hasbrouck Van Vleck - Physicist, Joey Logano - Stock car racing driver, Thomas H. Stevens, Jr. - Navy Rear Admiral, Bill Denehy (baseball) - Major League Baseball pitcher, Joey Jay - Baseball player, Walter Wriston - Boxer, Corny Thompson - Basketball player, David Peoples - Science fiction writer.
Drinking water stations with addresses in Middletown and their reported violations in the past:
MIDDLETOWN WATER DEPARTMENT (Population served: 41,019, Surface water):Past monitoring violations:
- Monitoring and Reporting (DBP) - Between JAN-2011 and MAR-2011, Contaminant: CARBON, TOTAL
- Monitoring of Treatment (SWTR-Filter) - In DEC-2006. Follow-up actions: St Violation/Reminder Notice (MAR-16-2007), St Compliance achieved (MAR-26-2007)
- Monitoring and Reporting (DBP) - Between OCT-2006 and DEC-2006, Contaminant: Chlorine. Follow-up actions: St Violation/Reminder Notice (MAR-16-2007), St Compliance achieved (MAR-26-2007)
- One routine major monitoring violation
| This city: | 2.2 people |
| Connecticut: | 2.5 people |
| This city: | 55.2% |
| Whole state: | 66.3% |
| This city: | 8.3% |
| Whole state: | 6.6% |
Likely homosexual households (counted as self-reported same-sex unmarried-partner households)
- Lesbian couples: 0.6% of all households
- Gay men: 0.4% of all households
People in group quarters in Middletown in 2010:
- 2,437 people in college/university student housing
- 552 people in nursing facilities/skilled-nursing facilities
- 319 people in mental (psychiatric) hospitals and psychiatric units in other hospitals
- 134 people in group homes intended for adults
- 110 people in other noninstitutional facilities
- 95 people in hospitals with patients who have no usual home elsewhere
- 38 people in emergency and transitional shelters (with sleeping facilities) for people experiencing homelessness
- 14 people in correctional residential facilities
- 14 people in residential treatment centers for adults
- 9 people in group homes for juveniles (non-correctional)
- 9 people in in-patient hospice facilities
People in group quarters in Middletown in 2000:
- 557 people in nursing homes
- 495 people in mental (psychiatric) hospitals or wards
- 212 people in training schools for juvenile delinquents
- 193 people in other noninstitutional group quarters
- 160 people in hospitals or wards for drug/alcohol abuse
- 82 people in homes or halfway houses for drug/alcohol abuse
- 57 people in other nonhousehold living situations
- 38 people in religious group quarters
- 36 people in homes for the mentally retarded
- 24 people in other group homes
- 17 people in homes for the mentally ill
- 3 people in hospitals/wards and hospices for chronically ill
- 3 people in hospices or homes for chronically ill
Banks with branches in Middletown (2011 data):
- Liberty Bank: Washington Plaza Branch, Pameacha Branch, Metro Square Branch, Liberty Cash A Check Branch, at 315 Main Street. Info updated 2011/01/06: Bank assets: $3,394.1 mil, Deposits: $2,747.0 mil, local headquarters, positive income, Commercial Lending Specialization, 43 total offices
- RBS Citizens, National Association: 225 Main Street Branch, South Main Branch, Washington Street Branch. Info updated 2007/09/19: Bank assets: $106,940.6 mil, Deposits: $75,690.2 mil, headquarters in Providence, RI, positive income, 1135 total offices, Holding Company: Uk Financial Investments Limited
- Bank of America, National Association: Middletown Branch at 267 Main Street, branch established on 1934/01/01; Washington Plaza Branch at 895 Washington Street, branch established on 1968/08/05. Info updated 2009/11/18: Bank assets: $1,451,969.3 mil, Deposits: $1,077,176.8 mil, headquarters in Charlotte, NC, positive income, 5782 total offices, Holding Company: Bank Of America Corporation
- People's United Bank: Middletown Super Stop & Shop Branch at 416 East Main Street, branch established on 1997/06/10. Info updated 2012/02/16: Bank assets: $27,319.3 mil, Deposits: $20,835.4 mil, headquarters in Bridgeport, CT, positive income, Commercial Lending Specialization, 374 total offices
- Webster Bank, National Association: Middletown-Central Branch at 363 Main Street, branch established on 1955/10/31. Info updated 2008/12/23: Bank assets: $18,674.3 mil, Deposits: $13,861.5 mil, headquarters in Waterbury, CT, positive income, Commercial Lending Specialization, 167 total offices, Holding Company: Webster Financial Corporation
- Wells Fargo Bank, National Association: Middletown Branch at 111 Washington Street, branch established on 1988/10/12. Info updated 2011/04/05: Bank assets: $1,161,490.0 mil, Deposits: $905,653.0 mil, headquarters in Sioux Falls, SD, positive income, 6395 total offices, Holding Company: Wells Fargo & Company
- TD Bank, National Association: Middletown Branch at 911 Washington St, branch established on 2010/06/30. Info updated 2010/10/04: Bank assets: $188,912.6 mil, Deposits: $153,149.8 mil, headquarters in Wilmington, DE, positive income, 1314 total offices, Holding Company: Toronto-Dominion Bank, The
For population 15 years and over in Middletown:
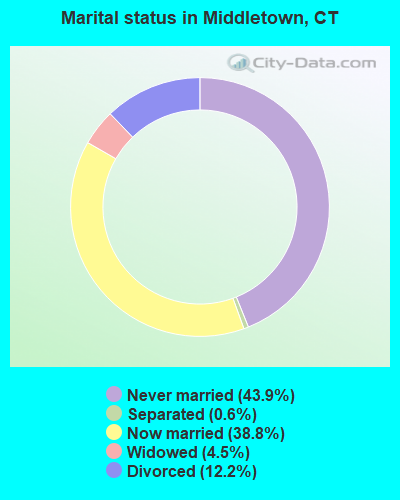
- Never married: 43.9%
- Now married: 38.8%
- Separated: 0.6%
- Widowed: 4.5%
- Divorced: 12.2%
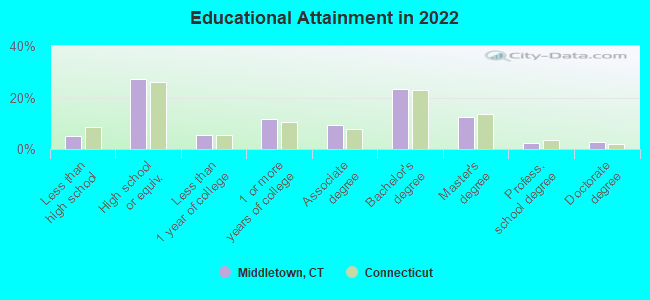
For population 25 years and over in Middletown:
- High school or higher: 94.7%
- Bachelor's degree or higher: 40.5%
- Graduate or professional degree: 17.3%
- Unemployed: 3.2%
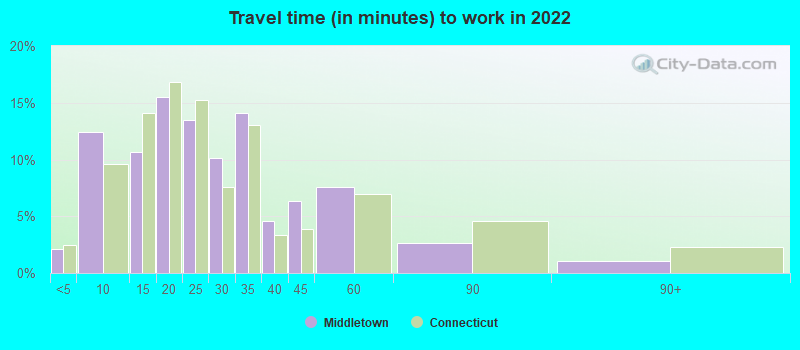
- Mean travel time to work (commute): 18.3 minutes
| Here: | 11.0 |
| Connecticut average: | 12.6 |
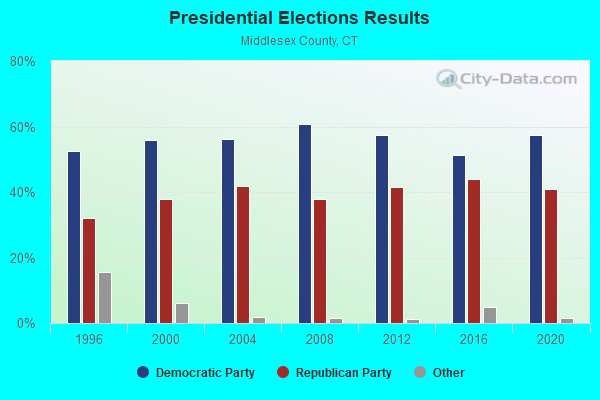
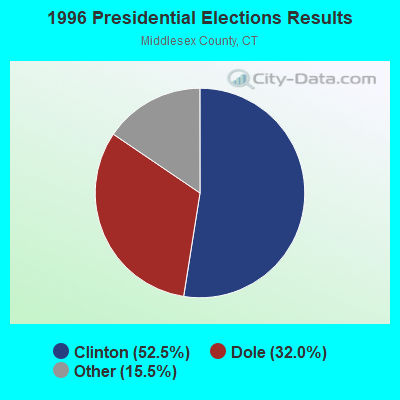
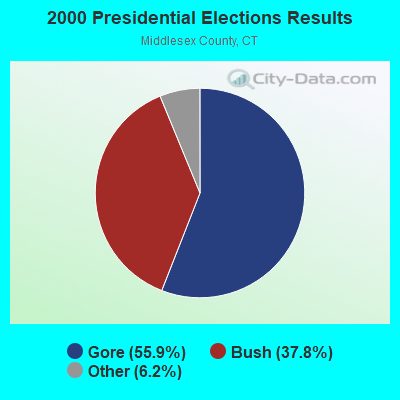
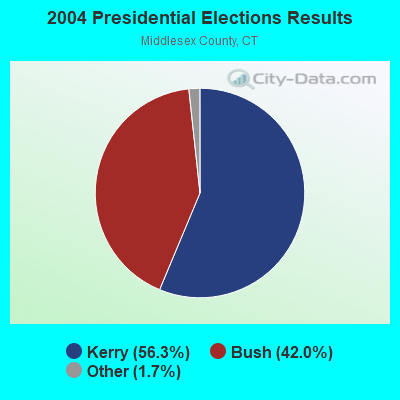
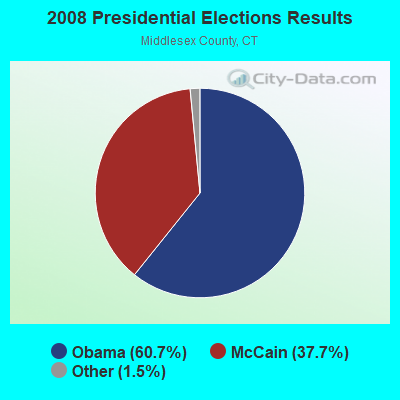
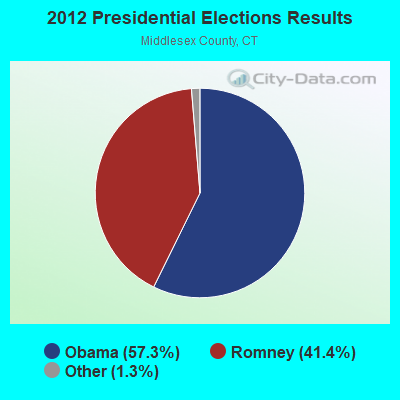
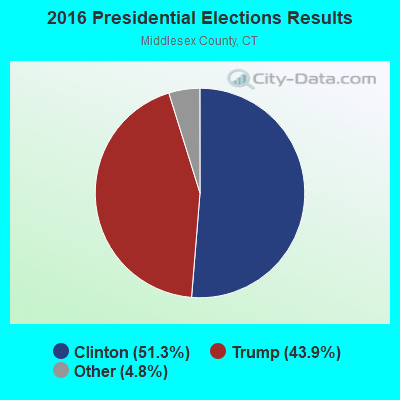

Graphs represent county-level data. Detailed 2008 Election Results
Religion statistics for Middletown, CT (based on Middlesex County data)
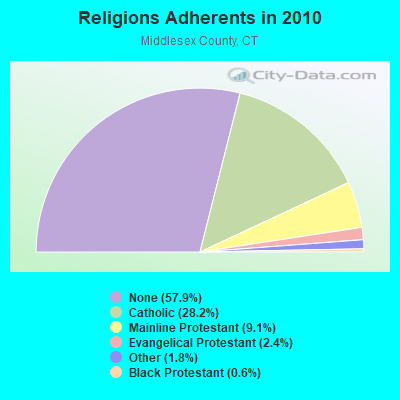
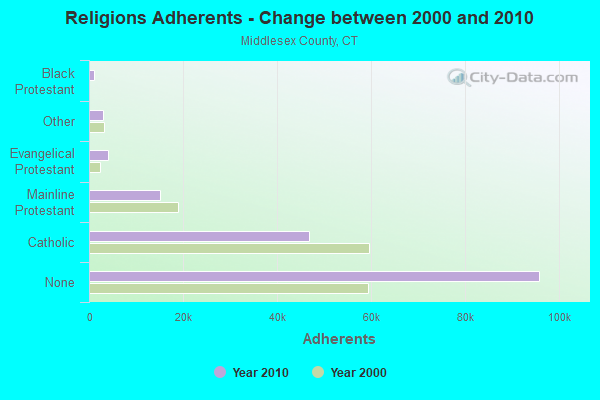
| Religion | Adherents | Congregations |
|---|---|---|
| Catholic | 46,800 | 18 |
| Mainline Protestant | 15,015 | 56 |
| Evangelical Protestant | 3,978 | 29 |
| Other | 2,921 | 11 |
| Black Protestant | 974 | 5 |
| Orthodox | 85 | 1 |
| None | 95,903 | - |
Food Environment Statistics:
| This county: | 1.71 / 10,000 pop. |
| Connecticut: | 2.21 / 10,000 pop. |
| Here: | 0.98 / 10,000 pop. |
| State: | 1.02 / 10,000 pop. |
| Middlesex County: | 2.56 / 10,000 pop. |
| State: | 2.27 / 10,000 pop. |
| Middlesex County: | 10.80 / 10,000 pop. |
| Connecticut: | 9.19 / 10,000 pop. |
| This county: | 7.0% |
| Connecticut: | 7.3% |
| Middlesex County: | 21.1% |
| Connecticut: | 21.5% |
| Middlesex County: | 13.6% |
| Connecticut: | 15.8% |
Health and Nutrition:
| Middletown: | 50.6% |
| Connecticut: | 50.0% |
| Middletown: | 48.6% |
| State: | 47.5% |
| Middletown: | 28.7 |
| State: | 28.7 |
| Middletown: | 20.2% |
| State: | 20.9% |
| Here: | 10.7% |
| Connecticut: | 10.5% |
| Middletown: | 6.8 |
| State: | 6.8 |
| This city: | 33.8% |
| Connecticut: | 34.2% |
| This city: | 57.8% |
| Connecticut: | 56.4% |
| Here: | 80.0% |
| Connecticut: | 78.9% |
More about Health and Nutrition of Middletown, CT Residents
| Local government employment and payroll (March 2019) | |||||
| Function | Full-time employees | Monthly full-time payroll | Average yearly full-time wage | Part-time employees | Monthly part-time payroll |
|---|---|---|---|---|---|
| Elementary and Secondary - Instruction | 681 | $4,022,234 | $70,876 | 129 | $366,891 |
| Elementary and Secondary - Other Total | 174 | $638,452 | $44,031 | 56 | $107,059 |
| Police Protection - Officers | 91 | $932,390 | $122,953 | 0 | $0 |
| Firefighters | 73 | $746,336 | $122,685 | 0 | $0 |
| Welfare | 40 | $220,701 | $66,210 | 12 | $23,360 |
| Other and Unallocable | 37 | $256,160 | $83,079 | 1 | $4,375 |
| Streets and Highways | 32 | $199,236 | $74,714 | 1 | $925 |
| Health | 31 | $214,022 | $82,847 | 3 | $10,865 |
| Police - Other | 22 | $143,285 | $78,155 | 0 | $0 |
| Financial Administration | 21 | $139,299 | $79,599 | 0 | $0 |
| Water Supply | 19 | $134,319 | $84,833 | 0 | $0 |
| Parks and Recreation | 19 | $92,419 | $58,370 | 53 | $57,532 |
| Sewerage | 18 | $96,233 | $64,155 | 0 | $0 |
| Solid Waste Management | 15 | $66,752 | $53,402 | 1 | $454 |
| Other Government Administration | 14 | $83,366 | $71,457 | 12 | $20,751 |
| Housing and Community Development (Local) | 6 | $44,574 | $89,148 | 0 | $0 |
| Judicial and Legal | 4 | $32,799 | $98,397 | 0 | $0 |
| Fire - Other | 2 | $15,724 | $94,344 | 0 | $0 |
| Totals for Government | 1,299 | $8,078,300 | $74,626 | 268 | $592,212 |
Middletown government finances - Expenditure in 2021 (per resident):
- Construction - Elementary and Secondary Education: $42,904,000 ($880.46)
- Current Operations - Elementary and Secondary Education: $99,002,000 ($2031.69)
General - Other: $31,490,000 ($646.23)
Solid Waste Management: $24,267,000 ($498.00)
Police Protection: $15,194,000 ($311.81)
Local Fire Protection: $12,460,000 ($255.70)
Sewerage: $6,306,000 ($129.41)
Water Utilities: $4,376,000 ($89.80)
Regular Highways: $4,343,000 ($89.13)
Financial Administration: $3,708,000 ($76.09)
Libraries: $3,306,000 ($67.84)
Central Staff Services: $2,889,000 ($59.29)
Parks and Recreation: $2,607,000 ($53.50)
Health - Other: $929,000 ($19.06)
Judicial and Legal Services: $838,000 ($17.20)
Parking Facilities: $791,000 ($16.23)
Protective Inspection and Regulation - Other: $347,000 ($7.12)
Housing and Community Development: $232,000 ($4.76)
General Public Buildings: $227,000 ($4.66)
- General - Interest on Debt: $4,059,000 ($83.30)
- Intergovernmental to Local - Other - Elementary and Secondary Education: $2,322,000 ($47.65)
- Other Capital Outlay - General - Other: $109,527,000 ($2247.68)
Elementary and Secondary Education: $1,775,000 ($36.43)
Sewerage: $1,039,000 ($21.32)
Water Utilities: $574,000 ($11.78)
Local Fire Protection: $533,000 ($10.94)
Housing and Community Development: $384,000 ($7.88)
Solid Waste Management: $81,000 ($1.66)
- Total Salaries and Wages: $58,712,000 ($1204.87)
Middletown government finances - Revenue in 2021 (per resident):
- Charges - Solid Waste Management: $23,199,000 ($476.08)
Sewerage: $8,460,000 ($173.61)
Other: $5,849,000 ($120.03)
Elementary and Secondary Education School Lunch: $1,159,000 ($23.78)
Parks and Recreation: $347,000 ($7.12)
Elementary and Secondary Education - Other: $22,000 ($0.45)
- Federal Intergovernmental - Housing and Community Development: $456,000 ($9.36)
- Local Intergovernmental - Education: $725,000 ($14.88)
- Miscellaneous - General Revenue - Other: $3,742,000 ($76.79)
Interest Earnings: $1,280,000 ($26.27)
- Revenue - Water Utilities: $5,775,000 ($118.51)
- State Intergovernmental - Education: $51,095,000 ($1048.55)
General Local Government Support: $40,477,000 ($830.66)
Other: $10,413,000 ($213.69)
Health and Hospitals: $103,000 ($2.11)
- Tax - Property: $137,455,000 ($2820.80)
Other License: $959,000 ($19.68)
Occupation and Business License - Other: $54,000 ($1.11)
Middletown government finances - Debt in 2021 (per resident):
- Long Term Debt - Beginning Outstanding - Unspecified Public Purpose: $94,754,000 ($1944.51)
Outstanding Unspecified Public Purpose: $81,602,000 ($1674.61)
Retired Unspecified Public Purpose: $13,152,000 ($269.90)
Middletown government finances - Cash and Securities in 2021 (per resident):
- Bond Funds - Cash and Securities: $8,518,000 ($174.80)
- Other Funds - Cash and Securities: $99,080,000 ($2033.29)
- Sinking Funds - Cash and Securities: $126,000 ($2.59)
| Businesses in Middletown, CT | ||||
| Name | Count | Name | Count | |
|---|---|---|---|---|
| ALDI | 1 | Lane Furniture | 1 | |
| AT&T | 1 | LensCrafters | 1 | |
| Ace Hardware | 1 | Marshalls | 1 | |
| Advance Auto Parts | 1 | MasterBrand Cabinets | 5 | |
| AutoZone | 1 | McDonald's | 2 | |
| CVS | 2 | Nike | 1 | |
| Chevrolet | 1 | Nissan | 1 | |
| Cold Stone Creamery | 1 | RadioShack | 1 | |
| Dennys | 1 | Rite Aid | 1 | |
| Domino's Pizza | 1 | Sprint Nextel | 1 | |
| DressBarn | 1 | Staples | 1 | |
| Dressbarn | 1 | Stop & Shop | 1 | |
| Dunkin Donuts | 4 | Toyota | 1 | |
| FedEx | 11 | U-Haul | 3 | |
| GNC | 2 | UPS | 10 | |
| Goodwill | 3 | Verizon Wireless | 1 | |
| H&R Block | 2 | Walgreens | 2 | |
| Home Depot | 1 | Wendy's | 1 | |
| KFC | 1 | YMCA | 1 | |
Strongest AM radio stations in Middletown:
- WMRD (1150 AM; 2 kW; MIDDLETOWN, CT; Owner: CROSSROADS COMMUNICATIONS, INC.)
- WTIC (1080 AM; 50 kW; HARTFORD, CT; Owner: INFINITY RADIO OPERATIONS INC.)
- WNNZ (640 AM; 50 kW; WESTFIELD, MA; Owner: CLEAR CHANNEL BROADCASTING LICENSES, INC.)
- WMMW (1470 AM; 2 kW; MERIDEN, CT; Owner: BUCKLEY BROADCASTING CORP OF CT)
- WPOP (1410 AM; 5 kW; HARTFORD, CT; Owner: CAPSTAR TX LIMITED PARTNERSHIP)
- WLAT (910 AM; 5 kW; NEW BRITAIN, CT; Owner: MEGA COMMUNICATIONS OF NEW BRITAIN LICENSEE, LLC)
- WXCT (990 AM; 2 kW; SOUTHINGTON, CT; Owner: THE ADD RADIO GROUP, INC.)
- WCRN (830 AM; 50 kW; WORCESTER, MA; Owner: CARTER BROADCASTING CORPORATION)
- WELI (960 AM; 5 kW; NEW HAVEN, CT; Owner: CLEAR CHANNEL BROADCASTING LICENSES, INC.)
- WALE (990 AM; 50 kW; GREENVILLE, RI; Owner: NORTH AMERICAN BROADCASTING CO., INC.)
- WFAN (660 AM; 50 kW; NEW YORK, NY; Owner: INFINITY BROADCASTING OPERATIONS, INC.)
- WRYM (840 AM; 1 kW; NEW BRITAIN, CT)
- WDRC (1360 AM; 5 kW; HARTFORD, CT; Owner: BUCKLEY BROADCASTING CORPORATION)
Strongest FM radio stations in Middletown:
- WESU (88.1 FM; MIDDLETOWN, CT; Owner: WESLEYAN UNIVERSITY)
- WIHS (104.9 FM; MIDDLETOWN, CT; Owner: CONNECTICUT RADIO FELLOWSHIP, INC.)
- WKSS (95.7 FM; HARTFORD-MERIDEN, CT; Owner: CAPSTAR TX LIMITED PARTNERSHIP)
- WWYZ (92.5 FM; WATERBURY, CT; Owner: CAPSTAR TX LIMITED PARTNERSHIP)
- WZMX (93.7 FM; HARTFORD, CT; Owner: INFINITY RADIO OPERATIONS INC.)
- WHCN (105.9 FM; HARTFORD, CT; Owner: CAPSTAR TX LIMITED PARTNERSHIP)
- WMRQ (104.1 FM; WATERBURY, CT; Owner: CAPSTAR TX LIMITED PARTNERSHIP)
- WPKT (90.5 FM; MERIDEN, CT; Owner: CONNECTICUT PUBLIC BROADCASTING, INC)
- WDRC-FM (102.9 FM; HARTFORD, CT; Owner: BUCKLEY BROADCASTING CORPORATION)
- WRCH (100.5 FM; NEW BRITAIN, CT; Owner: INFINITY RADIO OPERATIONS INC.)
- W227AJ (93.3 FM; NORTHFORD, CT; Owner: SACRED HEART UNIVERSITY)
- WKCI-FM (101.3 FM; HAMDEN, CT; Owner: CLEAR CHANNEL BROADCASTING LICENSES, INC.)
- WPLR (99.1 FM; NEW HAVEN, CT; Owner: COX RADIO, INC.)
- WTIC-FM (96.5 FM; HARTFORD, CT; Owner: INFINITY RADIO OPERATIONS INC.)
- WWUH (91.3 FM; WEST HARTFORD, CT; Owner: UNIVERSITY OF HARTFORD)
- WCCC-FM (106.9 FM; HARTFORD, CT; Owner: MARLIN BROADCASTING, LLC)
- WJMJ (88.9 FM; HARTFORD, CT; Owner: ST. THOMAS SEMINARY)
- WYBC-FM (94.3 FM; NEW HAVEN, CT; Owner: YALE BROADCASTING CO., INC.)
- WILI-FM (98.3 FM; WILLIMANTIC, CT; Owner: NUTMEG BROADCASTING COMPANY)
- WAQY (102.1 FM; SPRINGFIELD, MA; Owner: SAGA COMMUNICATIONS OF NEW ENGLAND, LLC)
TV broadcast stations around Middletown:
- WTIC-TV (Channel 61; HARTFORD, CT; Owner: TRIBUNE TELEVISION COMPANY)
- W11BJ (Channel 11; HARTFORD, CT; Owner: COMMUNICATIONS SITE MANAGEMENT LLC)
- WTXX (Channel 20; WATERBURY, CT; Owner: WTXX INC.)
- WVIT (Channel 30; NEW BRITAIN, CT; Owner: OUTLET BROADCASTING, INC)
- WEDH (Channel 24; HARTFORD, CT; Owner: CONNECTICUT PUBLIC BROADCASTING, INC.)
- WUVN (Channel 18; HARTFORD, CT; Owner: ENTRAVISION HOLDINGS, LLC)
- WTNH (Channel 8; NEW HAVEN, CT; Owner: WTNH BROADCASTING, INC.)
- WCTX (Channel 59; NEW HAVEN, CT; Owner: WTNH BROADCASTING, INC.)
- WEDY (Channel 65; NEW HAVEN, CT; Owner: CONNECTICUT PUBLIC BROADCASTING, INC.)
- WFSB (Channel 3; HARTFORD, CT; Owner: MEREDITH CORPORATION)
- WHPX (Channel 26; NEW LONDON, CT; Owner: PAXSON HARTFORD LICENSE, INC.)
- W51BZ (Channel 51; NEW HAVEN, CT; Owner: it COMMUNICATIONS, INC.)
- WHTX-LP (Channel 10; HARTFORD, CT; Owner: ENTRAVISION HOLDINGS, LLC)
- WRDM-LP (Channel 13; HARTFORD, CT; Owner: ZGS HARTFORD, INC.)
- WMLD-LP (Channel 6; HARTFORD, CT; Owner: HARVARD BROADCASTING, INC.)
- WHCT-LP (Channel 38; HARTFORD, CT; Owner: VENTURE TECHNOLOGIES GROUP, LLC)
- WYDN (Channel 48; WORCESTER, MA; Owner: EDUCATIONAL PUBLIC TV CORPORATION)
- WPXQ (Channel 69; BLOCK ISLAND, RI; Owner: OCEAN STATE TELEVISION, L.L.C.)
- WEDN (Channel 53; NORWICH, CT; Owner: CONNECTICUT PUBLIC BROADCASTING, INC.)
Medal of Honor Recipients
Medal of Honor Recipient born in Middletown: Thomas Harding.
- National Bridge Inventory (NBI) Statistics
- 62Number of bridges
- 512ft / 156mTotal length
- $4,150,000Total costs
- 999,693Total average daily traffic
- 76,326Total average daily truck traffic
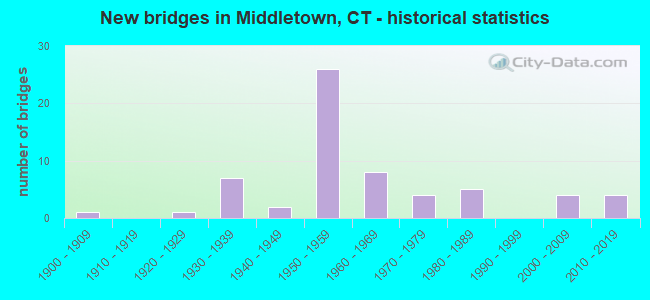
- New bridges - historical statistics
- 11900-1909
- 11920-1929
- 71930-1939
- 21940-1949
- 261950-1959
- 81960-1969
- 41970-1979
- 51980-1989
- 42000-2009
- 42010-2019
FCC Registered Commercial Land Mobile Towers: 3 (See the full list of FCC Registered Commercial Land Mobile Towers in Middletown, CT)
FCC Registered Private Land Mobile Towers: 1 (See the full list of FCC Registered Private Land Mobile Towers)
FCC Registered Broadcast Land Mobile Towers: 50 (See the full list of FCC Registered Broadcast Land Mobile Towers)
FCC Registered Microwave Towers: 24 (See the full list of FCC Registered Microwave Towers in this town)
FCC Registered Paging Towers: 5 (See the full list of FCC Registered Paging Towers)
FCC Registered Maritime Coast & Aviation Ground Towers: 2 (See the full list of FCC Registered Maritime Coast & Aviation Ground Towers)
FCC Registered Amateur Radio Licenses: 162 (See the full list of FCC Registered Amateur Radio Licenses in Middletown)
FAA Registered Aircraft: 9 (See the full list of FAA Registered Aircraft in Middletown)
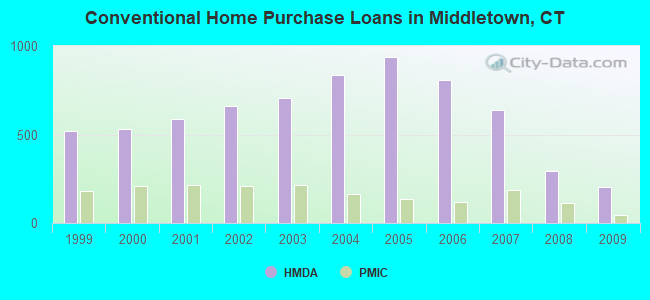
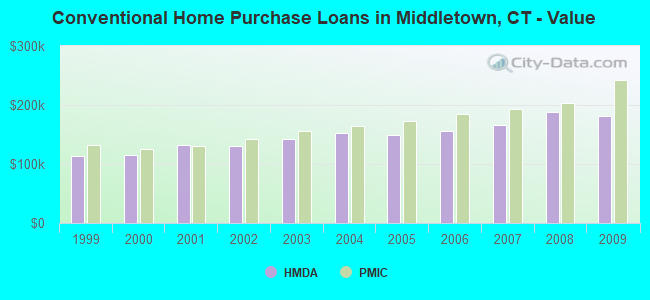
| Home Mortgage Disclosure Act Aggregated Statistics For Year 2009 (Based on 12 full tracts) | ||||||||||||||
| A) FHA, FSA/RHS & VA Home Purchase Loans | B) Conventional Home Purchase Loans | C) Refinancings | D) Home Improvement Loans | E) Loans on Dwellings For 5+ Families | F) Non-occupant Loans on < 5 Family Dwellings (A B C & D) | G) Loans On Manufactured Home Dwelling (A B C & D) | ||||||||
|---|---|---|---|---|---|---|---|---|---|---|---|---|---|---|
| Number | Average Value | Number | Average Value | Number | Average Value | Number | Average Value | Number | Average Value | Number | Average Value | Number | Average Value | |
| LOANS ORIGINATED | 295 | $189,908 | 205 | $182,132 | 835 | $188,612 | 61 | $98,344 | 0 | $0 | 26 | $136,731 | 0 | $0 |
| APPLICATIONS APPROVED, NOT ACCEPTED | 14 | $196,571 | 20 | $207,550 | 93 | $188,118 | 7 | $58,571 | 0 | $0 | 1 | $200,000 | 0 | $0 |
| APPLICATIONS DENIED | 25 | $207,360 | 29 | $162,069 | 302 | $192,815 | 46 | $44,674 | 2 | $642,500 | 17 | $125,235 | 0 | $0 |
| APPLICATIONS WITHDRAWN | 23 | $179,739 | 21 | $177,571 | 162 | $183,765 | 5 | $98,400 | 1 | $2,300,000 | 8 | $121,250 | 1 | $132,000 |
| FILES CLOSED FOR INCOMPLETENESS | 2 | $210,500 | 7 | $205,714 | 74 | $204,797 | 5 | $116,200 | 0 | $0 | 2 | $152,000 | 0 | $0 |
Detailed mortgage data for all 12 tracts in Middletown, CT
| Private Mortgage Insurance Companies Aggregated Statistics For Year 2009 (Based on 10 full tracts) | ||||
| A) Conventional Home Purchase Loans | B) Refinancings | |||
|---|---|---|---|---|
| Number | Average Value | Number | Average Value | |
| LOANS ORIGINATED | 45 | $242,511 | 20 | $269,850 |
| APPLICATIONS APPROVED, NOT ACCEPTED | 14 | $237,214 | 14 | $277,000 |
| APPLICATIONS DENIED | 12 | $251,333 | 6 | $233,833 |
| APPLICATIONS WITHDRAWN | 2 | $270,500 | 9 | $203,111 |
| FILES CLOSED FOR INCOMPLETENESS | 1 | $95,000 | 0 | $0 |
2002 - 2018 National Fire Incident Reporting System (NFIRS) incidents
- Fire incident types reported to NFIRS in Middletown, CT
- 1,73650.0%Structure Fires
- 1,07030.8%Outside Fires
- 55415.9%Mobile Property/Vehicle Fires
- 1143.3%Other
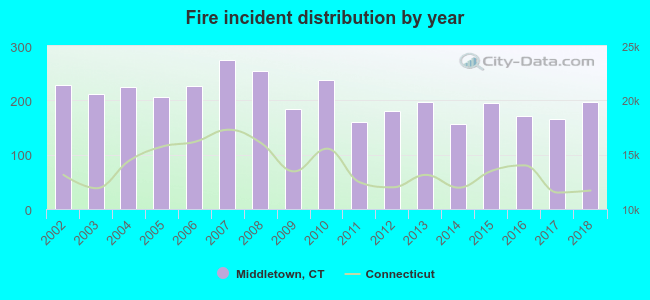 Based on the data from the years 2002 - 2018 the average number of fire incidents per year is 204. The highest number of reported fire incidents - 274 took place in 2007, and the least - 156 in 2014. The data has a declining trend.
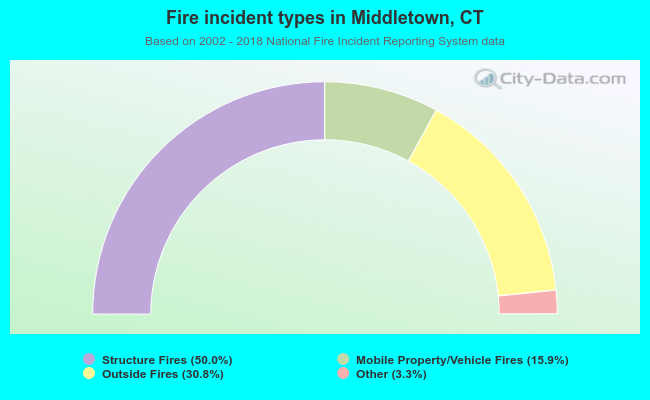 When looking into fire subcategories, the most incidents belonged to: Structure Fires (50.0%), and Outside Fires (30.8%).
Fire-safe hotels and motels in Middletown, Connecticut:
- Inn at Middletown, 70 Main St, Middletown, Connecticut 06457 , Phone: (860) 854-6300
- Passport Inn And Suites, 1310 S Main St, Middletown, Connecticut 06457 , Phone: (860) 346-7701
| Most common first names in Middletown, CT among deceased individuals | ||
| Name | Count | Lived (average) |
|---|---|---|
| Mary | 444 | 81.3 years |
| John | 439 | 74.2 years |
| Joseph | 333 | 74.8 years |
| Anna | 228 | 83.5 years |
| William | 211 | 73.9 years |
| Helen | 200 | 79.7 years |
| James | 186 | 70.7 years |
| Robert | 166 | 70.1 years |
| Frank | 165 | 76.8 years |
| Edward | 156 | 74.6 years |
| Most common last names in Middletown, CT among deceased individuals | ||
| Last name | Count | Lived (average) |
|---|---|---|
| Johnson | 108 | 78.6 years |
| Smith | 80 | 75.0 years |
| Marino | 59 | 78.9 years |
| Milardo | 56 | 81.8 years |
| Anderson | 53 | 77.7 years |
| White | 40 | 74.6 years |
| Labella | 40 | 80.5 years |
| Carta | 40 | 80.2 years |
| Russo | 37 | 77.6 years |
| Fazzino | 37 | 76.9 years |
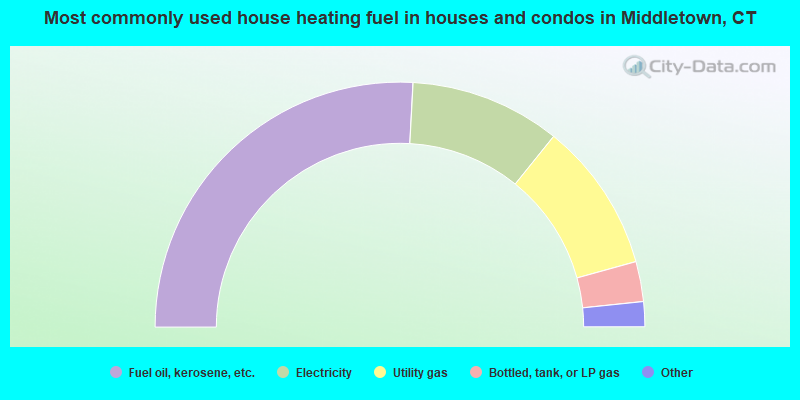
- 51.7%Fuel oil, kerosene, etc.
- 19.9%Electricity
- 19.8%Utility gas
- 5.3%Bottled, tank, or LP gas
- 1.9%Wood
- 0.7%Other fuel
- 0.3%Coal or coke
- 0.3%Solar energy
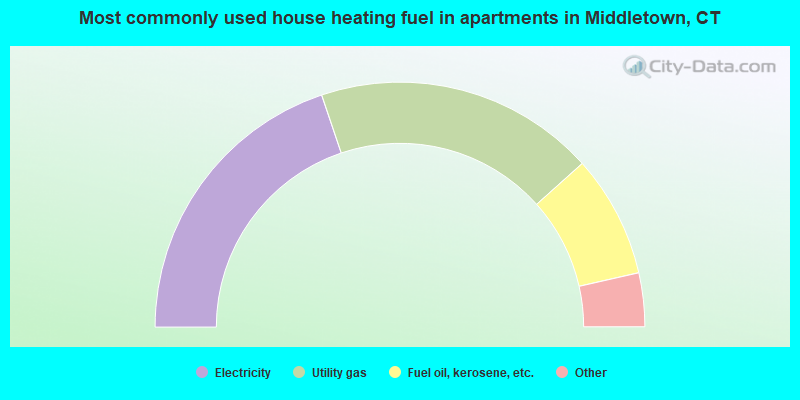
- 39.7%Electricity
- 37.1%Utility gas
- 16.2%Fuel oil, kerosene, etc.
- 3.3%No fuel used
- 2.8%Bottled, tank, or LP gas
- 0.8%Other fuel
- 0.2%Wood
Middletown compared to Connecticut state average:
- Unemployed percentage significantly below state average.
- Length of stay since moving in significantly above state average.
- Number of college students above state average.
Middletown on our top lists:
- #45 on the list of "Top 101 cities with the biggest property tax revenues per resident (population 10,000+)"
- #55 on the list of "Top 101 cities with the largest percentage of people in hospitals or wards for drug/alcohol abuse (population 1,000+)"
- #61 on the list of "Top 101 cities with the largest percentage of people in mental (psychiatric) hospitals or wards (population 1,000+)"
- #88 on the list of "Top 101 cities with the largest percentage of people in training schools for juvenile delinquents (population 1,000+)"
- #4 on the list of "Top 101 counties with the highest percentage of residents that visited a dentist within the past year"
- #11 on the list of "Top 101 counties with the best general health status score of residents (1-5), 3 years of data"
- #17 on the list of "Top 101 counties with the lowest number of births per 1000 residents 2007-2013"
- #25 on the list of "Top 101 counties with the highest average weight of females"
- #32 on the list of "Top 101 counties with the largest decrease in the number of births per 1000 residents 2000-2006 to 2007-2013 (pop 50,000+)"

|
|
Total of 1178 patent applications in 2008-2024.