Princeton: Fire Incidents, West Virginia (WV)
Where are fire incidents reported in Princeton, WV
Something went wrong! Please refresh the page.
| Fire incidents reported | |
|---|---|
| Sreet name | Count |
| OAKVALE RD | 42 |
| BECKLEY RD | 38 |
| I77 | 36 |
| STAFFORD DR | 36 |
| ATHENS RD | 34 |
| I-77 | 32 |
| MERCER ST | 30 |
| FAYETTE ST | 26 |
| NEW HOPE RD | 26 |
| WOODLAND LN | 22 |
| INGLESIDE RD | 20 |
| LOW GAP RD | 20 |
| PRINCETON AVE | 20 |
| GLENWOOD PARK RD | 18 |
| HILLTOP DR | 18 |
| MAPLE ACRES RD | 18 |
| STRALEY AVE | 18 |
| THORNTON AVE | 18 |
| US RT 460 | 18 |
| WASHINGTON AVE | 18 |
| ATHENS RD | 16 |
| BRICKYARD RD | 16 |
| GREASY RIDGE RD | 16 |
| KEE ST | 16 |
| MEADOWFIELD LN | 16 |
| OAKVALE RD | 16 |
| WALKER ST | 16 |
| ATHENS ROAD | 14 |
| CHEESY CREEK RD | 14 |
| EADS MILL ROAD | 14 |
| Other | 1,696 |
2003 - 2018 National Fire Incident Reporting System (NFIRS) incidents
- Incident types reported to NFIRS in Princeton, WV
- 2,54931.1%Hazardous Condition
- 2,35828.8%Fire
- 1,33416.3%Rescue & EMS
- 86410.5%Good Intent Call
- 6107.4%False Alarm
- 3894.7%Service Call
- 580.7%Special Incident
- 220.3%Severe Weather
- 100.1%Overpressure Rupture
- Fire incident types reported to NFIRS in Princeton, WV
- 1,24252.7%Structure Fires
- 70830.0%Outside Fires
- 29612.6%Mobile Property/Vehicle Fires
- 1124.7%Other
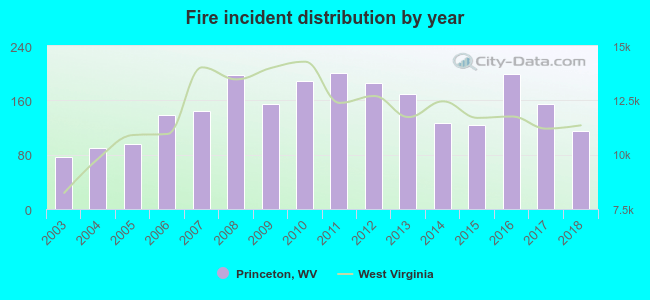 Based on the data from the years 2003 - 2018 the average number of fire incidents per year is 147. The highest number of fires - 200 took place in 2011, and the least - 76 in 2003. The data has an increasing trend.
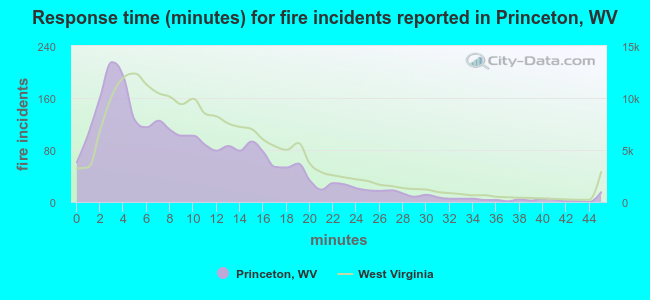 The median response time based on all reported fire incidents is 8 minutes. This is lower compared to the state median value.
The median response time in Princeton, WV compared to nearest cities:
(Note: Based on data for all years, including only cities with at least 500 fire incidents)
| Princeton: | 8 minutes |
| Bluefield: | 6 minutes |
| Bluefield: | 8 minutes |
| Hinton: | 9 minutes |
| Pulaski: | 5 minutes |
| Beckley: | 5 minutes |
| Wytheville: | 8 minutes |
| Dublin: | 7 minutes |
| Radford: | 5 minutes |
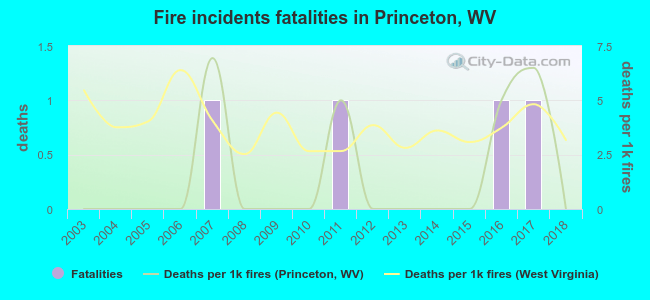 Based on the data from the years 2003 - 2018 the average number of fire-related yearly deaths is 0. The highest number of reported deaths - 1 took place in 2007, and the lowest - 0 in 2003. The data has a constant trend.
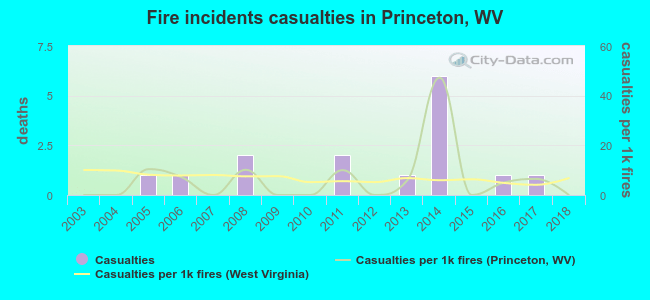 Based on the reports from the years 2003 - 2018 the average number of fire-related yearly casualties is 1. The highest number of injuries - 6 took place in 2014, and the lowest - 0 in 2003. The data has a constant trend.
The average number of injuries per 1,000 fires is 6. This indicator was the highest - 47 in 2014, and the lowest 0 in 2003. The trend for injuries per 1,000 incidents is constant. Compared to the West Virginia value the number of injuries per 1,000 fire incidents is about the same.
Based on the reports from the years 2003 - 2018 the average number of fire-related yearly casualties is 1. The highest number of injuries - 6 took place in 2014, and the lowest - 0 in 2003. The data has a constant trend.
The average number of injuries per 1,000 fires is 6. This indicator was the highest - 47 in 2014, and the lowest 0 in 2003. The trend for injuries per 1,000 incidents is constant. Compared to the West Virginia value the number of injuries per 1,000 fire incidents is about the same.
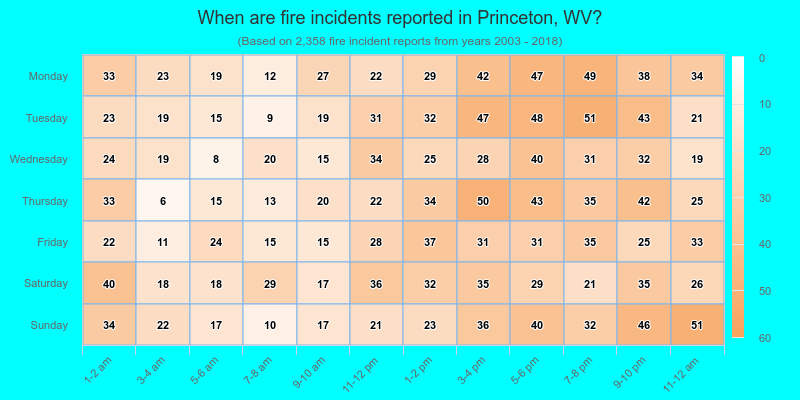
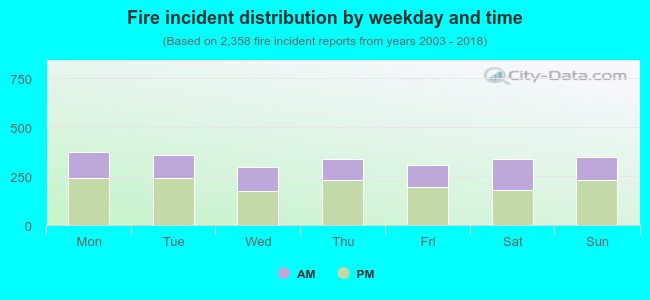 37.1% incidents where reported in the morning and 62.9% in the evening. The most fires (15.9%) took place on Monday, and the least (12.5%) on Wednesday.
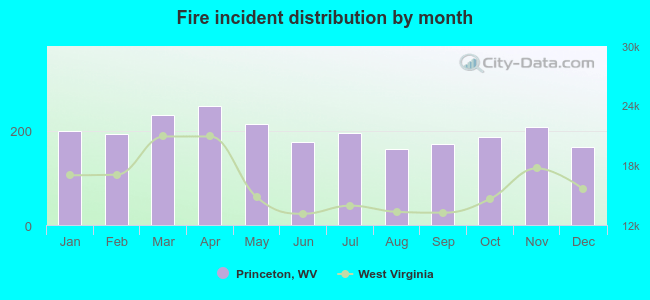 According to the 2,358 fire incidents from years 2003 - 2018 most fires (10.7%) took place during April, and the least (6.8%) in August.
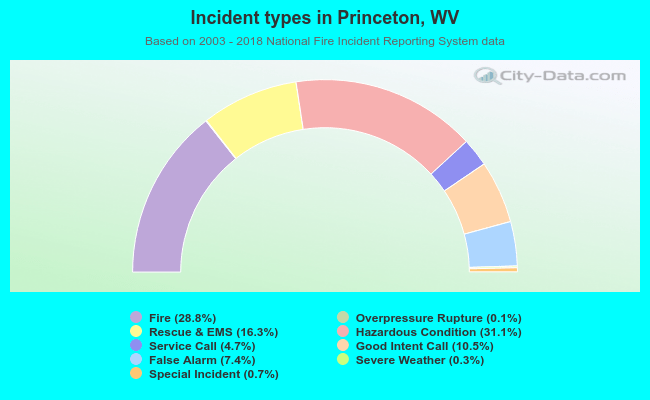 Out of all 8,194 cases reported during the years 2003 - 2018, the most belonged to the categories: Hazardous Condition (31.1%), Fire (28.8%), and Rescue & EMS (16.3%).
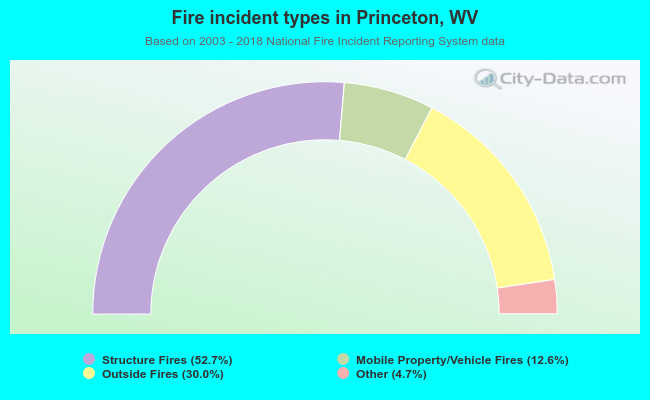 When looking into fire subcategories, the most reports belonged to: Structure Fires (52.7%), and Outside Fires (30.0%).