Reston: Fire Incidents, Virginia (VA)
Where are fire incidents reported in Reston, VA
Something went wrong! Please refresh the page.
| Fire incidents reported | |
|---|---|
| Sreet name | Count |
| SUNSET HILLS RD | 70 |
| NORTH SHORE DR | 46 |
| LAUREL GLADE CT | 42 |
| SUNRISE VALLEY DR | 36 |
| GREYWING SQ | 34 |
| COLTS NECK RD | 24 |
| RESTON PKWY | 24 |
| WIEHLE AVE | 24 |
| SOUTH LAKES DR | 22 |
| GLADE DR | 20 |
| ROYAL FERN CT | 20 |
| STONEVIEW SQ | 20 |
| BARON CAMERON AVE | 18 |
| BECONTREE LN | 18 |
| MARKET ST | 18 |
| WINTERTHUR LN | 18 |
| CASTLE ROCK SQ | 16 |
| FAIRFAX COUNTY PKWY | 16 |
| FOUNTAIN DR | 16 |
| NORTH POINT VILLAGE CTR | 16 |
| NORTHGATE SQ | 16 |
| PLAZA AMERICA DR | 16 |
| SPECTRUM CTR | 16 |
| WIEHLE AVE | 16 |
| BARON CAMERON AVE | 14 |
| EMERALD HEIGHTS CT | 12 |
| FREEDOM DR | 12 |
| FREETOWN CT | 12 |
| LAKE FAIRFAX DR | 12 |
| OLDE TIVERTON CIR | 12 |
| Other | 219 |
2004 - 2018 National Fire Incident Reporting System (NFIRS) incidents
- Incident types reported to NFIRS in Reston, VA
- 15,76566.8%Rescue & EMS
- 2,55610.8%False Alarm
- 1,8647.9%Service Call
- 1,3665.8%Good Intent Call
- 1,1224.8%Hazardous Condition
- 8753.7%Fire
- 340.1%Overpressure Rupture
- Fire incident types reported to NFIRS in Reston, VA
- 38243.7%Structure Fires
- 30134.4%Outside Fires
- 13615.5%Mobile Property/Vehicle Fires
- 566.4%Other
 Based on the data from the years 2004 - 2018 the average number of fire incidents per year is 58. The highest number of reported fires - 121 took place in 2013, and the least - 0 in 2008. The data has a growing trend.
The average number of yearly fire incidents per 10k residents in Reston, VA compared to nearest cities:
(Note: Based on data for the last 3 years, including only cities with population 5,000 and above)
| Reston: | 15.5 |
| Herndon: | 56.5 |
| Great Falls: | 20.1 |
| Sterling: | 37.0 |
| Oakton: | 10.0 |
| Vienna: | 45.6 |
| Chantilly: | 39.8 |
| Fairfax: | 120.5 |
| Dunn Loring: | 5.7 |
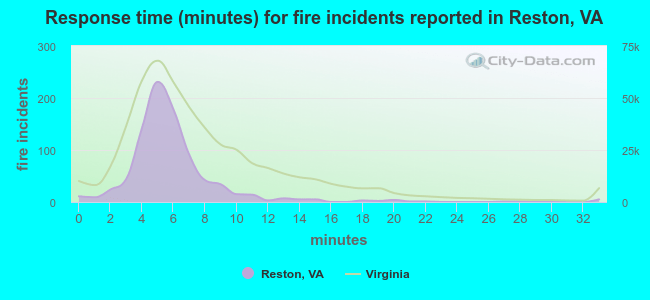 The median response time based on all reported fire incidents is 5 minutes. This is lower compared to the state median value.
The median response time in Reston, VA compared to nearest cities:
(Note: Based on data for all years, including only cities with at least 500 fire incidents)
| Reston: | 5 minutes |
| Herndon: | 5 minutes |
| Sterling: | 6 minutes |
| Vienna: | 5 minutes |
| Chantilly: | 6 minutes |
| Fairfax: | 6 minutes |
| Centreville: | 6 minutes |
| McLean: | 6 minutes |
| Ashburn: | 6 minutes |
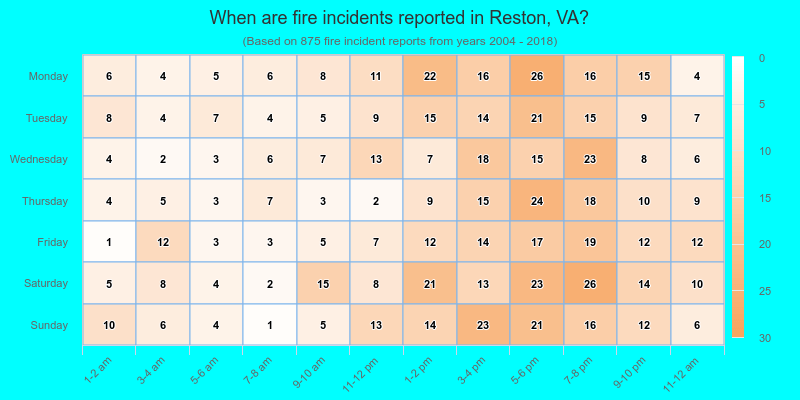
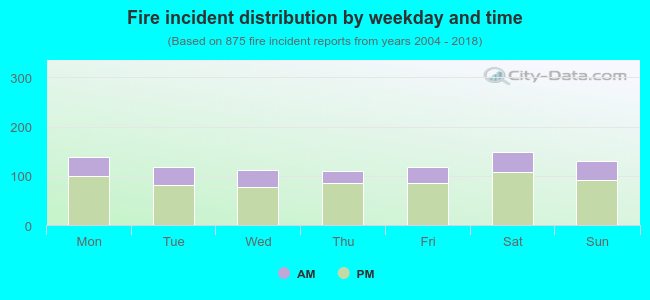 28.3% incidents where reported in the morning and 71.7% in the evening. The most fires (17.0%) took place on Saturday, and the least (12.5%) on Thursday.
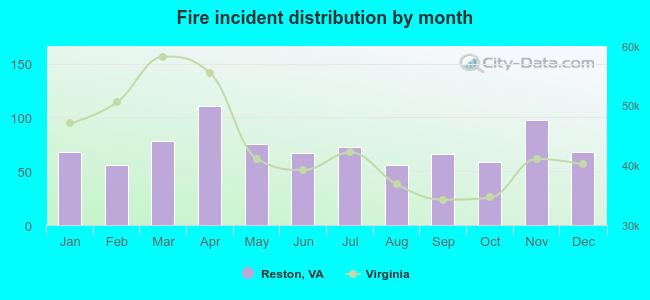 Based on the 875 incident reports from years 2004 - 2018 most fires (12.7%) took place during April, and the least (6.4%) in February.
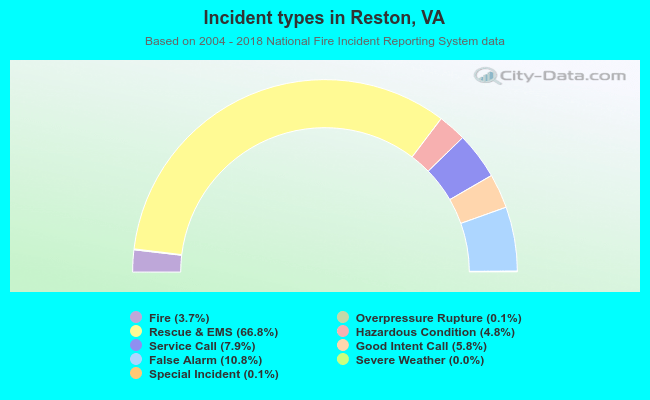 Out of all 23,604 cases reported during the years 2004 - 2018, the most belonged to the categories: Rescue & EMS (66.8%), False Alarm (10.8%), and Service Call (7.9%).
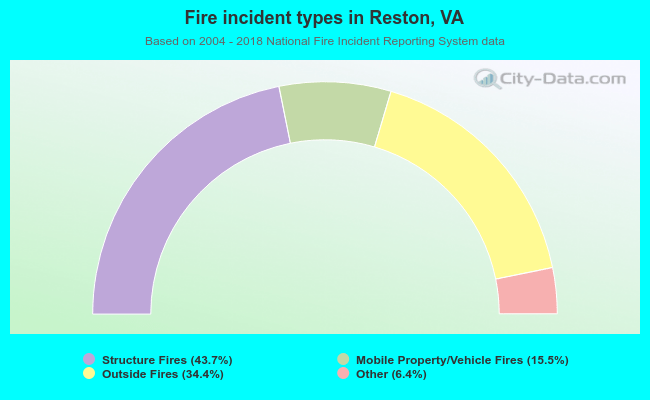 When looking into fire subcategories, the most reports belonged to: Structure Fires (43.7%), and Outside Fires (34.4%).