Oakton: Fire Incidents, Virginia (VA)
Where are fire incidents reported in Oakton, VA
Something went wrong! Please refresh the page.
|
| |||||||||||||||||||||||||||||||||||||||||||||||||||||||||||||||||||||||||||||||||||||||||||||||||||||||||||||
2006 - 2018 National Fire Incident Reporting System (NFIRS) incidents
- Incident types reported to NFIRS in Oakton, VA
- 3,48960.9%Rescue & EMS
- 72712.7%Good Intent Call
- 4568.0%Service Call
- 3896.8%False Alarm
- 3626.3%Hazardous Condition
- 2945.1%Fire
- Fire incident types reported to NFIRS in Oakton, VA
- 13846.9%Structure Fires
- 9131.0%Outside Fires
- 5518.7%Mobile Property/Vehicle Fires
- 103.4%Other
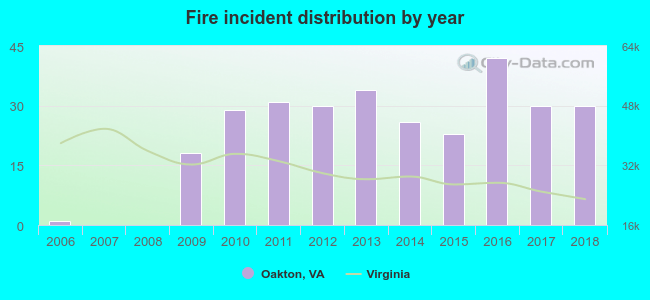 Based on the data from the years 2006 - 2018 the average number of fire incidents per year is 23. The highest number of fire incidents - 42 took place in 2016, and the least - 0 in 2007. The data has an increasing trend.
The average number of yearly fire incidents per 10k residents in Oakton, VA compared to nearest cities:
(Note: Based on data for the last 3 years, including only cities with population 5,000 and above)
| Oakton: | 10.0 |
| Vienna: | 45.6 |
| Fairfax: | 120.5 |
| Merrifield: | 1.1 |
| Dunn Loring: | 5.7 |
| Idylwood: | 6.9 |
| Annandale: | 25.5 |
| Jefferson: | 1.1 |
| Reston: | 15.5 |
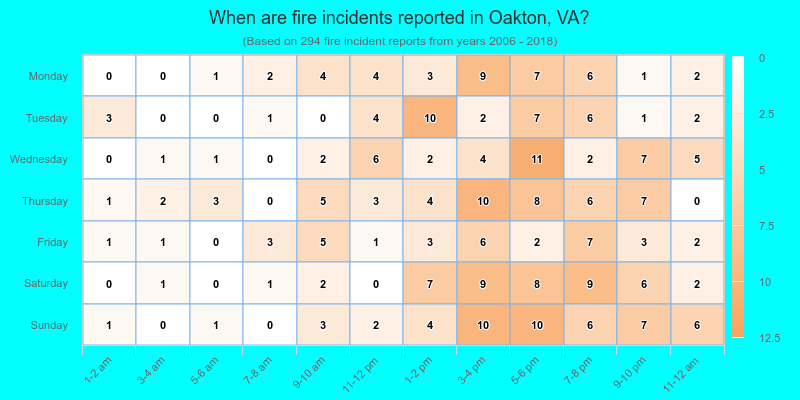
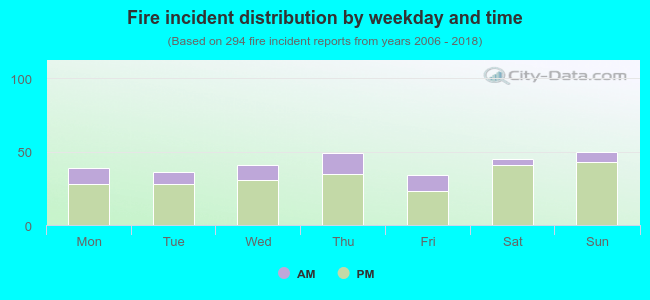 22.1% incidents where reported in the morning and 77.9% in the evening. The most fires (17.0%) took place on Sunday, and the least (11.6%) on Friday.
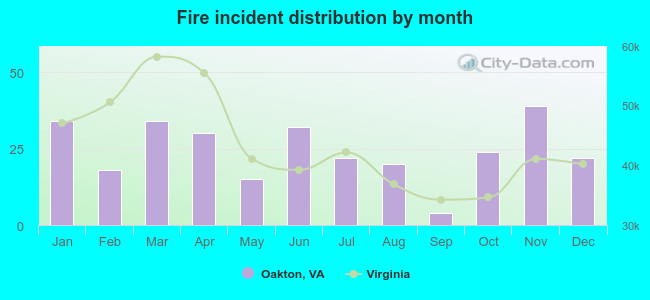 Based on the 294 fire incident reports from years 2006 - 2018 most fires (13.3%) took place during November, and the least (1.4%) in September.
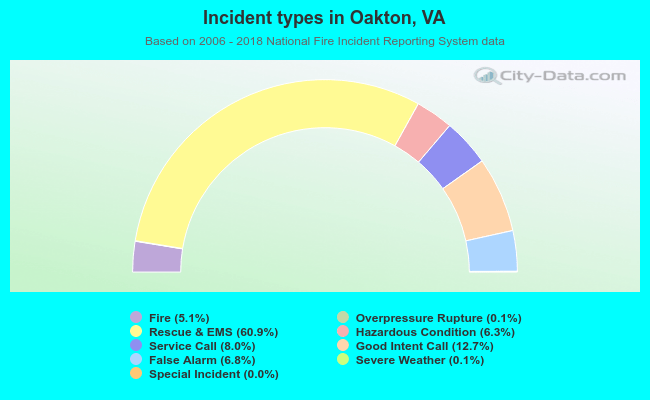 Out of all 5,728 cases reported during the years 2006 - 2018, the most belonged to the categories: Rescue & EMS (60.9%), Good Intent Call (12.7%), and Service Call (8.0%).
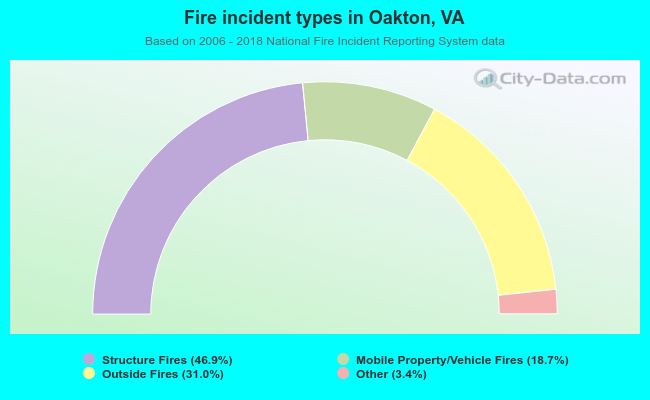 When looking into fire subcategories, the most reports belonged to: Structure Fires (46.9%), and Outside Fires (31.0%).