Oakton, Virginia Submit your own pictures of this place and show them to the world
OSM Map
General Map
Google Map
MSN Map
OSM Map
General Map
Google Map
MSN Map
OSM Map
General Map
Google Map
MSN Map
OSM Map
General Map
Google Map
MSN Map
Please wait while loading the map...
Population in 2010: 34,166. Population change since 2000: +16.4%Males: 17,055 Females: 17,111
March 2022 cost of living index in Oakton: 166.5 (very high, U.S. average is 100) Percentage of residents living in poverty in 2022: 4.8%for White Non-Hispanic residents , 10.3% for Black residents , 7.0% for Hispanic or Latino residents , 14.0% for other race residents , 6.8% for two or more races residents )
Profiles of local businesses
Business Search - 14 Million verified businesses
Data:
Median household income ($)
Median household income (% change since 2000)
Household income diversity
Ratio of average income to average house value (%)
Ratio of average income to average rent
Median household income ($) - White
Median household income ($) - Black or African American
Median household income ($) - Asian
Median household income ($) - Hispanic or Latino
Median household income ($) - American Indian and Alaska Native
Median household income ($) - Multirace
Median household income ($) - Other Race
Median household income for houses/condos with a mortgage ($)
Median household income for apartments without a mortgage ($)
Races - White alone (%)
Races - White alone (% change since 2000)
Races - Black alone (%)
Races - Black alone (% change since 2000)
Races - American Indian alone (%)
Races - American Indian alone (% change since 2000)
Races - Asian alone (%)
Races - Asian alone (% change since 2000)
Races - Hispanic (%)
Races - Hispanic (% change since 2000)
Races - Native Hawaiian and Other Pacific Islander alone (%)
Races - Native Hawaiian and Other Pacific Islander alone (% change since 2000)
Races - Two or more races (%)
Races - Two or more races (% change since 2000)
Races - Other race alone (%)
Races - Other race alone (% change since 2000)
Racial diversity
Unemployment (%)
Unemployment (% change since 2000)
Unemployment (%) - White
Unemployment (%) - Black or African American
Unemployment (%) - Asian
Unemployment (%) - Hispanic or Latino
Unemployment (%) - American Indian and Alaska Native
Unemployment (%) - Multirace
Unemployment (%) - Other Race
Population density (people per square mile)
Population - Males (%)
Population - Females (%)
Population - Males (%) - White
Population - Males (%) - Black or African American
Population - Males (%) - Asian
Population - Males (%) - Hispanic or Latino
Population - Males (%) - American Indian and Alaska Native
Population - Males (%) - Multirace
Population - Males (%) - Other Race
Population - Females (%) - White
Population - Females (%) - Black or African American
Population - Females (%) - Asian
Population - Females (%) - Hispanic or Latino
Population - Females (%) - American Indian and Alaska Native
Population - Females (%) - Multirace
Population - Females (%) - Other Race
Coronavirus confirmed cases (Apr 27, 2024)
Deaths caused by coronavirus (Apr 27, 2024)
Coronavirus confirmed cases (per 100k population) (Apr 27, 2024)
Deaths caused by coronavirus (per 100k population) (Apr 27, 2024)
Daily increase in number of cases (Apr 27, 2024)
Weekly increase in number of cases (Apr 27, 2024)
Cases doubled (in days) (Apr 27, 2024)
Hospitalized patients (Apr 18, 2022)
Negative test results (Apr 18, 2022)
Total test results (Apr 18, 2022)
COVID Vaccine doses distributed (per 100k population) (Sep 19, 2023)
COVID Vaccine doses administered (per 100k population) (Sep 19, 2023)
COVID Vaccine doses distributed (Sep 19, 2023)
COVID Vaccine doses administered (Sep 19, 2023)
Likely homosexual households (%)
Likely homosexual households (% change since 2000)
Likely homosexual households - Lesbian couples (%)
Likely homosexual households - Lesbian couples (% change since 2000)
Likely homosexual households - Gay men (%)
Likely homosexual households - Gay men (% change since 2000)
Cost of living index
Median gross rent ($)
Median contract rent ($)
Median monthly housing costs ($)
Median house or condo value ($)
Median house or condo value ($ change since 2000)
Mean house or condo value by units in structure - 1, detached ($)
Mean house or condo value by units in structure - 1, attached ($)
Mean house or condo value by units in structure - 2 ($)
Mean house or condo value by units in structure by units in structure - 3 or 4 ($)
Mean house or condo value by units in structure - 5 or more ($)
Mean house or condo value by units in structure - Boat, RV, van, etc. ($)
Mean house or condo value by units in structure - Mobile home ($)
Median house or condo value ($) - White
Median house or condo value ($) - Black or African American
Median house or condo value ($) - Asian
Median house or condo value ($) - Hispanic or Latino
Median house or condo value ($) - American Indian and Alaska Native
Median house or condo value ($) - Multirace
Median house or condo value ($) - Other Race
Median resident age
Resident age diversity
Median resident age - Males
Median resident age - Females
Median resident age - White
Median resident age - Black or African American
Median resident age - Asian
Median resident age - Hispanic or Latino
Median resident age - American Indian and Alaska Native
Median resident age - Multirace
Median resident age - Other Race
Median resident age - Males - White
Median resident age - Males - Black or African American
Median resident age - Males - Asian
Median resident age - Males - Hispanic or Latino
Median resident age - Males - American Indian and Alaska Native
Median resident age - Males - Multirace
Median resident age - Males - Other Race
Median resident age - Females - White
Median resident age - Females - Black or African American
Median resident age - Females - Asian
Median resident age - Females - Hispanic or Latino
Median resident age - Females - American Indian and Alaska Native
Median resident age - Females - Multirace
Median resident age - Females - Other Race
Commute - mean travel time to work (minutes)
Travel time to work - Less than 5 minutes (%)
Travel time to work - Less than 5 minutes (% change since 2000)
Travel time to work - 5 to 9 minutes (%)
Travel time to work - 5 to 9 minutes (% change since 2000)
Travel time to work - 10 to 19 minutes (%)
Travel time to work - 10 to 19 minutes (% change since 2000)
Travel time to work - 20 to 29 minutes (%)
Travel time to work - 20 to 29 minutes (% change since 2000)
Travel time to work - 30 to 39 minutes (%)
Travel time to work - 30 to 39 minutes (% change since 2000)
Travel time to work - 40 to 59 minutes (%)
Travel time to work - 40 to 59 minutes (% change since 2000)
Travel time to work - 60 to 89 minutes (%)
Travel time to work - 60 to 89 minutes (% change since 2000)
Travel time to work - 90 or more minutes (%)
Travel time to work - 90 or more minutes (% change since 2000)
Marital status - Never married (%)
Marital status - Now married (%)
Marital status - Separated (%)
Marital status - Widowed (%)
Marital status - Divorced (%)
Median family income ($)
Median family income (% change since 2000)
Median non-family income ($)
Median non-family income (% change since 2000)
Median per capita income ($)
Median per capita income (% change since 2000)
Median family income ($) - White
Median family income ($) - Black or African American
Median family income ($) - Asian
Median family income ($) - Hispanic or Latino
Median family income ($) - American Indian and Alaska Native
Median family income ($) - Multirace
Median family income ($) - Other Race
Median year house/condo built
Median year apartment built
Year house built - Built 2005 or later (%)
Year house built - Built 2000 to 2004 (%)
Year house built - Built 1990 to 1999 (%)
Year house built - Built 1980 to 1989 (%)
Year house built - Built 1970 to 1979 (%)
Year house built - Built 1960 to 1969 (%)
Year house built - Built 1950 to 1959 (%)
Year house built - Built 1940 to 1949 (%)
Year house built - Built 1939 or earlier (%)
Average household size
Household density (households per square mile)
Average household size - White
Average household size - Black or African American
Average household size - Asian
Average household size - Hispanic or Latino
Average household size - American Indian and Alaska Native
Average household size - Multirace
Average household size - Other Race
Occupied housing units (%)
Vacant housing units (%)
Owner occupied housing units (%)
Renter occupied housing units (%)
Vacancy status - For rent (%)
Vacancy status - For sale only (%)
Vacancy status - Rented or sold, not occupied (%)
Vacancy status - For seasonal, recreational, or occasional use (%)
Vacancy status - For migrant workers (%)
Vacancy status - Other vacant (%)
Residents with income below the poverty level (%)
Residents with income below 50% of the poverty level (%)
Children below poverty level (%)
Poor families by family type - Married-couple family (%)
Poor families by family type - Male, no wife present (%)
Poor families by family type - Female, no husband present (%)
Poverty status for native-born residents (%)
Poverty status for foreign-born residents (%)
Poverty among high school graduates not in families (%)
Poverty among people who did not graduate high school not in families (%)
Residents with income below the poverty level (%) - White
Residents with income below the poverty level (%) - Black or African American
Residents with income below the poverty level (%) - Asian
Residents with income below the poverty level (%) - Hispanic or Latino
Residents with income below the poverty level (%) - American Indian and Alaska Native
Residents with income below the poverty level (%) - Multirace
Residents with income below the poverty level (%) - Other Race
Air pollution - Air Quality Index (AQI)
Air pollution - CO
Air pollution - NO2
Air pollution - SO2
Air pollution - Ozone
Air pollution - PM10
Air pollution - PM25
Air pollution - Pb
Crime - Murders per 100,000 population
Crime - Rapes per 100,000 population
Crime - Robberies per 100,000 population
Crime - Assaults per 100,000 population
Crime - Burglaries per 100,000 population
Crime - Thefts per 100,000 population
Crime - Auto thefts per 100,000 population
Crime - Arson per 100,000 population
Crime - City-data.com crime index
Crime - Violent crime index
Crime - Property crime index
Crime - Murders per 100,000 population (5 year average)
Crime - Rapes per 100,000 population (5 year average)
Crime - Robberies per 100,000 population (5 year average)
Crime - Assaults per 100,000 population (5 year average)
Crime - Burglaries per 100,000 population (5 year average)
Crime - Thefts per 100,000 population (5 year average)
Crime - Auto thefts per 100,000 population (5 year average)
Crime - Arson per 100,000 population (5 year average)
Crime - City-data.com crime index (5 year average)
Crime - Violent crime index (5 year average)
Crime - Property crime index (5 year average)
1996 Presidential Elections Results (%) - Democratic Party (Clinton)
1996 Presidential Elections Results (%) - Republican Party (Dole)
1996 Presidential Elections Results (%) - Other
2000 Presidential Elections Results (%) - Democratic Party (Gore)
2000 Presidential Elections Results (%) - Republican Party (Bush)
2000 Presidential Elections Results (%) - Other
2004 Presidential Elections Results (%) - Democratic Party (Kerry)
2004 Presidential Elections Results (%) - Republican Party (Bush)
2004 Presidential Elections Results (%) - Other
2008 Presidential Elections Results (%) - Democratic Party (Obama)
2008 Presidential Elections Results (%) - Republican Party (McCain)
2008 Presidential Elections Results (%) - Other
2012 Presidential Elections Results (%) - Democratic Party (Obama)
2012 Presidential Elections Results (%) - Republican Party (Romney)
2012 Presidential Elections Results (%) - Other
2016 Presidential Elections Results (%) - Democratic Party (Clinton)
2016 Presidential Elections Results (%) - Republican Party (Trump)
2016 Presidential Elections Results (%) - Other
2020 Presidential Elections Results (%) - Democratic Party (Biden)
2020 Presidential Elections Results (%) - Republican Party (Trump)
2020 Presidential Elections Results (%) - Other
Ancestries Reported - Arab (%)
Ancestries Reported - Czech (%)
Ancestries Reported - Danish (%)
Ancestries Reported - Dutch (%)
Ancestries Reported - English (%)
Ancestries Reported - French (%)
Ancestries Reported - French Canadian (%)
Ancestries Reported - German (%)
Ancestries Reported - Greek (%)
Ancestries Reported - Hungarian (%)
Ancestries Reported - Irish (%)
Ancestries Reported - Italian (%)
Ancestries Reported - Lithuanian (%)
Ancestries Reported - Norwegian (%)
Ancestries Reported - Polish (%)
Ancestries Reported - Portuguese (%)
Ancestries Reported - Russian (%)
Ancestries Reported - Scotch-Irish (%)
Ancestries Reported - Scottish (%)
Ancestries Reported - Slovak (%)
Ancestries Reported - Subsaharan African (%)
Ancestries Reported - Swedish (%)
Ancestries Reported - Swiss (%)
Ancestries Reported - Ukrainian (%)
Ancestries Reported - United States (%)
Ancestries Reported - Welsh (%)
Ancestries Reported - West Indian (%)
Ancestries Reported - Other (%)
Educational Attainment - No schooling completed (%)
Educational Attainment - Less than high school (%)
Educational Attainment - High school or equivalent (%)
Educational Attainment - Less than 1 year of college (%)
Educational Attainment - 1 or more years of college (%)
Educational Attainment - Associate degree (%)
Educational Attainment - Bachelor's degree (%)
Educational Attainment - Master's degree (%)
Educational Attainment - Professional school degree (%)
Educational Attainment - Doctorate degree (%)
School Enrollment - Nursery, preschool (%)
School Enrollment - Kindergarten (%)
School Enrollment - Grade 1 to 4 (%)
School Enrollment - Grade 5 to 8 (%)
School Enrollment - Grade 9 to 12 (%)
School Enrollment - College undergrad (%)
School Enrollment - Graduate or professional (%)
School Enrollment - Not enrolled in school (%)
School enrollment - Public schools (%)
School enrollment - Private schools (%)
School enrollment - Not enrolled (%)
Median number of rooms in houses and condos
Median number of rooms in apartments
Housing units lacking complete plumbing facilities (%)
Housing units lacking complete kitchen facilities (%)
Density of houses
Urban houses (%)
Rural houses (%)
Households with people 60 years and over (%)
Households with people 65 years and over (%)
Households with people 75 years and over (%)
Households with one or more nonrelatives (%)
Households with no nonrelatives (%)
Population in households (%)
Family households (%)
Nonfamily households (%)
Population in families (%)
Family households with own children (%)
Median number of bedrooms in owner occupied houses
Mean number of bedrooms in owner occupied houses
Median number of bedrooms in renter occupied houses
Mean number of bedrooms in renter occupied houses
Median number of vehichles in owner occupied houses
Mean number of vehichles in owner occupied houses
Median number of vehichles in renter occupied houses
Mean number of vehichles in renter occupied houses
Mortgage status - with mortgage (%)
Mortgage status - with second mortgage (%)
Mortgage status - with home equity loan (%)
Mortgage status - with both second mortgage and home equity loan (%)
Mortgage status - without a mortgage (%)
Average family size
Average family size - White
Average family size - Black or African American
Average family size - Asian
Average family size - Hispanic or Latino
Average family size - American Indian and Alaska Native
Average family size - Multirace
Average family size - Other Race
Geographical mobility - Same house 1 year ago (%)
Geographical mobility - Moved within same county (%)
Geographical mobility - Moved from different county within same state (%)
Geographical mobility - Moved from different state (%)
Geographical mobility - Moved from abroad (%)
Place of birth - Born in state of residence (%)
Place of birth - Born in other state (%)
Place of birth - Native, outside of US (%)
Place of birth - Foreign born (%)
Housing units in structures - 1, detached (%)
Housing units in structures - 1, attached (%)
Housing units in structures - 2 (%)
Housing units in structures - 3 or 4 (%)
Housing units in structures - 5 to 9 (%)
Housing units in structures - 10 to 19 (%)
Housing units in structures - 20 to 49 (%)
Housing units in structures - 50 or more (%)
Housing units in structures - Mobile home (%)
Housing units in structures - Boat, RV, van, etc. (%)
House/condo owner moved in on average (years ago)
Renter moved in on average (years ago)
Year householder moved into unit - Moved in 1999 to March 2000 (%)
Year householder moved into unit - Moved in 1995 to 1998 (%)
Year householder moved into unit - Moved in 1990 to 1994 (%)
Year householder moved into unit - Moved in 1980 to 1989 (%)
Year householder moved into unit - Moved in 1970 to 1979 (%)
Year householder moved into unit - Moved in 1969 or earlier (%)
Means of transportation to work - Drove car alone (%)
Means of transportation to work - Carpooled (%)
Means of transportation to work - Public transportation (%)
Means of transportation to work - Bus or trolley bus (%)
Means of transportation to work - Streetcar or trolley car (%)
Means of transportation to work - Subway or elevated (%)
Means of transportation to work - Railroad (%)
Means of transportation to work - Ferryboat (%)
Means of transportation to work - Taxicab (%)
Means of transportation to work - Motorcycle (%)
Means of transportation to work - Bicycle (%)
Means of transportation to work - Walked (%)
Means of transportation to work - Other means (%)
Working at home (%)
Industry diversity
Most Common Industries - Agriculture, forestry, fishing and hunting, and mining (%)
Most Common Industries - Agriculture, forestry, fishing and hunting (%)
Most Common Industries - Mining, quarrying, and oil and gas extraction (%)
Most Common Industries - Construction (%)
Most Common Industries - Manufacturing (%)
Most Common Industries - Wholesale trade (%)
Most Common Industries - Retail trade (%)
Most Common Industries - Transportation and warehousing, and utilities (%)
Most Common Industries - Transportation and warehousing (%)
Most Common Industries - Utilities (%)
Most Common Industries - Information (%)
Most Common Industries - Finance and insurance, and real estate and rental and leasing (%)
Most Common Industries - Finance and insurance (%)
Most Common Industries - Real estate and rental and leasing (%)
Most Common Industries - Professional, scientific, and management, and administrative and waste management services (%)
Most Common Industries - Professional, scientific, and technical services (%)
Most Common Industries - Management of companies and enterprises (%)
Most Common Industries - Administrative and support and waste management services (%)
Most Common Industries - Educational services, and health care and social assistance (%)
Most Common Industries - Educational services (%)
Most Common Industries - Health care and social assistance (%)
Most Common Industries - Arts, entertainment, and recreation, and accommodation and food services (%)
Most Common Industries - Arts, entertainment, and recreation (%)
Most Common Industries - Accommodation and food services (%)
Most Common Industries - Other services, except public administration (%)
Most Common Industries - Public administration (%)
Occupation diversity
Most Common Occupations - Management, business, science, and arts occupations (%)
Most Common Occupations - Management, business, and financial occupations (%)
Most Common Occupations - Management occupations (%)
Most Common Occupations - Business and financial operations occupations (%)
Most Common Occupations - Computer, engineering, and science occupations (%)
Most Common Occupations - Computer and mathematical occupations (%)
Most Common Occupations - Architecture and engineering occupations (%)
Most Common Occupations - Life, physical, and social science occupations (%)
Most Common Occupations - Education, legal, community service, arts, and media occupations (%)
Most Common Occupations - Community and social service occupations (%)
Most Common Occupations - Legal occupations (%)
Most Common Occupations - Education, training, and library occupations (%)
Most Common Occupations - Arts, design, entertainment, sports, and media occupations (%)
Most Common Occupations - Healthcare practitioners and technical occupations (%)
Most Common Occupations - Health diagnosing and treating practitioners and other technical occupations (%)
Most Common Occupations - Health technologists and technicians (%)
Most Common Occupations - Service occupations (%)
Most Common Occupations - Healthcare support occupations (%)
Most Common Occupations - Protective service occupations (%)
Most Common Occupations - Fire fighting and prevention, and other protective service workers including supervisors (%)
Most Common Occupations - Law enforcement workers including supervisors (%)
Most Common Occupations - Food preparation and serving related occupations (%)
Most Common Occupations - Building and grounds cleaning and maintenance occupations (%)
Most Common Occupations - Personal care and service occupations (%)
Most Common Occupations - Sales and office occupations (%)
Most Common Occupations - Sales and related occupations (%)
Most Common Occupations - Office and administrative support occupations (%)
Most Common Occupations - Natural resources, construction, and maintenance occupations (%)
Most Common Occupations - Farming, fishing, and forestry occupations (%)
Most Common Occupations - Construction and extraction occupations (%)
Most Common Occupations - Installation, maintenance, and repair occupations (%)
Most Common Occupations - Production, transportation, and material moving occupations (%)
Most Common Occupations - Production occupations (%)
Most Common Occupations - Transportation occupations (%)
Most Common Occupations - Material moving occupations (%)
People in Group quarters - Institutionalized population (%)
People in Group quarters - Correctional institutions (%)
People in Group quarters - Federal prisons and detention centers (%)
People in Group quarters - Halfway houses (%)
People in Group quarters - Local jails and other confinement facilities (including police lockups) (%)
People in Group quarters - Military disciplinary barracks (%)
People in Group quarters - State prisons (%)
People in Group quarters - Other types of correctional institutions (%)
People in Group quarters - Nursing homes (%)
People in Group quarters - Hospitals/wards, hospices, and schools for the handicapped (%)
People in Group quarters - Hospitals/wards and hospices for chronically ill (%)
People in Group quarters - Hospices or homes for chronically ill (%)
People in Group quarters - Military hospitals or wards for chronically ill (%)
People in Group quarters - Other hospitals or wards for chronically ill (%)
People in Group quarters - Hospitals or wards for drug/alcohol abuse (%)
People in Group quarters - Mental (Psychiatric) hospitals or wards (%)
People in Group quarters - Schools, hospitals, or wards for the mentally retarded (%)
People in Group quarters - Schools, hospitals, or wards for the physically handicapped (%)
People in Group quarters - Institutions for the deaf (%)
People in Group quarters - Institutions for the blind (%)
People in Group quarters - Orthopedic wards and institutions for the physically handicapped (%)
People in Group quarters - Wards in general hospitals for patients who have no usual home elsewhere (%)
People in Group quarters - Wards in military hospitals for patients who have no usual home elsewhere (%)
People in Group quarters - Juvenile institutions (%)
People in Group quarters - Long-term care (%)
People in Group quarters - Homes for abused, dependent, and neglected children (%)
People in Group quarters - Residential treatment centers for emotionally disturbed children (%)
People in Group quarters - Training schools for juvenile delinquents (%)
People in Group quarters - Short-term care, detention or diagnostic centers for delinquent children (%)
People in Group quarters - Type of juvenile institution unknown (%)
People in Group quarters - Noninstitutionalized population (%)
People in Group quarters - College dormitories (includes college quarters off campus) (%)
People in Group quarters - Military quarters (%)
People in Group quarters - On base (%)
People in Group quarters - Barracks, unaccompanied personnel housing (UPH), (Enlisted/Officer), ;and similar group living quarters for military personnel (%)
People in Group quarters - Transient quarters for temporary residents (%)
People in Group quarters - Military ships (%)
People in Group quarters - Group homes (%)
People in Group quarters - Homes or halfway houses for drug/alcohol abuse (%)
People in Group quarters - Homes for the mentally ill (%)
People in Group quarters - Homes for the mentally retarded (%)
People in Group quarters - Homes for the physically handicapped (%)
People in Group quarters - Other group homes (%)
People in Group quarters - Religious group quarters (%)
People in Group quarters - Dormitories (%)
People in Group quarters - Agriculture workers' dormitories on farms (%)
People in Group quarters - Job Corps and vocational training facilities (%)
People in Group quarters - Other workers' dormitories (%)
People in Group quarters - Crews of maritime vessels (%)
People in Group quarters - Other nonhousehold living situations (%)
People in Group quarters - Other noninstitutional group quarters (%)
Residents speaking English at home (%)
Residents speaking English at home - Born in the United States (%)
Residents speaking English at home - Native, born elsewhere (%)
Residents speaking English at home - Foreign born (%)
Residents speaking Spanish at home (%)
Residents speaking Spanish at home - Born in the United States (%)
Residents speaking Spanish at home - Native, born elsewhere (%)
Residents speaking Spanish at home - Foreign born (%)
Residents speaking other language at home (%)
Residents speaking other language at home - Born in the United States (%)
Residents speaking other language at home - Native, born elsewhere (%)
Residents speaking other language at home - Foreign born (%)
Class of Workers - Employee of private company (%)
Class of Workers - Self-employed in own incorporated business (%)
Class of Workers - Private not-for-profit wage and salary workers (%)
Class of Workers - Local government workers (%)
Class of Workers - State government workers (%)
Class of Workers - Federal government workers (%)
Class of Workers - Self-employed workers in own not incorporated business and Unpaid family workers (%)
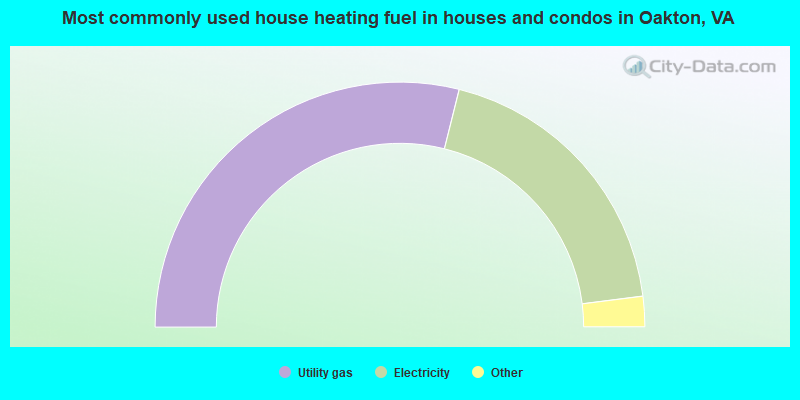
House heating fuel used in houses and condos - Utility gas (%)
House heating fuel used in houses and condos - Bottled, tank, or LP gas (%)
House heating fuel used in houses and condos - Electricity (%)
House heating fuel used in houses and condos - Fuel oil, kerosene, etc. (%)
House heating fuel used in houses and condos - Coal or coke (%)
House heating fuel used in houses and condos - Wood (%)
House heating fuel used in houses and condos - Solar energy (%)
House heating fuel used in houses and condos - Other fuel (%)
House heating fuel used in houses and condos - No fuel used (%)
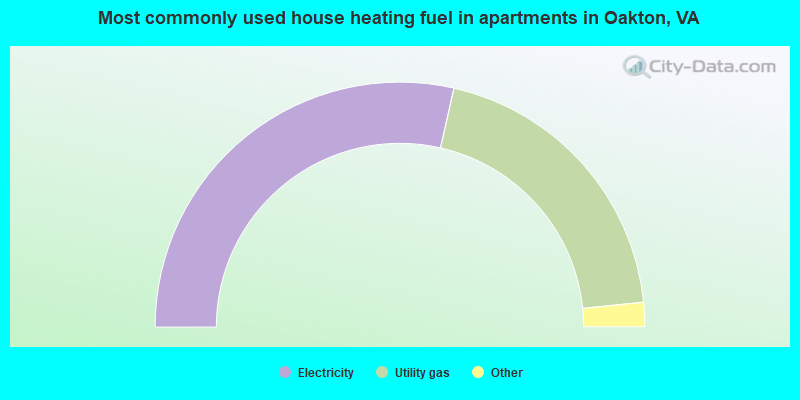
House heating fuel used in apartments - Utility gas (%)
House heating fuel used in apartments - Bottled, tank, or LP gas (%)
House heating fuel used in apartments - Electricity (%)
House heating fuel used in apartments - Fuel oil, kerosene, etc. (%)
House heating fuel used in apartments - Coal or coke (%)
House heating fuel used in apartments - Wood (%)
House heating fuel used in apartments - Solar energy (%)
House heating fuel used in apartments - Other fuel (%)
House heating fuel used in apartments - No fuel used (%)
Armed forces status - In Armed Forces (%)
Armed forces status - Civilian (%)
Armed forces status - Civilian - Veteran (%)
Armed forces status - Civilian - Nonveteran (%)
Fatal accidents locations in years 2005-2021
Fatal accidents locations in 2005
Fatal accidents locations in 2006
Fatal accidents locations in 2007
Fatal accidents locations in 2008
Fatal accidents locations in 2009
Fatal accidents locations in 2010
Fatal accidents locations in 2011
Fatal accidents locations in 2012
Fatal accidents locations in 2013
Fatal accidents locations in 2014
Fatal accidents locations in 2015
Fatal accidents locations in 2016
Fatal accidents locations in 2017
Fatal accidents locations in 2018
Fatal accidents locations in 2019
Fatal accidents locations in 2020
Fatal accidents locations in 2021
Alcohol use - People drinking some alcohol every month (%)
Alcohol use - People not drinking at all (%)
Alcohol use - Average days/month drinking alcohol
Alcohol use - Average drinks/week
Alcohol use - Average days/year people drink much
Audiometry - Average condition of hearing (%)
Audiometry - People that can hear a whisper from across a quiet room (%)
Audiometry - People that can hear normal voice from across a quiet room (%)
Audiometry - Ears ringing, roaring, buzzing (%)
Audiometry - Had a job exposure to loud noise (%)
Audiometry - Had off-work exposure to loud noise (%)
Blood Pressure & Cholesterol - Has high blood pressure (%)
Blood Pressure & Cholesterol - Checking blood pressure at home (%)
Blood Pressure & Cholesterol - Frequently checking blood cholesterol (%)
Blood Pressure & Cholesterol - Has high cholesterol level (%)
Consumer Behavior - Money monthly spent on food at supermarket/grocery store
Consumer Behavior - Money monthly spent on food at other stores
Consumer Behavior - Money monthly spent on eating out
Consumer Behavior - Money monthly spent on carryout/delivered foods
Consumer Behavior - Income spent on food at supermarket/grocery store (%)
Consumer Behavior - Income spent on food at other stores (%)
Consumer Behavior - Income spent on eating out (%)
Consumer Behavior - Income spent on carryout/delivered foods (%)
Current Health Status - General health condition (%)
Current Health Status - Blood donors (%)
Current Health Status - Has blood ever tested for HIV virus (%)
Current Health Status - Left-handed people (%)
Dermatology - People using sunscreen (%)
Diabetes - Diabetics (%)
Diabetes - Had a blood test for high blood sugar (%)
Diabetes - People taking insulin (%)
Diet Behavior & Nutrition - Diet health (%)
Diet Behavior & Nutrition - Milk product consumption (# of products/month)
Diet Behavior & Nutrition - Meals not home prepared (#/week)
Diet Behavior & Nutrition - Meals from fast food or pizza place (#/week)
Diet Behavior & Nutrition - Ready-to-eat foods (#/month)
Diet Behavior & Nutrition - Frozen meals/pizza (#/month)
Drug Use - People that ever used marijuana or hashish (%)
Drug Use - Ever used hard drugs (%)
Drug Use - Ever used any form of cocaine (%)
Drug Use - Ever used heroin (%)
Drug Use - Ever used methamphetamine (%)
Health Insurance - People covered by health insurance (%)
Kidney Conditions-Urology - Avg. # of times urinating at night
Medical Conditions - People with asthma (%)
Medical Conditions - People with anemia (%)
Medical Conditions - People with psoriasis (%)
Medical Conditions - People with overweight (%)
Medical Conditions - Elderly people having difficulties in thinking or remembering (%)
Medical Conditions - People who ever received blood transfusion (%)
Medical Conditions - People having trouble seeing even with glass/contacts (%)
Medical Conditions - People with arthritis (%)
Medical Conditions - People with gout (%)
Medical Conditions - People with congestive heart failure (%)
Medical Conditions - People with coronary heart disease (%)
Medical Conditions - People with angina pectoris (%)
Medical Conditions - People who ever had heart attack (%)
Medical Conditions - People who ever had stroke (%)
Medical Conditions - People with emphysema (%)
Medical Conditions - People with thyroid problem (%)
Medical Conditions - People with chronic bronchitis (%)
Medical Conditions - People with any liver condition (%)
Medical Conditions - People who ever had cancer or malignancy (%)
Mental Health - People who have little interest in doing things (%)
Mental Health - People feeling down, depressed, or hopeless (%)
Mental Health - People who have trouble sleeping or sleeping too much (%)
Mental Health - People feeling tired or having little energy (%)
Mental Health - People with poor appetite or overeating (%)
Mental Health - People feeling bad about themself (%)
Mental Health - People who have trouble concentrating on things (%)
Mental Health - People moving or speaking slowly or too fast (%)
Mental Health - People having thoughts they would be better off dead (%)
Oral Health - Average years since last visit a dentist
Oral Health - People embarrassed because of mouth (%)
Oral Health - People with gum disease (%)
Oral Health - General health of teeth and gums (%)
Oral Health - Average days a week using dental floss/device
Oral Health - Average days a week using mouthwash for dental problem
Oral Health - Average number of teeth
Pesticide Use - Households using pesticides to control insects (%)
Pesticide Use - Households using pesticides to kill weeds (%)
Physical Activity - People doing vigorous-intensity work activities (%)
Physical Activity - People doing moderate-intensity work activities (%)
Physical Activity - People walking or bicycling (%)
Physical Activity - People doing vigorous-intensity recreational activities (%)
Physical Activity - People doing moderate-intensity recreational activities (%)
Physical Activity - Average hours a day doing sedentary activities
Physical Activity - Average hours a day watching TV or videos
Physical Activity - Average hours a day using computer
Physical Functioning - People having limitations keeping them from working (%)
Physical Functioning - People limited in amount of work they can do (%)
Physical Functioning - People that need special equipment to walk (%)
Physical Functioning - People experiencing confusion/memory problems (%)
Physical Functioning - People requiring special healthcare equipment (%)
Prescription Medications - Average number of prescription medicines taking
Preventive Aspirin Use - Adults 40+ taking low-dose aspirin (%)
Reproductive Health - Vaginal deliveries (%)
Reproductive Health - Cesarean deliveries (%)
Reproductive Health - Deliveries resulted in a live birth (%)
Reproductive Health - Pregnancies resulted in a delivery (%)
Reproductive Health - Women breastfeeding newborns (%)
Reproductive Health - Women that had a hysterectomy (%)
Reproductive Health - Women that had both ovaries removed (%)
Reproductive Health - Women that have ever taken birth control pills (%)
Reproductive Health - Women taking birth control pills (%)
Reproductive Health - Women that have ever used Depo-Provera or injectables (%)
Reproductive Health - Women that have ever used female hormones (%)
Sexual Behavior - People 18+ that ever had sex (vaginal, anal, or oral) (%)
Sexual Behavior - Males 18+ that ever had vaginal sex with a woman (%)
Sexual Behavior - Males 18+ that ever performed oral sex on a woman (%)
Sexual Behavior - Males 18+ that ever had anal sex with a woman (%)
Sexual Behavior - Males 18+ that ever had any sex with a man (%)
Sexual Behavior - Females 18+ that ever had vaginal sex with a man (%)
Sexual Behavior - Females 18+ that ever performed oral sex on a man (%)
Sexual Behavior - Females 18+ that ever had anal sex with a man (%)
Sexual Behavior - Females 18+ that ever had any kind of sex with a woman (%)
Sexual Behavior - Average age people first had sex
Sexual Behavior - Average number of female sex partners in lifetime (males 18+)
Sexual Behavior - Average number of female vaginal sex partners in lifetime (males 18+)
Sexual Behavior - Average age people first performed oral sex on a woman (18+)
Sexual Behavior - Average number of woman performed oral sex on in lifetime (18+)
Sexual Behavior - Average number of male sex partners in lifetime (males 18+)
Sexual Behavior - Average number of male anal sex partners in lifetime (males 18+)
Sexual Behavior - Average age people first performed oral sex on a man (18+)
Sexual Behavior - Average number of male oral sex partners in lifetime (18+)
Sexual Behavior - People using protection when performing oral sex (%)
Sexual Behavior - Average number of times people have vaginal or anal sex a year
Sexual Behavior - People having sex without condom (%)
Sexual Behavior - Average number of male sex partners in lifetime (females 18+)
Sexual Behavior - Average number of male vaginal sex partners in lifetime (females 18+)
Sexual Behavior - Average number of female sex partners in lifetime (females 18+)
Sexual Behavior - Circumcised males 18+ (%)
Sleep Disorders - Average hours sleeping at night
Sleep Disorders - People that has trouble sleeping (%)
Smoking-Cigarette Use - People smoking cigarettes (%)
Taste & Smell - People 40+ having problems with smell (%)
Taste & Smell - People 40+ having problems with taste (%)
Taste & Smell - People 40+ that ever had wisdom teeth removed (%)
Taste & Smell - People 40+ that ever had tonsils teeth removed (%)
Taste & Smell - People 40+ that ever had a loss of consciousness because of a head injury (%)
Taste & Smell - People 40+ that ever had a broken nose or other serious injury to face or skull (%)
Taste & Smell - People 40+ that ever had two or more sinus infections (%)
Weight - Average height (inches)
Weight - Average weight (pounds)
Weight - Average BMI
Weight - People that are obese (%)
Weight - People that ever were obese (%)
Weight - People trying to lose weight (%)
According to our research of Virginia and other state lists, there were 7 registered sex offenders living in Oakton, Virginia as of April 27, 2024 . The ratio of all residents to sex offenders in Oakton is 5,276 to 1.The ratio of registered sex offenders to all residents in this city is much lower than the state average.
Latest news from Oakton, VA collected exclusively by city-data.com from local newspapers, TV, and radio stations
Ancestries: American (4.3%), Italian (3.9%), European (3.7%), English (3.7%), German (3.5%), Irish (3.3%).
Current Local Time:
Land area: 9.70 square miles.
Population density: 3,521 people per square mile (average).
11,889 residents are foreign born (19.5% Asia , 6.2% Latin America , 3.4% Africa ).
This place:
32.7%Virginia:
12.6%
Median real estate property taxes paid for housing units with mortgages in 2022: $8,043 (1.0%)Median real estate property taxes paid for housing units with no mortgage in 2022: $7,237 (1.0%)
Nearest city with pop. 50,000+: Annandale, VA
Nearest city with pop. 200,000+: Washington, DC
Nearest city with pop. 1,000,000+: Philadelphia, PA
Nearest cities:
Latitude: 38.88 N, Longitude: 77.29 W
Daytime population change due to commuting: -7,748 (-21.3%)Workers who live and work in this place: 7,318 (36.6%)
Property values in Oakton, VA
Unemployment in December 2023:
Most common occupations in Oakton, VA (%)
Both Males Females
Computer specialists (10.2%)
Other management occupations, except farmers and farm managers (7.7%)
Other office and administrative support workers, including supervisors (3.6%)
Other sales and related occupations, including supervisors (3.1%)
Top executives (3.1%)
Accountants and auditors (3.0%)
Operations specialties managers, except financial managers (2.8%)
Computer specialists (13.7%)
Other management occupations, except farmers and farm managers (8.2%)
Top executives (4.5%)
Engineers (3.6%)
Other sales and related occupations, including supervisors (3.1%)
Accountants and auditors (3.0%)
Operations specialties managers, except financial managers (3.0%)
Other management occupations, except farmers and farm managers (7.1%)
Computer specialists (6.0%)
Other office and administrative support workers, including supervisors (5.0%)
Secretaries and administrative assistants (4.6%)
Preschool, kindergarten, elementary, and middle school teachers (3.5%)
Other sales and related occupations, including supervisors (3.1%)
Accountants and auditors (3.0%)
Tornado activity:
Oakton-area historical tornado activity is above Virginia state average. It is 8% greater than the overall U.S. average.
On 4/28/2002, a category F4 (max. wind speeds 207-260 mph) tornado 23.8 miles away from the Oakton place center killed 3 people and injured 122 people and caused $124 million in damages.
On 4/1/1973, a category F3 (max. wind speeds 158-206 mph) tornado 6.1 miles away from the place center injured 37 people and caused between $5,000,000 and $50,000,000 in damages.
Earthquake activity:
Oakton-area historical earthquake activity is significantly above Virginia state average. It is 56% smaller than the overall U.S. average. On 8/23/2011 at 17:51:04, a magnitude 5.8 (5.8 MW, Depth: 3.7 mi, Class: Moderate, Intensity: VI - VII) earthquake occurred 75.9 miles away from Oakton center On 8/25/2011 at 05:07:52, a magnitude 4.5 (4.5 ML, Depth: 4.2 mi, Class: Light, Intensity: IV - V) earthquake occurred 74.4 miles away from Oakton center On 12/9/2003 at 20:59:18, a magnitude 4.5 (4.5 ML, Depth: 6.2 mi) earthquake occurred 88.4 miles away from the city center On 12/9/2003 at 20:59:14, a magnitude 4.5 (4.5 MB, 4.5 LG) earthquake occurred 95.6 miles away from Oakton center On 1/16/1994 at 01:49:16, a magnitude 4.6 (4.6 MB, 4.6 LG, Depth: 3.1 mi) earthquake occurred 120.3 miles away from Oakton center On 9/25/1998 at 19:52:52, a magnitude 5.2 (4.8 MB, 4.3 MS, 5.2 LG, 4.5 MW, Depth: 3.1 mi) earthquake occurred 243.8 miles away from the city center Magnitude types: regional Lg-wave magnitude (LG), body-wave magnitude (MB), local magnitude (ML), surface-wave magnitude (MS), moment magnitude (MW) Natural disasters: The number of natural disasters in Fairfax County (15) is near the US average (15).Major Disasters (Presidential) Declared: 12Emergencies Declared: 3Winter Storms: 5, Hurricanes: 4, Snowstorms: 3, Storms: 2, Tropical Storms: 2, Blizzard: 1, Flood: 1, Tornado: 1, Wind: 1, Other: 1 (Note: some incidents may be assigned to more than one category). Hospitals and medical centers near Oakton: FAIRFAX DIALYSIS CENTER (Dialysis Facility, about 2 miles away; FAIRFAX, VA)
TOTAL RENAL CARE - FAIRFAX (Dialysis Facility, about 2 miles away; FAIRFAX, VA)
HOSPICE OF NORTHERN VIRGINIA (Home Health Center, about 2 miles away; FAIRFAX, VA)
THE VIRGINIAN (Nursing Home, about 2 miles away; FAIRFAX, VA)
HOSPICE OF AMERICAN HEALTH CARE (Hospital, about 3 miles away; VIENNA, VA)
RENAL CAREPARTNERS - FAIRFAX (Dialysis Facility, about 3 miles away; FAIRFAX, VA)
ACCESSIBLE HOME HEALTHCARE OF NORTHERN VA (Home Health Center, about 3 miles away; FAIRFAX, VA)
Amtrak stations near Oakton: 10 miles: DULLES INTERNATIONAL AP'T (HERNDON, DULLES INTERNATIONAL AIRPORT) - Bus Station Services: enclosed waiting area, public restrooms, public payphones, full-service food facilities, paid short-term parking, paid long-term parking, car rental agency, taxi stand, public transit connection.
13 miles: LORTON (AUTO-TRAIN) (LORTON, 8006 LORTON RD.) Services: ticket office, fully wheelchair accessible, enclosed waiting area, public restrooms, public payphones, vending machines, free short-term parking, call for taxi service.
14 miles: ALEXANDRIA (110 CALLAHAN DR.) Services: ticket office, partially wheelchair accessible, enclosed waiting area, public restrooms, public payphones, vending machines, ATM, free short-term parking, free long-term parking, call for car rental service, call for taxi service, public transit connection.
Colleges/universities with over 2000 students nearest to Oakton:
Stratford University (about 2 miles; Fairfax, VA ; Full-time enrollment: 2,570)
George Mason University (about 4 miles; Fairfax, VA ; FT enrollment: 26,002)
Northern Virginia Community College (about 5 miles; Annandale, VA ; FT enrollment: 35,721)
Medtech Institute (about 7 miles; Falls Church, VA ; FT enrollment: 2,900)
Marymount University (about 9 miles; Arlington, VA ; FT enrollment: 3,361)
Strayer University-Virginia (about 12 miles; Arlington, VA ; FT enrollment: 7,005)
American University (about 12 miles; Washington, DC ; FT enrollment: 9,850)
Private high school in Oakton: DOMINION CHRISTIAN SCHOOL Students: 152, Location: 10922 VALE RD, Grades: KG-11)
Public elementary/middle schools in Oakton: WAPLES MILL ELEM Students: 825, Location: 11509 WAPLES MILL RD, Grades: PK-6)OAKTON ELEM Students: 613, Location: 3000 CHAIN BRIDGE RD, Grades: PK-6)Private elementary/middle schools in Oakton: PINNACLE ACADEMY Students: 153, Location: 2854 HUNTER MILL RD, Grades: PK-8)
MONTESSORI SCHOOL OF OAKTON Students: 94, Location: 12113 VALE RD, Grades: PK-6)
See full list of schools located in Oakton
Notable locations in Oakton: (A) , Vienna/Fairfax-GMU Metro Station (B) , Flint Hill Business Park (C) , Hunters Branch Business Center (D) , Oak Marr Golf Course (E) , Fairfax County Fire and Rescue Department Station 34 Oakton (F) . Display/hide their locations on the map
Shopping Centers: (1) , Oakton Shopping Center (2) , Twin Oakes Plaza Shopping Center (3) . Display/hide their locations on the map
Churches in Oakton include: (A) , Church of the Good Shepherd (B) , Emmanuel Lutheran Church (C) , Northern Virginia Primitive Baptist Church (D) , Fairfax Unitarian Church (E) , The Church of Jesus Christ of Latter Day Saints (F) , Oakton Church of Brethren (G) , Baptist Fellowship Church (H) , Oakton Methodist Church (I) . Display/hide their locations on the map
Cemetery: (1) . Display/hide its location on the map
Streams, rivers, and creeks: (A) , Little Difficult Run (B) . Display/hide their locations on the map
Parks in Oakton include: (1) , Kemper Park (2) , Ashlawn Park (3) , Blake Lane Park (4) , Oak Marr Park (5) , Tattersall Park (6) , Villa D'Este Park (7) . Display/hide their locations on the map
Tourist attraction:
Birthplace of: John R. Allen - Marine Corps general, Nate Bauers - Lacrosse player.
Fairfax County has a predicted average indoor radon screening level greater than 4 pCi/L (pico curies per liter) - Highest Potential Average household size: This place:
2.6 peopleVirginia:
2.5 people
Percentage of family households: This place:
67.7%Whole state:
67.0%
Percentage of households with unmarried partners: This place:
4.4%Whole state:
5.7%
Likely homosexual households (counted as self-reported same-sex unmarried-partner households)
Lesbian couples: 0.2% of all households Gay men: 0.4% of all households
12 people in group homes intended for adults in 2010people in nursing homes in 2000people in other nonhousehold living situations in 2000
Banks with branches in Oakton (2011 data):
PNC Bank, National Association: Oakton @ Giant Branch at 2932 Chain Bridge Road, branch established on 2010/07/14; Oakton Branch at 2964 Chain Bridge Road, branch established on 2008/02/25. Info updated 2012/03/20: Bank assets: $263,309.6 mil, Deposits: $197,343.0 mil, headquarters in Wilmington, DE, positive income , Commercial Lending Specialization, 3085 total offices , Holding Company: Pnc Financial Services Group, Inc., The
Wells Fargo Bank, National Association: Hunter Mill at 2946 Chain Bridge Road A, branch established on 1986/02/21. Info updated 2011/04/05: Bank assets: $1,161,490.0 mil, Deposits: $905,653.0 mil, headquarters in Sioux Falls, SD, positive income , 6395 total offices , Holding Company: Wells Fargo & Company
Branch Banking and Trust Company: Oakton Branch at 2941 Chain Bridge Road, branch established on 1971/04/09. Info updated 2010/03/29: Bank assets: $168,867.6 mil, Deposits: $127,549.5 mil, headquarters in Winston Salem, NC, positive income , Commercial Lending Specialization, 1793 total offices , Holding Company: Bb&T Corporation
Capital One, National Association: Oakton Supermarket Branch - Giant at 2932 Chain Bridge Road, branch established on 1989/06/30. Info updated 2011/07/01: Bank assets: $133,477.8 mil, Deposits: $97,063.7 mil, headquarters in Mclean, VA, positive income , 984 total offices , Holding Company: Capital One Financial Corporation
Bank of America, National Association: Oakton Branch at 2936 Chain Bridge Road, branch established on 1972/10/02. Info updated 2009/11/18: Bank assets: $1,451,969.3 mil, Deposits: $1,077,176.8 mil, headquarters in Charlotte, NC, positive income , 5782 total offices , Holding Company: Bank Of America Corporation
For population 15 years and over in Oakton:
Never married: 32.7%Now married: 55.0%Separated: 1.1%Widowed: 4.0%Divorced: 7.1% For population 25 years and over in Oakton:
High school or higher: 96.9%Bachelor's degree or higher: 72.8%Graduate or professional degree: 38.5%Unemployed: 3.1%Mean travel time to work (commute): 20.2 minutes
Education Gini index (Inequality in education) Here:
10.0Virginia average:
12.1
Religion statistics for Oakton, VA (based on Fairfax County data)
Religion Adherents Congregations Catholic 184,183 29 Evangelical Protestant 103,522 316 Mainline Protestant 100,525 146 Other 91,925 119 Orthodox 4,694 8 Black Protestant 1,509 9 None 595,368 -
Source: Clifford Grammich, Kirk Hadaway, Richard Houseal, Dale E.Jones, Alexei Krindatch, Richie Stanley and Richard H.Taylor. 2012. 2010 U.S.Religion Census: Religious Congregations & Membership Study. Association of Statisticians of American Religious Bodies. Jones, Dale E., et al. 2002. Congregations and Membership in the United States 2000. Nashville, TN: Glenmary Research Center. Graphs represent county-level data
Food Environment Statistics: Number of grocery stores : 182Fairfax County :
1.81 / 10,000 pop.State :
2.03 / 10,000 pop.
Number of supercenters and club stores : 3Fairfax County :
0.03 / 10,000 pop.Virginia :
0.17 / 10,000 pop.
Number of convenience stores (no gas) : 130Fairfax County :
1.29 / 10,000 pop.Virginia :
1.43 / 10,000 pop.
Number of convenience stores (with gas) : 163This county :
1.62 / 10,000 pop.Virginia :
4.03 / 10,000 pop.
Number of full-service restaurants : 693Fairfax County :
6.90 / 10,000 pop.Virginia :
7.65 / 10,000 pop.
Adult diabetes rate : This county :
7.2%Virginia :
9.3%
Adult obesity rate : This county :
22.2%Virginia :
26.7%
Low-income preschool obesity rate : Health and Nutrition: Healthy diet rate : Oakton:
53.8%Virginia:
50.6%
Average overall health of teeth and gums : Oakton:
53.2%Virginia:
48.6%
People feeling badly about themselves : Oakton:
18.7%Virginia:
20.2%
People not drinking alcohol at all : Oakton:
10.0%Virginia:
10.5%
Average hours sleeping at night : General health condition : Average condition of hearing : Oakton:
82.2%Virginia:
80.5%
More about Health and Nutrition of Oakton, VA Residents
8.87% of this county's 2021 resident taxpayers lived in other counties in 2020 ($108,323 average adjusted gross income )
Here:
8.87%Virginia average:
10.16%
0.19% of residents moved from foreign countries ($2,634 average AGI )Fairfax County:
0.19%Virginia average:
0.12%
Top counties from which taxpayers relocated into this county between 2020 and 2021:
10.12% of this county's 2020 resident taxpayers moved to other counties in 2021 ($118,643 average adjusted gross income )
Here:
10.12%Virginia average:
10.20%
0.16% of residents moved to foreign countries ($2,238 average AGI )Fairfax County:
0.16%Virginia average:
0.09%
Top counties to which taxpayers relocated from this county between 2020 and 2021:
Businesses in Oakton, VA
Name Count Name Count
7-Eleven 1 Giant 1 CVS 1 McDonald's 1 Cinnabon 1 Starbucks 1 Domino's Pizza 1 Subway 1 FedEx 3 UPS 3
Strongest AM radio stations in Oakton:
WDCT (1310 AM; 5 kW; FAIRFAX, VA; Owner: FAMILY RADIO, LTD.)
WUST (1120 AM; daytime; 20 kW; WASHINGTON, DC)
WTEM (980 AM; 50 kW; WASHINGTON, DC; Owner: AMFM RADIO LICENSES, L.L.C.)
WTOP (1500 AM; 50 kW; WASHINGTON, DC; Owner: BONNEVILLE HOLDING COMPANY)
WFAX (1220 AM; 5 kW; FALLS CHURCH, VA; Owner: NEWCOMB BROADCASTING CORP.)
WMET (1150 AM; 50 kW; GAITHERSBURG, MD; Owner: BELTWAY ACQUISITION CORPORATION)
WABS (780 AM; daytime; 5 kW; ARLINGTON, VA; Owner: SALEM MEDIA OF VIRGINIA, INC.)
WZHF (1390 AM; 5 kW; ARLINGTON, VA; Owner: WAY BROADCASTING, INC.)
WPGC (1580 AM; 50 kW; MORNINGSIDE, MD; Owner: INFINITY WPGC(AM), INC.)
WKDL (730 AM; 8 kW; ALEXANDRIA, VA; Owner: MEGA COMMUNICATIONS OF ALEXANDRIA LICENSEE, LLC)
WTNT (570 AM; 5 kW; BETHESDA, MD; Owner: AMFM RADIO LICENSES, L.L.C.)
WKCW (1420 AM; 50 kW; WARRENTON, VA; Owner: WAY BROADCASTING, INC.)
WMAL (630 AM; 5 kW; WASHINGTON, DC; Owner: WMAL, INC.)
Strongest FM radio stations in Oakton:
WJFK-FM (106.7 FM; MANASSAS, VA; Owner: INFINITY BROADCASTING CORP. OF WASHINGTON, DC)
WJZW (105.9 FM; WOODBRIDGE, VA; Owner: WMAL, INC.)
WMZQ-FM (98.7 FM; WASHINGTON, DC; Owner: AMFM RADIO LICENSES, L.L.C.)
WGTS (91.9 FM; TAKOMA PARK, MD; Owner: COLUMBIA UNION COLLEGE BROADCASTING, INC.)
WETA (90.9 FM; WASHINGTON, DC; Owner: GREATER WASHINGTON EDUCATIONAL TELECOMMUNICATIONS ASSN.)
WAVA (105.1 FM; ARLINGTON, VA; Owner: SALEM MEDIA OF VIRGINIA, INC.)
WARW (94.7 FM; BETHESDA, MD; Owner: INFINITY BROADCASTING OPERATIONS, INC.)
WIHT (99.5 FM; WASHINGTON, DC; Owner: AMFM RADIO LICENSES, L.L.C.)
WRQX (107.3 FM; WASHINGTON, DC; Owner: WMAL, INC.)
WHUR-FM (96.3 FM; WASHINGTON, DC; Owner: THE HOWARD UNIVERSITY)
WASH (97.1 FM; WASHINGTON, DC; Owner: AMFM RADIO LICENSES, L.L.C.)
WKYS (93.9 FM; WASHINGTON, DC; Owner: RADIO ONE LICENSES, LLC)
WWDC-FM (101.1 FM; WASHINGTON, DC; Owner: AMFM RADIO LICENSES, L.L.C.)
WGMS-FM (103.5 FM; WASHINGTON, DC; Owner: BONNEVILLE HOLDING COMPANY)
WAMU (88.5 FM; WASHINGTON, DC; Owner: THE EXEC. COMM. OF THE BD. OF TRUSTEES OF AMERICAN UNIV.)
WMMJ (102.3 FM; BETHESDA, MD; Owner: RADIO ONE LICENSES, LLC)
WPFW (89.3 FM; WASHINGTON, DC; Owner: PACIFICA FOUNDATION, INC.)
WCSP-FM (90.1 FM; WASHINGTON, DC; Owner: NATIONAL CABLE SATELLITE CORPORATION)
WBIG-FM (100.3 FM; WASHINGTON, DC; Owner: AMFM RADIO LICENSES, L.L.C.)
W228BA (93.5 FM; LEESBURG, VA; Owner: CSN INTERNATIONAL)
TV broadcast stations around Oakton:
WNVC (Channel 56; FAIRFAX, VA; Owner: COMMONWEALTH PUBLIC BROADCASTING CORPORATION)
W42BE (Channel 42; FAIRFAX, VA; Owner: FAIRFAX LOW POWER CO.)
WPXW (Channel 66; MANASSAS, VA; Owner: PAXSON WASHINGTON LICENSE, INC.)
WJLA-TV (Channel 7; WASHINGTON, DC; Owner: ACC LICENSEE, INC.)
WUSA (Channel 9; WASHINGTON, DC; Owner: THE DETROIT NEWS, INC.)
WTTG (Channel 5; WASHINGTON, DC; Owner: FOX TELEVISION STATIONS, INC.)
WETA-TV (Channel 26; WASHINGTON, DC; Owner: THE GREATER WASHINGTON ED TELECOMM. ASSOC)
WDCA (Channel 20; WASHINGTON, DC; Owner: FOX TELEVISION STATIONS, INC.)
WHUT-TV (Channel 32; WASHINGTON, DC; Owner: HOWARD UNIVERSITY)
WRC-TV (Channel 4; WASHINGTON, DC; Owner: NBC SUBSIDIARY (WRC-TV), INC.)
WBDC-TV (Channel 50; WASHINGTON, DC; Owner: WBDC BROADCASTING, INC.)
W28BY (Channel 63; BALTIMORE, MD; Owner: INFORMATION SUPER STATION, L.L.C.)
WMDO-CA (Channel 30; WASHINGTON, DC; Owner: ENTRAVISION HOLDINGS, LLC)
WNVT (Channel 53; GOLDVEIN, VA; Owner: COMMONWEALTH PUBLIC BROADCASTING CORPORATION)
WZDC-LP (Channel 64; WASHINGTON, DC; Owner: ONDA CAPITAL, INC.)
WIAV-LP (Channel 58; WASHINGTON, DC; Owner: ASIAVISION, INC.)
WKRP-LP (Channel 42; WASHINGTON, DC; Owner: CAPITAL MEDIA, LLC)
WBFF (Channel 45; BALTIMORE, MD; Owner: CHESAPEAKE TELEVISION LICENSEE, LLC)
WNUV (Channel 54; BALTIMORE, MD; Owner: BALTIMORE (WNUV-TV) LICENSEE, INC.)
WMPT (Channel 22; ANNAPOLIS, MD; Owner: MARYLAND PUBLIC BROADCASTING COMMISSION)
WUTB (Channel 24; BALTIMORE, MD; Owner: FOX TELEVISION STATIONS, INC.)
WFPT (Channel 62; FREDERICK, MD; Owner: MARYLAND PUBLIC BROADCASTING COMMISSION)
National Bridge Inventory (NBI) Statistics 22 Number of bridges190ft / 57.9m Total length $1,093,000 Total costs634,087 Total average daily traffic4,979 Total average daily truck traffic
New bridges - historical statistics
2 1970-1979 9 1980-1989 3 1990-1999 8 2020-2022
See full National Bridge Inventory statistics for Oakton, VA
FCC Registered Antenna Towers: 2
COLLEEN KHAN, 2900 Sutton Road (Lat: 38.880361 Lon: -77.282694), Type: 38.1, Structure height: 51059 m, Overall height: 38.1 m, Registrant: Entrex, Ckhan@entrex.Com, , Bethe-sda, Phone: (202) 725-1286 COLLEEN KHAN, 2900 Sutton Road (Lat: 38.880361 Lon: -77.282694), Type: 38.1, Structure height: 51059 m, Overall height: 38.1 m, Registrant: Entrex, Ckhan@entrex.Com, , Bethe-sda, Phone: (202) 725-1286 FCC Registered Private Land Mobile Towers: 3
I-66 Outside The Beltway (Lat: 38.867806 Lon: -77.310028), Type: Pole, Structure height: 4.5 m, Call Sign: WROC786, Assigned Frequencies: 915.750 MHz, Grant Date: 09/27/2021, Expiration Date: 09/27/2031, Certifier: Dustin Alwood, Registrant: Express Mobility Partners, 7450 Century Park Drive, Manassas, VA 20109, Phone: (703) 349-7446, Email:
I-66 Outside The Beltway (Lat: 38.879417 Lon: -77.266083), Type: Pole, Structure height: 4.5 m, Call Sign: WROC788, Assigned Frequencies: 915.750 MHz, Grant Date: 09/27/2021, Expiration Date: 09/27/2031, Certifier: Dustin Alwood, Registrant: Express Mobility Partners, 7450 Century Park Drive, Manassas, VA 20109, Phone: (703) 349-7446, Email:
I-66 Outside The Beltway (Lat: 38.876861 Lon: -77.277833), Type: Pole, Structure height: 4.5 m, Call Sign: WROC789, Assigned Frequencies: 915.750 MHz, Grant Date: 09/27/2021, Expiration Date: 09/27/2031, Certifier: Dustin Alwood, Registrant: Express Mobility Partners, 7450 Century Park Drive, Manassas, VA 20109, Phone: (703) 349-7446, Email:
FCC Registered Broadcast Land Mobile Towers: 4
3033 Chain Bridge Rd (Lat: 38.875944 Lon: -77.305250), Call Sign: KNFZ949, Assigned Frequencies: 464.425 MHz, Grant Date: 04/14/2005, Expiration Date: 06/20/2015, Cancellation Date: 10/29/2012, Registrant: At&t Corp., 2315 Salem Road, First Floor, H9, Conyers, GA 30013, Phone: (770) 602-2065, Fax: (770) 785-3007, Email:
Lat: 38.877667 Lon: -77.308472, Call Sign: WPYJ960, Assigned Frequencies: 461.075 MHz, 466.075 MHz, Grant Date: 08/25/2003, Expiration Date: 08/25/2013, Cancellation Date: 11/09/2013, Certifier: Carole Ingraham, Registrant: Metro 2 Way, Brookeville, MD 20833, Phone: (202) 882-4420, Fax: (202) 722-46062912 Chainbridge Rd (Lat: 38.881667 Lon: -77.299444), Call Sign: WQBZ409, Assigned Frequencies: 30.8400 MHz, 154.540 MHz, 33.4000 MHz, 33.1600 MHz, 31.2400 MHz, 468.837 MHz, 469.637 MHz, 469.662 MHz, 457.512 MHz, 457.537 MHz... (+16 more), Grant Date: 01/11/2005, Expiration Date: 01/11/2015, Cancellation Date: 03/14/2015, Certifier: Beth Cotner, Registrant: Dolfen Consulting Group, 95 Willow Lane, Bristol, IL 60512-9711, Phone: (630) 553-5886, Fax: (630) 566-1755, Email:
Lat: 38.905056 Lon: -77.325361, Call Sign: WQYN254, Assigned Frequencies: 452.137 MHz, 457.137 MHz, Grant Date: 11/15/2016, Expiration Date: 11/15/2026, Certifier: Daniel Padilla, Registrant: Fit, 1565 Oak St, Eugene, OR 97401, Phone: (541) 485-8441, Fax: (541) 485-7556, Email:
FCC Registered Microwave Towers: 5
3033 CHAIN BRIDGE RD, 3033 Chain Bridge Road (Lat: 38.875139 Lon: -77.304361), Type: Pole, Structure height: 16.8 m, Overall height: 19.8 m, Call Sign: WPVW341, Assigned Frequencies: 21275.0 MHz, 21525.0 MHz, Grant Date: 08/27/2002, Expiration Date: 02/01/2012, Cancellation Date: 09/01/2010, Certifier: Robert Jackson, Registrant: At&t Corp., 2315 Salem Road, First Floor, H9, Conyers, GA 30043, Phone: (770) 602-2065, Fax: (770) 929-4454, Email:
WDC0330, 10922 Vale Rd. (Lat: 38.905972 Lon: -77.324111), Type: Pole, Structure height: 44.2 m, Call Sign: WQIL422, Assigned Frequencies: 11285.0 MHz, Grant Date: 03/10/2008, Expiration Date: 03/10/2018, Cancellation Date: 09/09/2009, Certifier: Joseph M Sandri Jr., Registrant: Fibertower Corporation, 1667 K Street Nw, Suite 250, Washington, DC 20006, Phone: (202) 223-1028, Fax: (202) 315-3415, Email:
DC-WSH5721A, 10922 Vale Road (Lat: 38.906000 Lon: -77.324111), Type: Pole, Structure height: 44.2 m, Overall height: 45 m, Call Sign: WQLP925, Assigned Frequencies: 10775.0 MHz, Grant Date: 03/25/2010, Expiration Date: 03/25/2020, Cancellation Date: 01/02/2020, Certifier: Nadja S Sodos-Wallace, Registrant: Sprint Corporation, 12502 Sunrise Valley Drive, M/S: Varesa0209, Reston, VA 20196, Phone: (800) 572-8256, Fax: (703) 433-4483, Email:
DC03XC211, 3211 Jermantown Road (Lat: 38.873583 Lon: -77.312861), Type: Bant, Structure height: 35.9 m, Overall height: 39.3 m, Call Sign: WQPV256, Assigned Frequencies: 10975.0 MHz, 11135.0 MHz, 10975.0 MHz, 11135.0 MHz, 10975.0 MHz, 11135.0 MHz, Grant Date: 08/22/2012, Expiration Date: 08/22/2022, Cancellation Date: 04/06/2022, Certifier: David Werblow, Registrant: Dla Piper LLP, 500 8th Street, Nw, Washington, DC 20004, Phone: (202) 799-4216, Fax: (202) 799-5616, Email:
DC03XC451, 9302 Lee Highway (Lat: 38.873028 Lon: -77.265333), Type: Bant, Structure height: 54.6 m, Overall height: 57.6 m, Call Sign: WQPV369, Assigned Frequencies: 22025.0 MHz, 22025.0 MHz, 22025.0 MHz, 22025.0 MHz, Grant Date: 08/23/2012, Expiration Date: 08/23/2022, Cancellation Date: 04/06/2022, Certifier: David Werblow, Registrant: Dla Piper LLP, 500 8th Street, Nw, Washington, DC 20004, Phone: (202) 799-4216, Fax: (202) 799-5616, Email:
FCC Registered Amateur Radio Licenses: 122 (
See the full list of FCC Registered Amateur Radio Licenses in Oakton )
FAA Registered Aircraft: 14 (
See the full list of FAA Registered Aircraft in Oakton )
Home Mortgage Disclosure Act Aggregated Statistics For Year 2009(Based on 5 full and 2 partial tracts) A) FHA, FSA/RHS & VA B) Conventional C) Refinancings D) Home Improvement Loans E) Loans on Dwellings For 5+ Families F) Non-occupant Loans on G) Loans On Manufactured Number Average Value Number Average Value Number Average Value Number Average Value Number Average Value Number Average Value Number Average Value
LOANS ORIGINATED 195 $365,496 405 $372,727 1,432 $347,721 47 $221,068 0 $0 66 $260,050 0 $0 APPLICATIONS APPROVED, NOT ACCEPTED 8 $391,722 27 $423,365 73 $369,746 6 $91,975 0 $0 3 $211,980 0 $0 APPLICATIONS DENIED 21 $371,349 32 $339,540 285 $340,620 6 $111,813 0 $0 26 $264,009 3 $55,000 APPLICATIONS WITHDRAWN 17 $355,049 41 $367,408 280 $363,242 7 $154,014 1 $10,700,000 20 $227,420 0 $0 FILES CLOSED FOR INCOMPLETENESS 1 $127,170 12 $269,382 75 $359,575 4 $154,155 0 $0 5 $217,590 0 $0
Aggregated Statistics For Year 2008(Based on 5 full and 2 partial tracts) A) FHA, FSA/RHS & VA B) Conventional C) Refinancings D) Home Improvement Loans F) Non-occupant Loans on Number Average Value Number Average Value Number Average Value Number Average Value Number Average Value
LOANS ORIGINATED 113 $334,906 484 $369,219 470 $328,767 55 $101,900 81 $267,426 APPLICATIONS APPROVED, NOT ACCEPTED 6 $328,143 46 $347,607 84 $328,441 6 $162,862 12 $247,290 APPLICATIONS DENIED 17 $359,866 40 $347,268 183 $379,040 29 $201,163 25 $282,341 APPLICATIONS WITHDRAWN 12 $357,789 55 $355,570 130 $378,640 14 $65,726 13 $294,244 FILES CLOSED FOR INCOMPLETENESS 2 $506,000 11 $379,658 29 $420,336 4 $88,595 1 $316,010
Aggregated Statistics For Year 2007(Based on 5 full and 2 partial tracts) A) FHA, FSA/RHS & VA B) Conventional C) Refinancings D) Home Improvement Loans E) Loans on Dwellings For 5+ Families F) Non-occupant Loans on Number Average Value Number Average Value Number Average Value Number Average Value Number Average Value Number Average Value
LOANS ORIGINATED 7 $290,853 895 $303,240 533 $322,579 62 $151,563 1 $638,000 109 $251,831 APPLICATIONS APPROVED, NOT ACCEPTED 0 $0 92 $264,772 132 $357,309 19 $94,579 0 $0 29 $322,446 APPLICATIONS DENIED 3 $266,163 69 $342,018 205 $359,241 36 $165,536 0 $0 34 $291,715 APPLICATIONS WITHDRAWN 2 $296,205 90 $369,699 161 $330,729 10 $120,605 1 $249,840 25 $257,029 FILES CLOSED FOR INCOMPLETENESS 0 $0 10 $289,893 44 $436,750 1 $50,000 0 $0 8 $325,234
Aggregated Statistics For Year 2006(Based on 5 full and 2 partial tracts) A) FHA, FSA/RHS & VA B) Conventional C) Refinancings D) Home Improvement Loans F) Non-occupant Loans on G) Loans On Manufactured Number Average Value Number Average Value Number Average Value Number Average Value Number Average Value Number Average Value
LOANS ORIGINATED 4 $314,285 1,350 $279,984 678 $309,309 105 $145,121 167 $268,509 0 $0 APPLICATIONS APPROVED, NOT ACCEPTED 0 $0 129 $319,203 119 $294,609 24 $123,994 28 $352,532 1 $136,710 APPLICATIONS DENIED 0 $0 184 $252,114 211 $359,700 48 $121,294 42 $313,058 3 $117,613 APPLICATIONS WITHDRAWN 0 $0 117 $263,157 192 $324,342 9 $222,671 28 $261,866 1 $136,710 FILES CLOSED FOR INCOMPLETENESS 0 $0 19 $315,757 35 $373,002 5 $154,966 3 $262,863 0 $0
Aggregated Statistics For Year 2005(Based on 5 full and 2 partial tracts) A) FHA, FSA/RHS & VA B) Conventional C) Refinancings D) Home Improvement Loans E) Loans on Dwellings For 5+ Families F) Non-occupant Loans on G) Loans On Manufactured Number Average Value Number Average Value Number Average Value Number Average Value Number Average Value Number Average Value Number Average Value
LOANS ORIGINATED 4 $252,000 1,307 $330,789 1,028 $325,913 92 $168,008 0 $0 222 $287,372 1 $7,950 APPLICATIONS APPROVED, NOT ACCEPTED 0 $0 110 $358,447 143 $288,866 25 $133,680 0 $0 22 $292,823 0 $0 APPLICATIONS DENIED 0 $0 162 $319,861 178 $338,292 32 $186,356 0 $0 46 $318,214 1 $36,000 APPLICATIONS WITHDRAWN 0 $0 101 $304,289 136 $345,007 30 $128,583 1 $389,450 19 $283,068 0 $0 FILES CLOSED FOR INCOMPLETENESS 0 $0 24 $321,712 50 $308,416 11 $194,058 0 $0 4 $423,770 0 $0
Aggregated Statistics For Year 2004(Based on 5 full and 2 partial tracts) A) FHA, FSA/RHS & VA B) Conventional C) Refinancings D) Home Improvement Loans E) Loans on Dwellings For 5+ Families F) Non-occupant Loans on G) Loans On Manufactured Number Average Value Number Average Value Number Average Value Number Average Value Number Average Value Number Average Value Number Average Value
LOANS ORIGINATED 17 $219,995 1,375 $291,557 1,267 $269,916 78 $150,949 0 $0 232 $241,581 2 $56,000 APPLICATIONS APPROVED, NOT ACCEPTED 1 $290,000 93 $367,735 130 $223,178 6 $176,145 2 $84,000 31 $239,826 2 $124,000 APPLICATIONS DENIED 1 $290,000 112 $332,999 201 $260,256 36 $91,174 0 $0 57 $274,001 0 $0 APPLICATIONS WITHDRAWN 2 $185,010 94 $307,211 180 $252,570 29 $72,499 0 $0 20 $308,559 0 $0 FILES CLOSED FOR INCOMPLETENESS 0 $0 18 $237,938 45 $271,094 6 $88,570 0 $0 6 $206,333 0 $0
Aggregated Statistics For Year 2003(Based on 5 full and 2 partial tracts) A) FHA, FSA/RHS & VA B) Conventional C) Refinancings D) Home Improvement Loans F) Non-occupant Loans on Number Average Value Number Average Value Number Average Value Number Average Value Number Average Value
LOANS ORIGINATED 34 $188,584 1,183 $259,178 3,630 $232,343 38 $92,699 237 $173,561 APPLICATIONS APPROVED, NOT ACCEPTED 2 $148,405 105 $209,435 328 $223,041 19 $60,435 23 $198,347 APPLICATIONS DENIED 1 $122,400 71 $218,215 255 $252,020 16 $57,956 19 $180,480 APPLICATIONS WITHDRAWN 3 $172,000 86 $253,399 292 $228,420 5 $67,894 15 $180,007 FILES CLOSED FOR INCOMPLETENESS 0 $0 15 $299,572 87 $282,690 2 $84,375 8 $205,375
Aggregated Statistics For Year 2002(Based on 3 full and 1 partial tracts) A) FHA, FSA/RHS & VA B) Conventional C) Refinancings D) Home Improvement Loans F) Non-occupant Loans on Number Average Value Number Average Value Number Average Value Number Average Value Number Average Value
LOANS ORIGINATED 35 $170,182 628 $222,917 1,633 $226,573 47 $60,822 78 $156,379 APPLICATIONS APPROVED, NOT ACCEPTED 0 $0 34 $218,059 117 $194,225 14 $36,466 6 $150,260 APPLICATIONS DENIED 3 $225,040 24 $198,845 130 $225,897 16 $28,402 7 $198,424 APPLICATIONS WITHDRAWN 2 $160,500 42 $256,101 153 $198,155 3 $29,180 11 $161,395 FILES CLOSED FOR INCOMPLETENESS 1 $105,000 5 $359,974 34 $187,270 0 $0 5 $117,200
Aggregated Statistics For Year 2001(Based on 3 full and 1 partial tracts) A) FHA, FSA/RHS & VA B) Conventional C) Refinancings D) Home Improvement Loans F) Non-occupant Loans on Number Average Value Number Average Value Number Average Value Number Average Value Number Average Value
LOANS ORIGINATED 77 $152,722 589 $188,423 1,066 $211,536 47 $42,487 45 $151,500 APPLICATIONS APPROVED, NOT ACCEPTED 3 $141,333 33 $123,687 82 $165,254 8 $61,575 4 $78,160 APPLICATIONS DENIED 3 $128,863 18 $163,326 107 $156,342 25 $43,974 11 $168,979 APPLICATIONS WITHDRAWN 1 $194,120 38 $220,324 100 $191,607 13 $32,638 9 $147,483 FILES CLOSED FOR INCOMPLETENESS 0 $0 4 $325,598 32 $181,518 0 $0 3 $127,000
Aggregated Statistics For Year 2000(Based on 3 full and 1 partial tracts) A) FHA, FSA/RHS & VA B) Conventional C) Refinancings D) Home Improvement Loans F) Non-occupant Loans on Number Average Value Number Average Value Number Average Value Number Average Value Number Average Value
LOANS ORIGINATED 91 $137,823 571 $192,074 168 $159,271 51 $34,747 29 $130,973 APPLICATIONS APPROVED, NOT ACCEPTED 1 $145,030 45 $150,780 30 $158,418 7 $54,190 2 $99,365 APPLICATIONS DENIED 3 $99,403 34 $186,947 72 $143,405 22 $36,049 4 $170,000 APPLICATIONS WITHDRAWN 10 $132,851 50 $207,130 36 $140,822 11 $103,818 5 $99,732 FILES CLOSED FOR INCOMPLETENESS 0 $0 12 $182,738 7 $135,537 2 $121,870 1 $391,000
Aggregated Statistics For Year 1999(Based on 4 full and 3 partial tracts) A) FHA, FSA/RHS & VA B) Conventional C) Refinancings D) Home Improvement Loans F) Non-occupant Loans on Number Average Value Number Average Value Number Average Value Number Average Value Number Average Value
LOANS ORIGINATED 92 $142,491 835 $198,119 513 $182,736 54 $41,294 49 $119,126 APPLICATIONS APPROVED, NOT ACCEPTED 5 $151,782 44 $146,652 61 $137,887 14 $32,259 5 $107,596 APPLICATIONS DENIED 2 $131,035 66 $170,657 100 $140,164 24 $61,525 9 $153,444 APPLICATIONS WITHDRAWN 14 $161,645 90 $219,837 76 $154,228 14 $155,086 9 $204,416 FILES CLOSED FOR INCOMPLETENESS 0 $0 8 $184,260 17 $190,715 1 $49,910 2 $49,815
Detailed HMDA statistics for the following Tracts:
4611.00
, 4612.00 , 4615.00 , 4616.00 , 4618.00 , 4619.00
Private Mortgage Insurance Companies Aggregated Statistics For Year 2009(Based on 5 full and 2 partial tracts) A) Conventional B) Refinancings Number Average Value Number Average Value
LOANS ORIGINATED 49 $353,558 24 $384,072 APPLICATIONS APPROVED, NOT ACCEPTED 17 $337,900 10 $363,155 APPLICATIONS DENIED 4 $323,185 3 $336,007 APPLICATIONS WITHDRAWN 4 $243,055 0 $0 FILES CLOSED FOR INCOMPLETENESS 1 $259,100 1 $184,390
Aggregated Statistics For Year 2008(Based on 5 full and 2 partial tracts) A) Conventional B) Refinancings C) Non-occupant Loans on Number Average Value Number Average Value Number Average Value
LOANS ORIGINATED 76 $325,831 16 $400,202 2 $317,745 APPLICATIONS APPROVED, NOT ACCEPTED 21 $318,341 10 $385,962 2 $261,500 APPLICATIONS DENIED 4 $391,348 3 $305,667 0 $0 APPLICATIONS WITHDRAWN 2 $274,040 0 $0 1 $197,110 FILES CLOSED FOR INCOMPLETENESS 0 $0 1 $389,000 0 $0
Aggregated Statistics For Year 2007(Based on 5 full and 2 partial tracts) A) Conventional B) Refinancings C) Non-occupant Loans on Number Average Value Number Average Value Number Average Value
LOANS ORIGINATED 77 $314,159 10 $334,451 2 $308,120 APPLICATIONS APPROVED, NOT ACCEPTED 6 $388,092 2 $413,295 0 $0 APPLICATIONS DENIED 1 $431,220 0 $0 1 $431,220 APPLICATIONS WITHDRAWN 6 $296,890 2 $444,980 1 $192,340 FILES CLOSED FOR INCOMPLETENESS 0 $0 1 $302,000 0 $0
Aggregated Statistics For Year 2006(Based on 5 full and 2 partial tracts) A) Conventional B) Refinancings C) Non-occupant Loans on Number Average Value Number Average Value Number Average Value
LOANS ORIGINATED 47 $349,448 6 $382,447 1 $361,780 APPLICATIONS APPROVED, NOT ACCEPTED 8 $309,229 4 $285,140 0 $0 APPLICATIONS DENIED 1 $289,310 9 $442,000 1 $442,000 APPLICATIONS WITHDRAWN 2 $390,440 1 $563,680 0 $0 FILES CLOSED FOR INCOMPLETENESS 0 $0 0 $0 0 $0
Aggregated Statistics For Year 2005(Based on 5 full and 2 partial tracts) A) Conventional B) Refinancings C) Non-occupant Loans on Number Average Value Number Average Value Number Average Value
LOANS ORIGINATED 51 $309,532 14 $328,138 8 $373,884 APPLICATIONS APPROVED, NOT ACCEPTED 13 $315,819 3 $335,667 2 $273,285 APPLICATIONS DENIED 0 $0 1 $334,000 0 $0 APPLICATIONS WITHDRAWN 2 $265,370 1 $431,580 0 $0 FILES CLOSED FOR INCOMPLETENESS 0 $0 0 $0 0 $0
Aggregated Statistics For Year 2004(Based on 5 full and 2 partial tracts) A) Conventional B) Refinancings C) Non-occupant Loans on Number Average Value Number Average Value Number Average Value
LOANS ORIGINATED 70 $282,517 19 $223,391 9 $281,099 APPLICATIONS APPROVED, NOT ACCEPTED 8 $274,139 10 $252,805 0 $0 APPLICATIONS DENIED 0 $0 0 $0 0 $0 APPLICATIONS WITHDRAWN 4 $256,483 3 $203,153 2 $198,805 FILES CLOSED FOR INCOMPLETENESS 0 $0 0 $0 0 $0
Aggregated Statistics For Year 2003(Based on 5 full and 2 partial tracts) A) Conventional B) Refinancings C) Non-occupant Loans on Number Average Value Number Average Value Number Average Value
LOANS ORIGINATED 105 $237,359 69 $205,146 18 $179,647 APPLICATIONS APPROVED, NOT ACCEPTED 16 $210,541 15 $251,047 0 $0 APPLICATIONS DENIED 1 $448,830 0 $0 0 $0 APPLICATIONS WITHDRAWN 5 $231,202 6 $207,953 2 $141,890 FILES CLOSED FOR INCOMPLETENESS 1 $172,470 1 $272,000 0 $0
Aggregated Statistics For Year 2002(Based on 3 full and 1 partial tracts) A) Conventional B) Refinancings C) Non-occupant Loans on Number Average Value Number Average Value Number Average Value
LOANS ORIGINATED 48 $215,569 15 $229,703 4 $139,105 APPLICATIONS APPROVED, NOT ACCEPTED 4 $228,868 7 $208,110 0 $0 APPLICATIONS DENIED 1 $473,000 1 $299,810 0 $0 APPLICATIONS WITHDRAWN 3 $160,487 3 $314,000 1 $93,000 FILES CLOSED FOR INCOMPLETENESS 0 $0 1 $316,640 1 $280,000
Aggregated Statistics For Year 2001(Based on 3 full and 1 partial tracts) A) Conventional B) Refinancings C) Non-occupant Loans on Number Average Value Number Average Value Number Average Value
LOANS ORIGINATED 55 $210,664 29 $173,000 1 $157,430 APPLICATIONS APPROVED, NOT ACCEPTED 3 $224,713 5 $229,456 0 $0 APPLICATIONS DENIED 0 $0 0 $0 0 $0 APPLICATIONS WITHDRAWN 1 $312,350 0 $0 0 $0 FILES CLOSED FOR INCOMPLETENESS 0 $0 0 $0 0 $0
Aggregated Statistics For Year 2000(Based on 3 full and 1 partial tracts) A) Conventional B) Refinancings C) Non-occupant Loans on Number Average Value Number Average Value Number Average Value
LOANS ORIGINATED 56 $200,760 13 $151,441 3 $121,667 APPLICATIONS APPROVED, NOT ACCEPTED 5 $223,674 4 $212,700 0 $0 APPLICATIONS DENIED 0 $0 0 $0 0 $0 APPLICATIONS WITHDRAWN 1 $170,000 1 $125,000 0 $0 FILES CLOSED FOR INCOMPLETENESS 0 $0 1 $123,000 0 $0
Aggregated Statistics For Year 1999(Based on 4 full and 2 partial tracts) A) Conventional B) Refinancings C) Non-occupant Loans on Number Average Value Number Average Value Number Average Value
LOANS ORIGINATED 120 $198,606 53 $161,502 2 $163,685 APPLICATIONS APPROVED, NOT ACCEPTED 15 $215,097 9 $148,970 0 $0 APPLICATIONS DENIED 4 $257,812 2 $161,515 0 $0 APPLICATIONS WITHDRAWN 3 $166,820 3 $266,947 0 $0 FILES CLOSED FOR INCOMPLETENESS 1 $199,760 2 $124,290 0 $0
Detailed PMIC statistics for the following Tracts:
4611.00
, 4612.00 , 4615.00 , 4616.00 , 4618.00 , 4619.00
Most common first names in Oakton, VA among deceased individuals Name Count Lived (average)
Mary 46 81.2 years Robert 39 70.4 years John 30 72.8 years William 30 74.8 years James 25 70.9 years Joseph 23 80.6 years Helen 21 84.4 years Ruth 16 79.2 years Margaret 16 82.6 years Charles 16 75.5 years
Most common last names in Oakton, VA among deceased individuals Last name Count Lived (average)
Jones 12 77.2 years Smith 10 81.8 years Williams 10 81.1 years Davis 7 74.0 years Thomas 7 81.1 years Brown 7 79.4 years Campbell 6 83.2 years Thompson 6 75.0 years Harris 5 66.0 years Cook 5 77.8 years
Oakton compared to Virginia state average:
Median household income above state average. Median house value above state average. Unemployed percentage significantly below state average. Black race population percentage below state average. Foreign-born population percentage significantly above state average. Length of stay since moving in significantly above state average. Percentage of population with a bachelor's degree or higher significantly above state average.
#33 on the list of "Top 101 cities with largest percentage of males in occupations: business and financial operations occupations (population 5,000+)"
#61 on the list of "Top 101 cities with largest percentage of males in industries: professional, scientific, and technical services (population 5,000+)"
#67 on the list of "Top 101 cities with largest percentage of females in industries: professional, scientific, and technical services (population 5,000+)"
#69 on the list of "Top 101 cities with the most residents born in Korea (population 500+)"
#88 on the list of "Top 101 cities with the most residents born in Bolivia (population 500+)"
#90 on the list of "Top 101 cities with the most residents born in Jordan (population 500+)"
#91 on the list of "Top 101 cities with the most people having Master's or Doctorate degrees (population 5,000+)"
#3 on the list of "Top 101 counties with the largest number of children under 18 without health insurance coverage in 2000 (pop. 50,000+)"
#4 on the list of "Top 101 counties with the lowest lead air pollution readings in 2012 (µg/m3 )"
#5 on the list of "Top 101 counties with the largest number of people without health insurance coverage in 2000 (pop. 50,000+)"
#7 on the list of "Top 101 counties with the largest increase in the number of infant deaths per 1000 residents 2000-2006 to 2007-2013 (pop. 50,000+)"
#13 on the list of "Top 101 counties with the lowest number of deaths per 1000 residents 2007-2013 (pop. 50,000+)"
Top Patent Applicants
Jean-Paul Martin (33)
Jinsook Ryu (29)
Alan Keister (23)
Abdur R. Chowdhury (21)
Kenneth Gould (21)
Sushil Jajodia (16)
Michael A. Huff (13)
Philip H. Warrick (11)
Philip Austin Kedy (6)
Dwij Trivedi (6)
Total of 423 patent applications in 2008-2024.
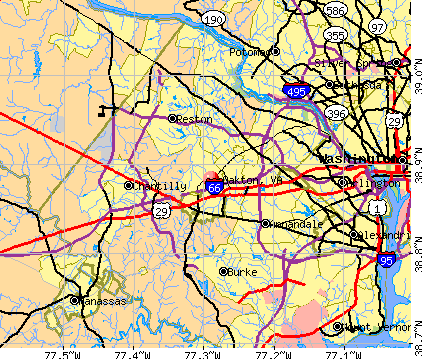


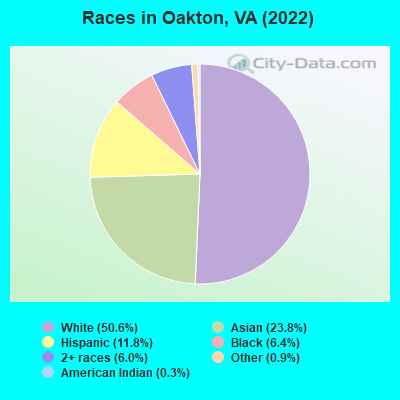
 Recent articles from our blog. Our writers, many of them Ph.D. graduates or candidates, create easy-to-read articles on a wide variety of topics.

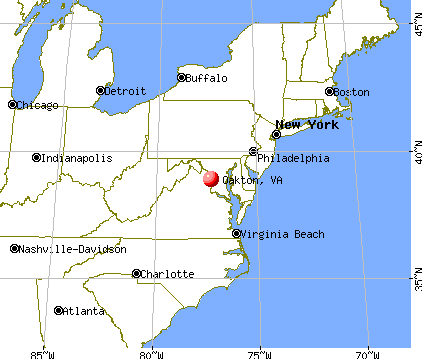
 (5.4 miles
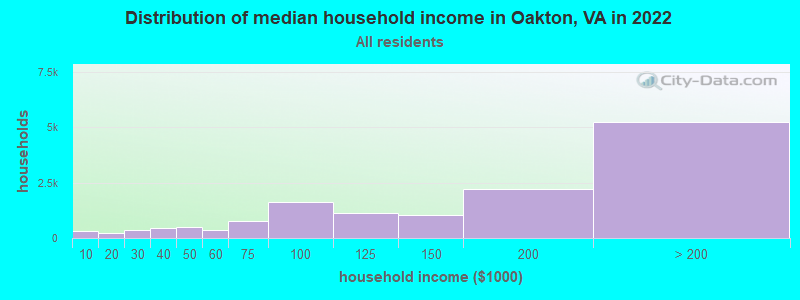
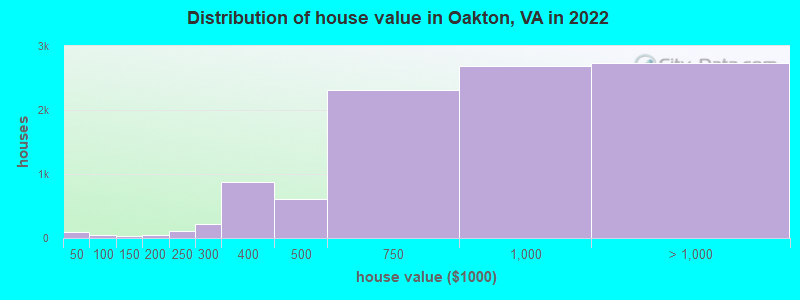
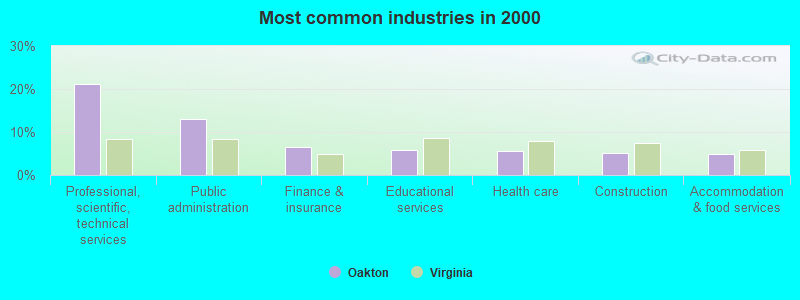
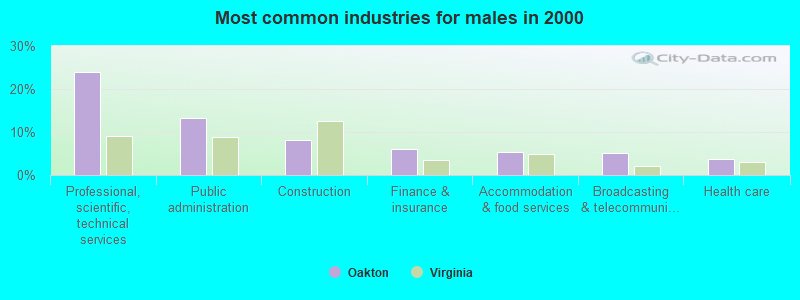
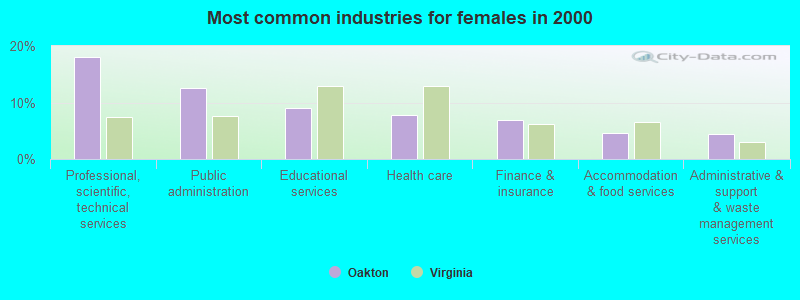
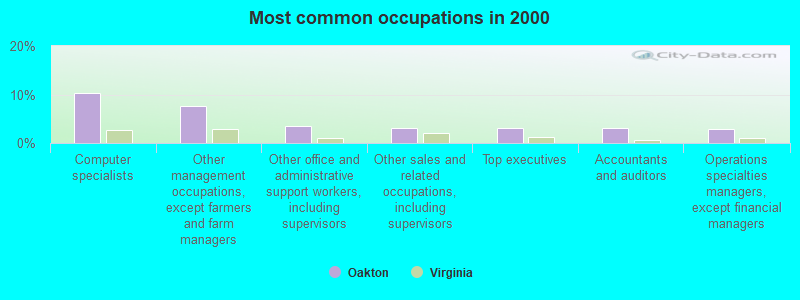
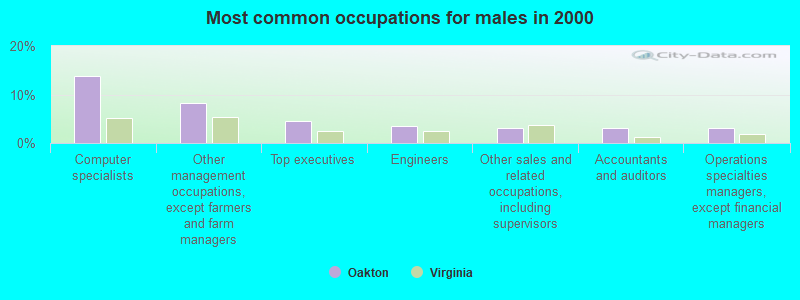
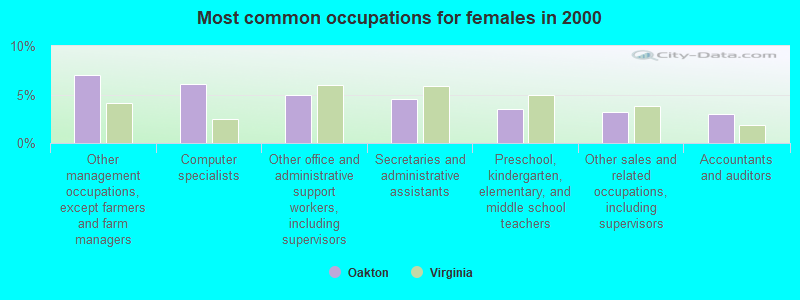
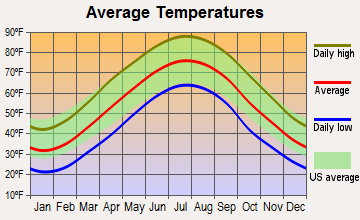
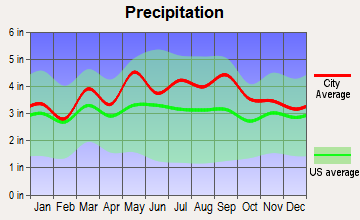
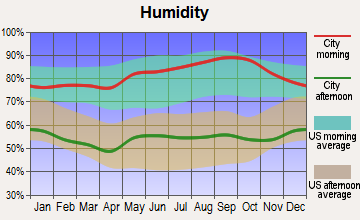
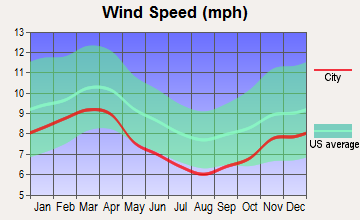
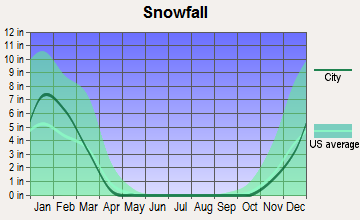
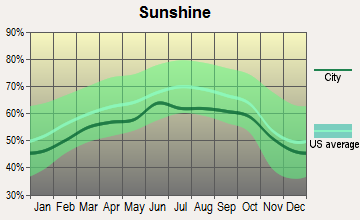
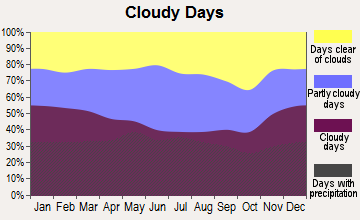
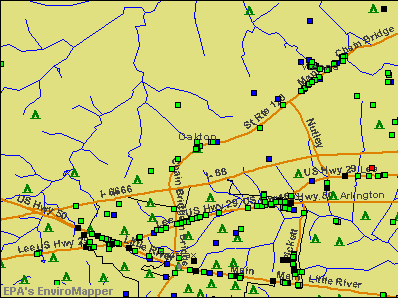

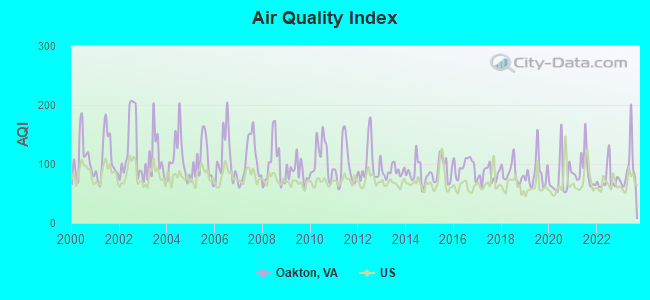
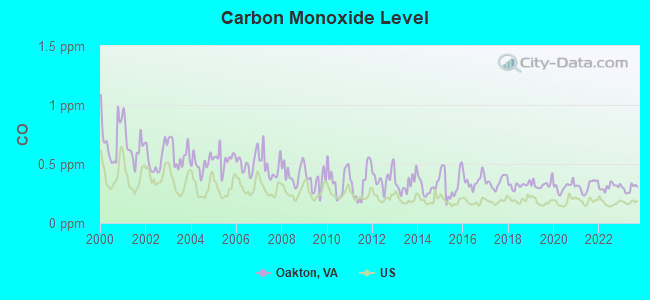
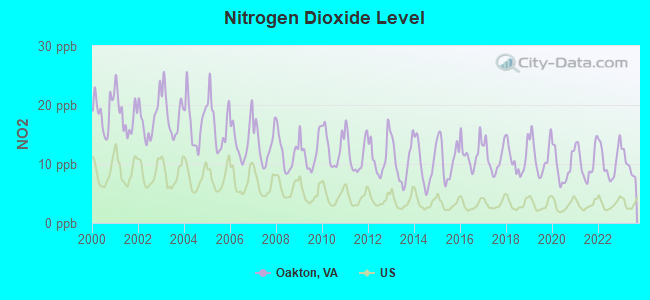

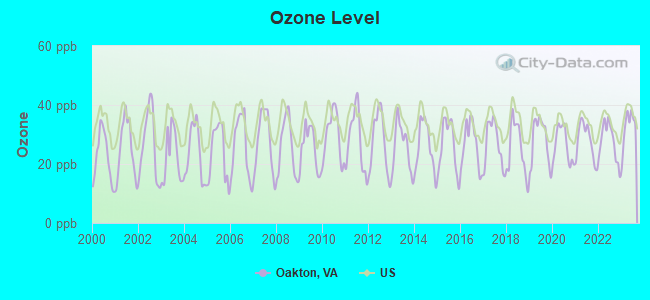
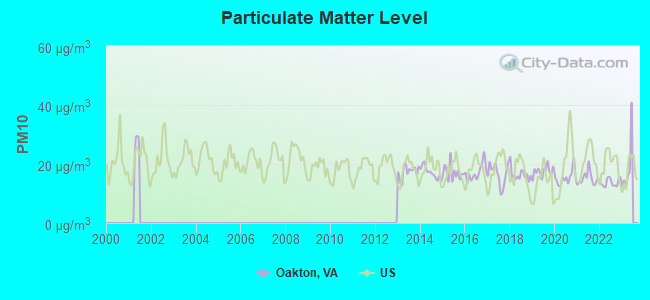
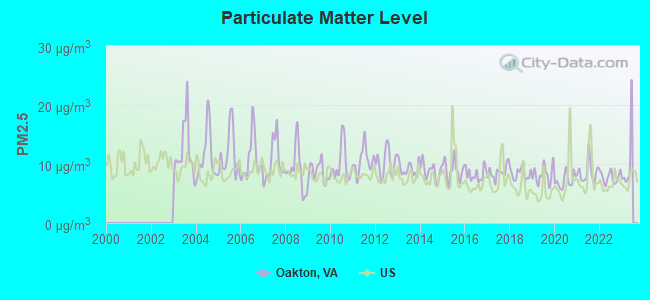
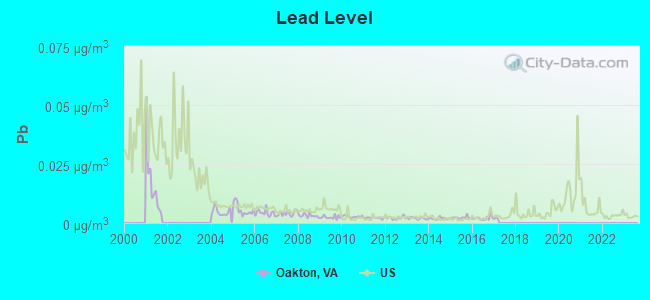
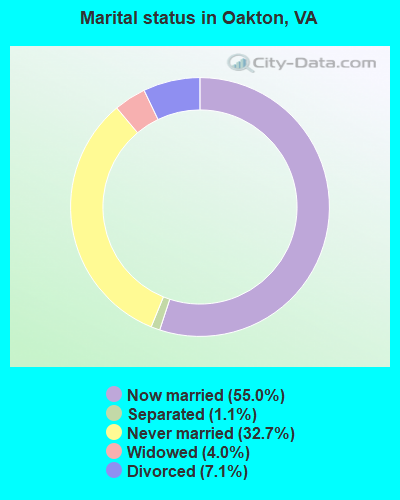
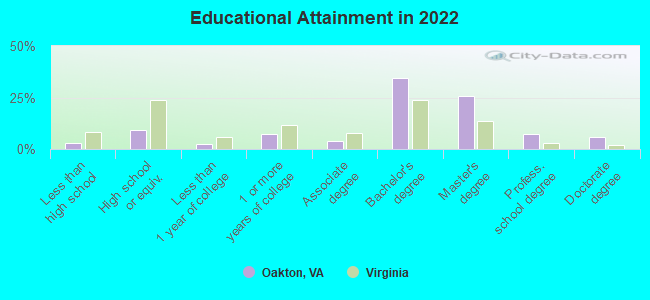

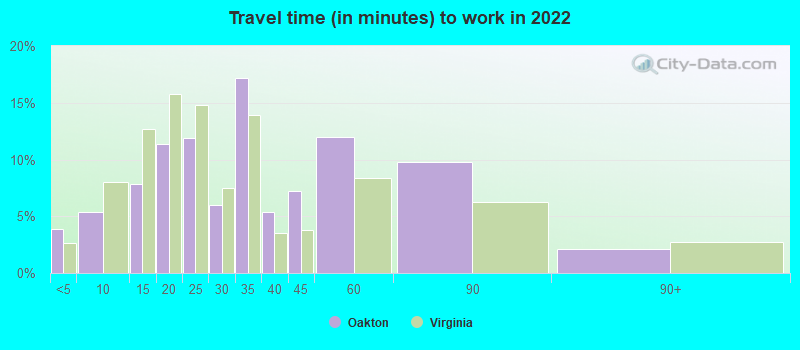
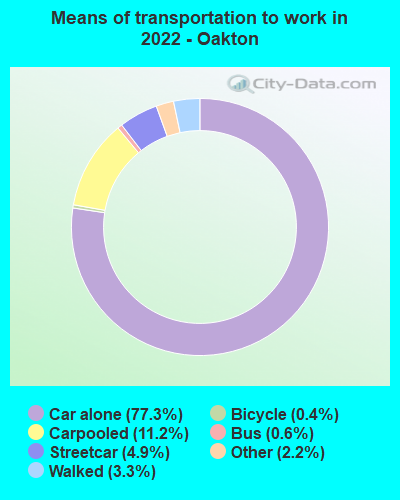
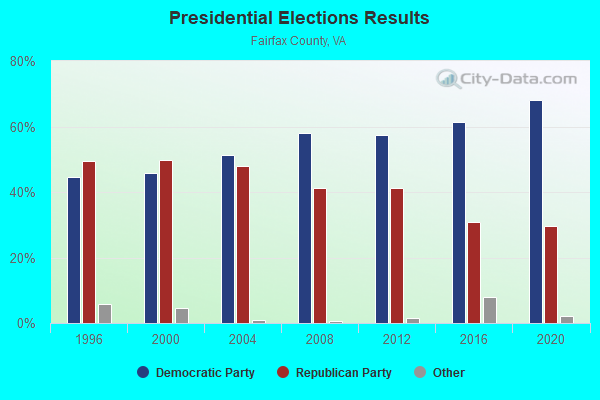
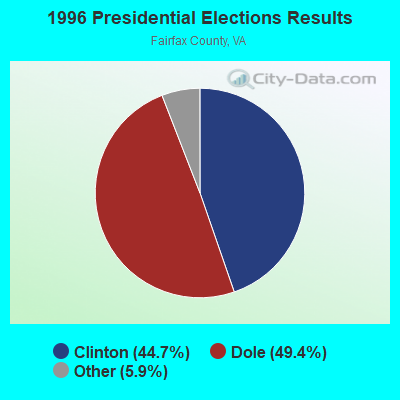
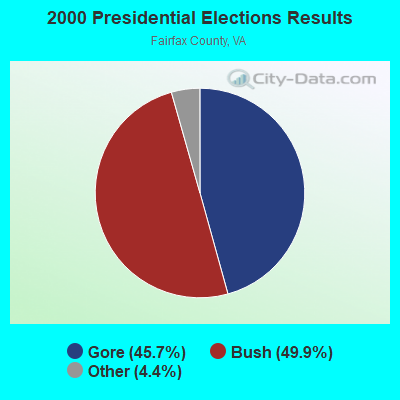
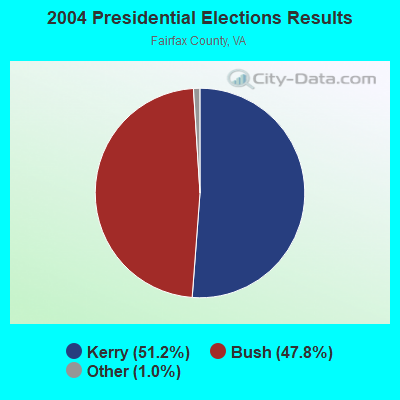
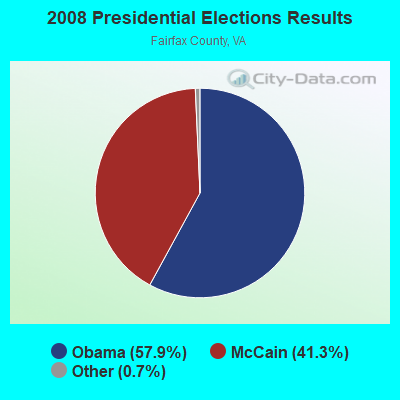
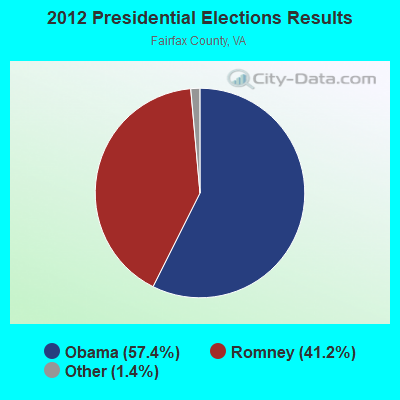
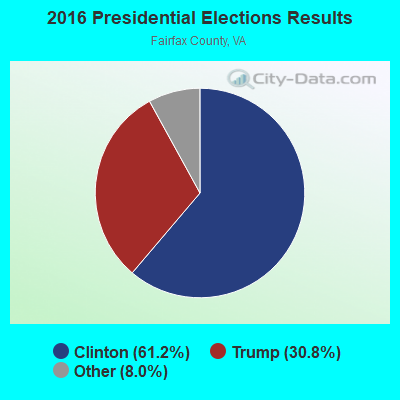
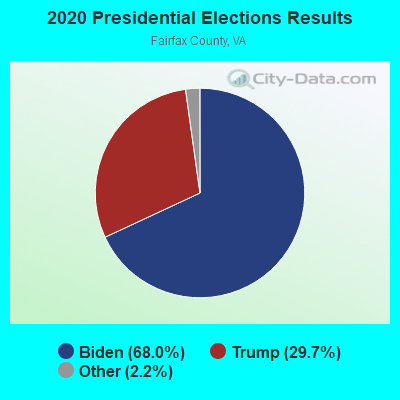
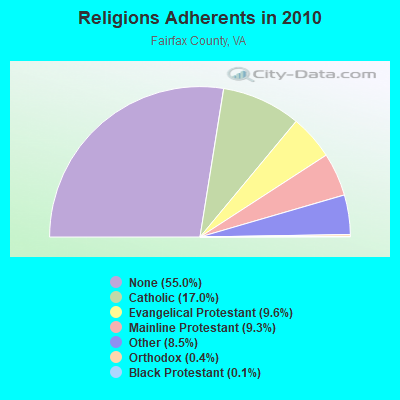
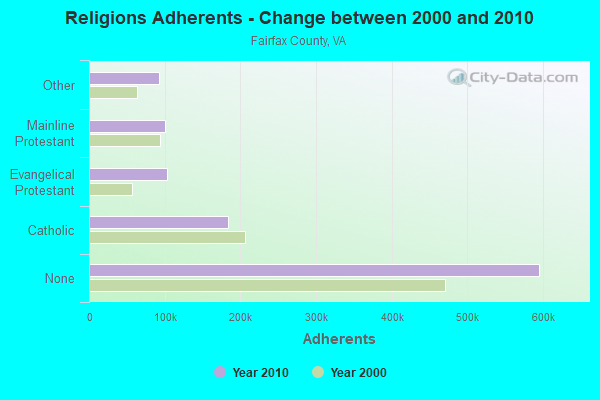
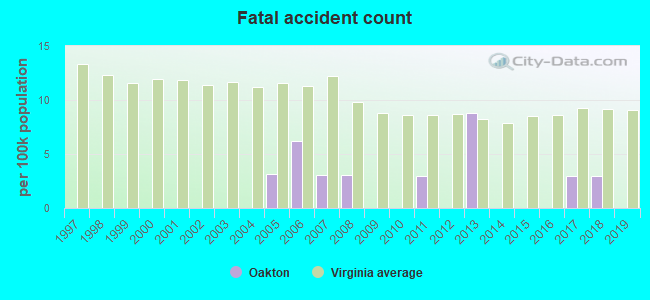
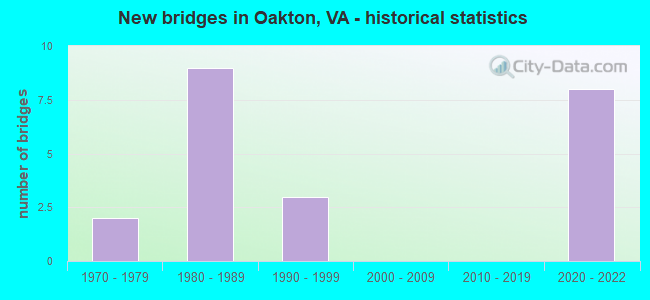
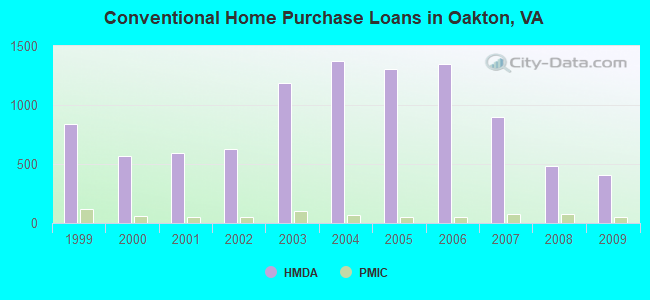
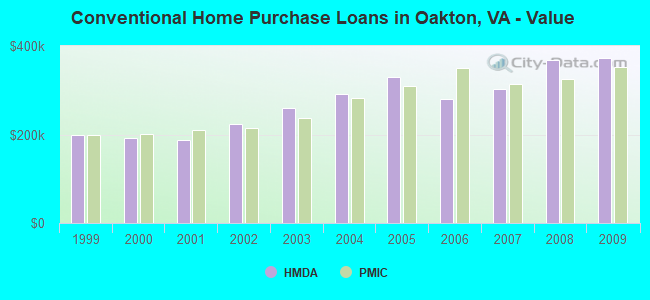
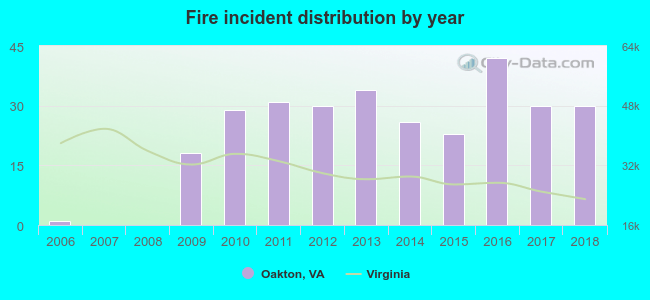 According to the data from the years 2006 - 2018 the average number of fire incidents per year is 23. The highest number of fire incidents - 42 took place in 2016, and the least - 0 in 2007. The data has a rising trend.
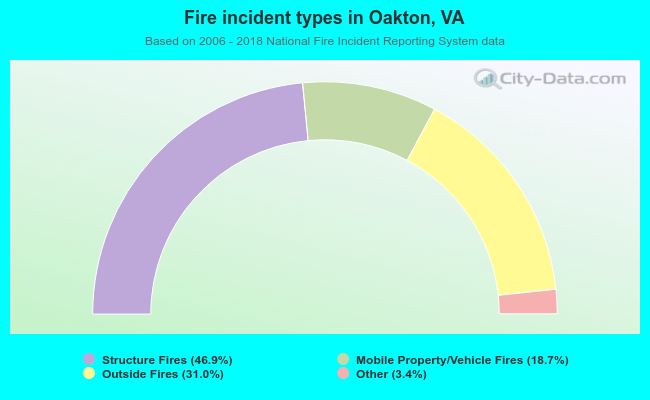 When looking into fire subcategories, the most reports belonged to: Structure Fires (46.9%), and Outside Fires (31.0%).