Oakton, VA (Virginia) Houses and Residents
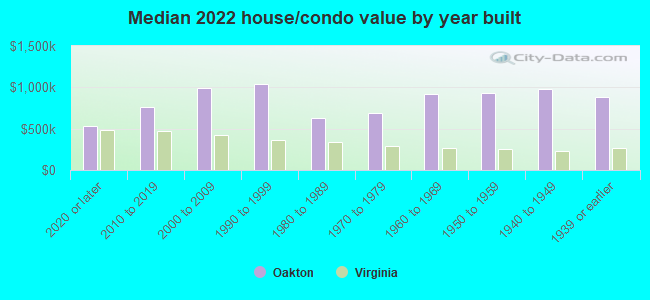
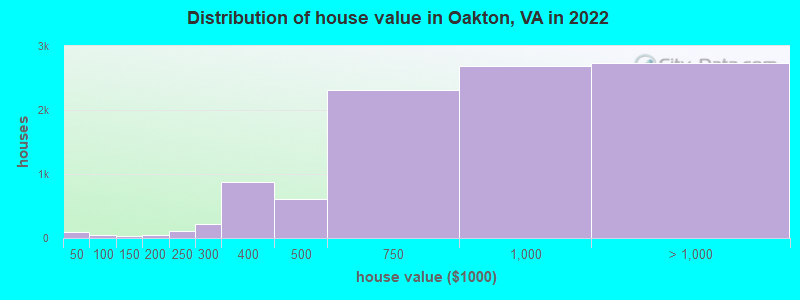
Estimated median house or condo value in 2022: $795,264 (it was $274,800 in 2000 )
Oakton:
$795,264Virginia:
$365,700
Lower value quartile - upper value quartile: $540,050 - $1,034,822Mean price in 2022: Detached houses: $1,157,140 Here:
$1,157,140State:
$472,865
Townhouses or other attached units: $748,846 Here:
$748,846State:
$457,437
In 3-to-4-unit structures: $354,275 Here:
$354,275State:
$252,346
In 5-or-more-unit structures: $369,711 Here:
$369,711State:
$382,551
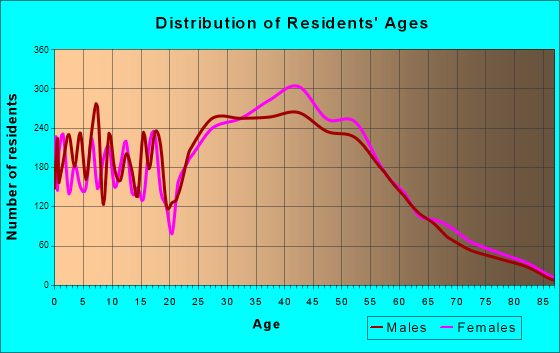
Total population: 34,166 (Urban population: 29,385, Rural population: 0)
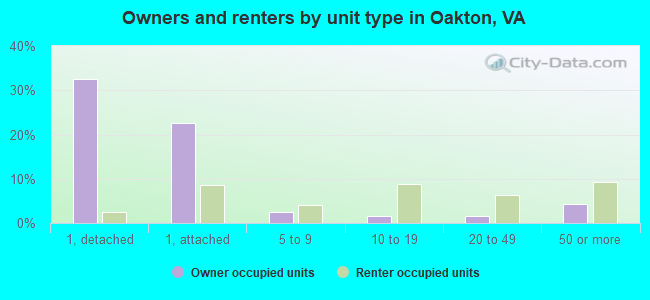
Houses: 14,560 (14,164 occupied: 9,602 owner occupied, 4,639 renter occupied )
% of renters here:
33%State:
33%
Housing density: 1,500 houses/condos per square mile
Median price asked for vacant for-sale houses and condos in 2022: $3,172,550.
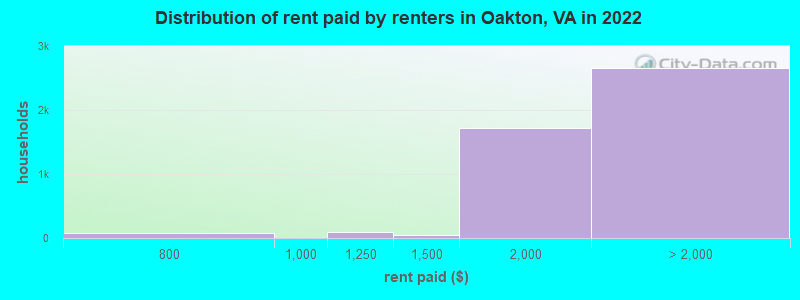
Median contract rent in 2022: over $2,000 (lower quartile is $1,760, upper quartile is over $2,000)
Median rent asked for vacant for-rent units in 2022: $2,756
Median gross rent in Oakton, VA in 2022: over $2,000
Housing units in Oakton with a mortgage: 6,559 (593 second mortgage, 4 home equity loan, 502 both second mortgage and home equity loan )Houses without a mortgage: 145
Median household income for houses/condos with a mortgage: $215,421
Median household income for apartments without a mortgage: $129,893
Median monthly housing costs: $2,284
Data:
Median house or condo value ($)
Median house or condo value ($ change since 2000)
Median house or condo value ($) - White
Median house or condo value ($) - Black or African American
Median house or condo value ($) - Asian
Median house or condo value ($) - Hispanic or Latino
Median house or condo value ($) - American Indian and Alaska Native
Median house or condo value ($) - Multirace
Median house or condo value ($) - Other Race
Median price asked for mobile homes ($)
Household density (households per square mile)
Mean house or condo value by units in structure - 1, detached ($)
Mean house or condo value by units in structure - 1, attached ($)
Mean house or condo value by units in structure - 2 ($)
Mean house or condo value by units in structure by units in structure - 3 or 4 ($)
Mean house or condo value by units in structure - 5 or more ($)
Mean house or condo value by units in structure - Boat, RV, van, etc. ($)
Mean house or condo value by units in structure - Mobile home ($)
Median contract rent ($)
Median contract rent - Lower quartile ($)
Median contract rent - Upper quartile ($)
Median gross rent ($)
Urban houses (%)
Rural houses (%)
Houses occupied (%)
Houses occupied (% change since 2000)
Houses owner occupied (%)
Houses owner occupied (% change since 2000)
Houses renter occupied (%)
Houses renter occupied (% change since 2000)
Vacant housing units - For rent (%)
Vacant housing units - For rent (% change since 2000)
Vacant housing units - For sale only (%)
Vacant housing units - For sale only (% change since 2000)
Vacant housing units - Rented or sold, not occupied (%)
Vacant housing units - Rented or sold, not occupied (% change since 2000)
Vacant housing units - For seasonal, recreational, or occasional use (%)
Vacant housing units - For seasonal, recreational, or occasional use (% change since 2000)
Vacant housing units - For migrant workers (%)
Vacant housing units - For migrant workers (% change since 2000)
Vacant housing units - Other vacant (%)
Vacant housing units - Other vacant (% change since 2000)
Median monthly housing costs ($)
Median household income for houses/condos with a mortgage ($)
Median household income for houses/condos without a mortgage ($)
Median household income ($)
Median household income ($) - White
Median household income ($) - Black or African American
Median household income ($) - Asian
Median household income ($) - Hispanic or Latino
Median household income ($) - American Indian and Alaska Native
Median household income ($) - Multirace
Median household income ($) - Other Race
Mortgage status - with mortgage (%)
Mortgage status - with second mortgage (%)
Mortgage status - with home equity loan (%)
Mortgage status - with both second mortgage and home equity loan (%)
Mortgage status - without a mortgage (%)
Median year house/condo built
Median year apartment built
Household type by relationship - Male householder living alone (%)
Household type by relationship - Male householder not living alone (%)
Household type by relationship - Female householder living alone (%)
Household type by relationship - Female householder not living alone (%)
Household type by relationship - Opposite-Sex spouse (%)
Household type by relationship - Same-Sex spouse (%)
Household type by relationship - Opposite-Sex unmarried partner (%)
Household type by relationship - Same-Sex unmarried partner (%)
Household type by relationship - In group quarters (%)
Size of family households - 2-person household (%)
Size of family households - 3-person household (%)
Size of family households - 4-person household (%)
Size of family households - 5-person household (%)
Size of family households - 6-person household (%)
Size of family households - 7-or-more-person household (%)
Size of nonfamily households - 1-person household (%)
Size of nonfamily households - 2-person household (%)
Size of nonfamily households - 3-person household (%)
Size of nonfamily households - 4-person household (%)
Size of nonfamily households - 5-person household (%)
Size of nonfamily households - 6-person household (%)
Size of nonfamily households - 7-or-moreperson household (%)
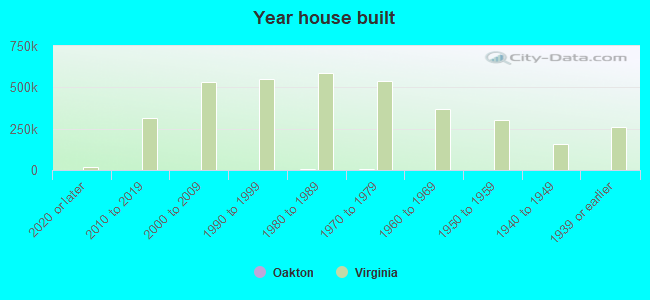
Year house built - Built 2010 or later (%)
Year house built - Built 2000 to 2009 (%)
Year house built - Built 1990 to 1999 (%)
Year house built - Built 1980 to 1989 (%)
Year house built - Built 1970 to 1979 (%)
Year house built - Built 1960 to 1969 (%)
Year house built - Built 1950 to 1959 (%)
Year house built - Built 1940 to 1949 (%)
Year house built - Built 1939 or earlier (%)
Median number of rooms in houses and condos
Median number of rooms in apartments
Median number of bedrooms in owner occupied houses
Mean number of bedrooms in owner occupied houses
Median number of bedrooms in renter occupied houses
Mean number of bedrooms in renter occupied houses
Median number of vehichles in owner occupied houses
Mean number of vehichles in owner occupied houses
Median number of vehichles in renter occupied houses
Mean number of vehichles in renter occupied houses
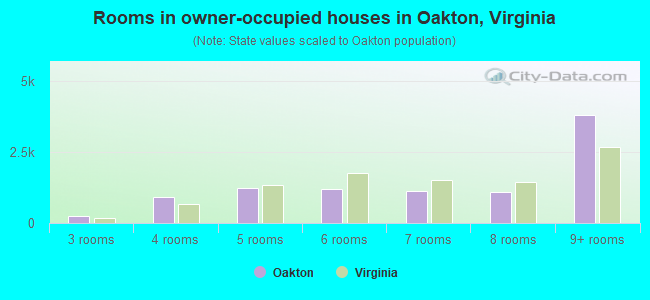
Rooms in owner-occupied houses - 1 room (%)
Rooms in owner-occupied houses - 2 rooms (%)
Rooms in owner-occupied houses - 3 rooms (%)
Rooms in owner-occupied houses - 4 rooms (%)
Rooms in owner-occupied houses - 5 rooms (%)
Rooms in owner-occupied houses - 6 rooms (%)
Rooms in owner-occupied houses - 7 rooms (%)
Rooms in owner-occupied houses - 8 rooms (%)
Rooms in owner-occupied houses - 9+ rooms (%)
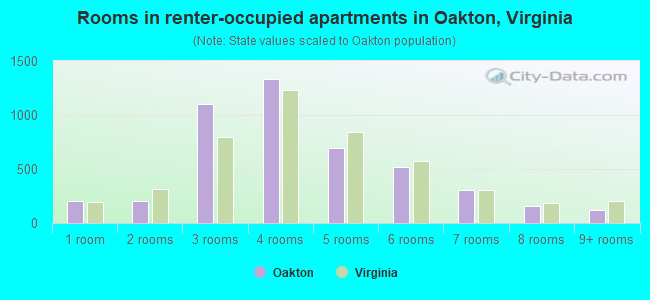
Rooms in renter-occupied houses - 1 room (%)
Rooms in renter-occupied houses - 2 rooms (%)
Rooms in renter-occupied houses - 3 rooms (%)
Rooms in renter-occupied houses - 4 rooms (%)
Rooms in renter-occupied houses - 5 rooms (%)
Rooms in renter-occupied houses - 6 rooms (%)
Rooms in renter-occupied houses - 7 rooms (%)
Rooms in renter-occupied houses - 8 rooms (%)
Rooms in renter-occupied houses - 9+ rooms (%)
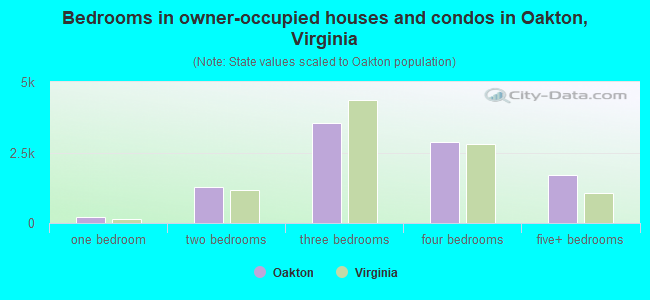
Bedrooms in owner-occupied houses - no bedrooms (%)
Bedrooms in owner-occupied houses - 1 bedroom (%)
Bedrooms in owner-occupied houses - 2 bedrooms (%)
Bedrooms in owner-occupied houses - 3 bedrooms (%)
Bedrooms in owner-occupied houses - 4 bedrooms (%)
Bedrooms in owner-occupied houses - 5+ bedrooms (%)
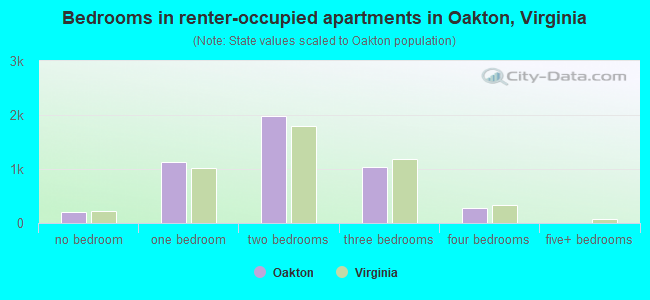
Bedrooms in renter-occupied houses - no bedrooms (%)
Bedrooms in renter-occupied houses - 1 bedroom (%)
Bedrooms in renter-occupied houses - 2 bedrooms (%)
Bedrooms in renter-occupied houses - 3 bedrooms (%)
Bedrooms in renter-occupied houses - 4 bedrooms (%)
Bedrooms in renter-occupied houses - 5+ bedrooms (%)
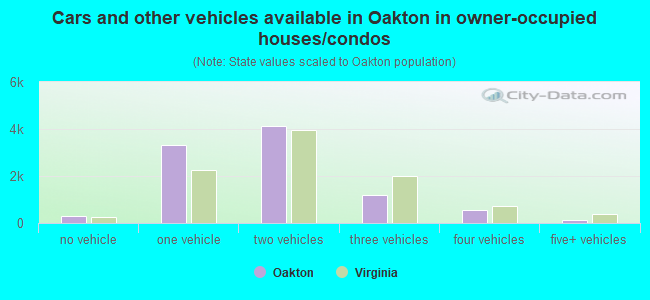
Vehicles available in owner-occupied houses - no vehicle available (%)
Vehicles available in owner-occupied houses - 1 vehicle available(%)
Vehicles available in owner-occupied houses - 2 Vehicles available (%)
Vehicles available in owner-occupied houses - 3 Vehicles available (%)
Vehicles available in owner-occupied houses - 4 Vehicles available (%)
Vehicles available in owner-occupied houses - 5+ Vehicles available (%)
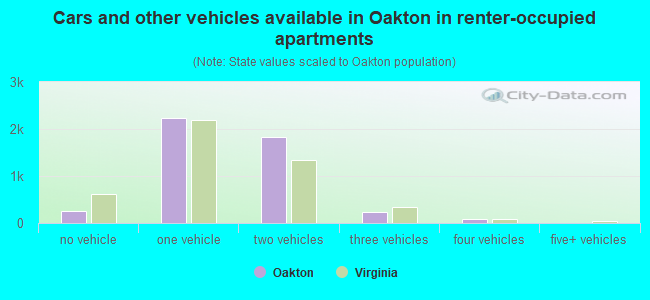
Vehicles available in renter-occupied houses - no vehicle available (%)
Vehicles available in renter-occupied houses - 1 vehicle available (%)
Vehicles available in renter-occupied houses - 2 Vehicles available (%)
Vehicles available in renter-occupied houses - 3 Vehicles available (%)
Vehicles available in renter-occupied houses - 4 Vehicles available (%)
Vehicles available in renter-occupied houses - 5+ Vehicles available (%)
Housing units in structures - 1, detached (%)
Housing units in structures - 1, attached (%)
Housing units in structures - 2 (%)
Housing units in structures - 3 or 4 (%)
Housing units in structures - 5 to 9 (%)
Housing units in structures - 10 to 19 (%)
Housing units in structures - 20 to 49 (%)
Housing units in structures - 50 or more (%)
Housing units in structures - Mobile home (%)
Housing units in structures - Boat, RV, van, etc. (%)
Housing units in structures - Owners - 1, detached (%)
Housing units in structures - Owners - 1, attached (%)
Housing units in structures - Owners - 2 (%)
Housing units in structures - Owners - 3 or 4 (%)
Housing units in structures - Owners - 5 to 9 (%)
Housing units in structures - Owners - 10 to 19 (%)
Housing units in structures - Owners - 20 to 49 (%)
Housing units in structures - Owners - 50 or more (%)
Housing units in structures - Owners - Mobile home (%)
Housing units in structures - Owners - Boat, RV, van, etc. (%)
Housing units in structures - Renters - 1, detached (%)
Housing units in structures - Renters - 1, attached (%)
Housing units in structures - Renters - 2 (%)
Housing units in structures - Renters - 3 or 4 (%)
Housing units in structures - Renters - 5 to 9 (%)
Housing units in structures - Renters - 10 to 19 (%)
Housing units in structures - Renters - 20 to 49 (%)
Housing units in structures - Renters - 50 or more (%)
Housing units in structures - Renters - Mobile home (%)
Housing units in structures - Renters - Boat, RV, van, etc. (%)
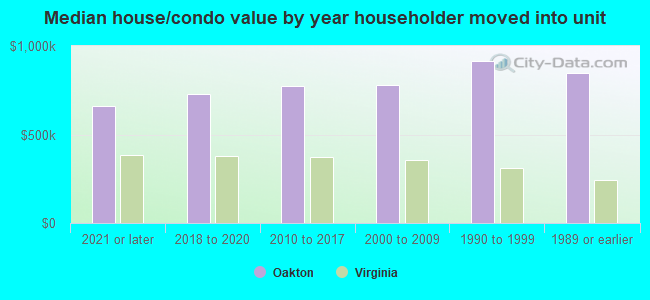
House/condo owner moved in on average (years ago)
Renter moved in on average (years ago)
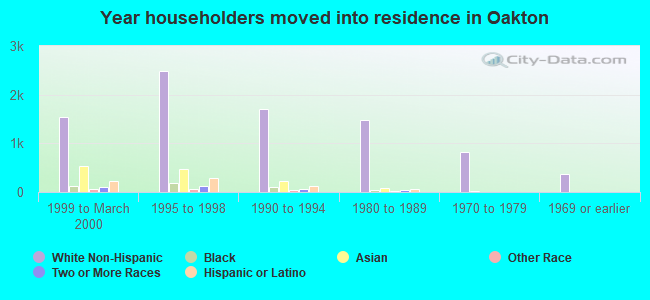
Year householder moved into unit - Moved in 1999 to March 2000 (%)
Year householder moved into unit - Moved in 1999 to March 2000 (%) - White
Year householder moved into unit - Moved in 1999 to March 2000 (%) - Black or African American
Year householder moved into unit - Moved in 1999 to March 2000 (%) - Asian
Year householder moved into unit - Moved in 1999 to March 2000 (%) - Hispanic or Latino
Year householder moved into unit - Moved in 1999 to March 2000 (%) - American Indian and Alaska Native
Year householder moved into unit - Moved in 1999 to March 2000 (%) - Multirace
Year householder moved into unit - Moved in 1999 to March 2000 (%) - Other Race
Year householder moved into unit - Moved in 1995 to 1998 (%)
Year householder moved into unit - Moved in 1995 to 1998 (%) - White
Year householder moved into unit - Moved in 1995 to 1998 (%) - Black or African American
Year householder moved into unit - Moved in 1995 to 1998 (%) - Asian
Year householder moved into unit - Moved in 1995 to 1998 (%) - Hispanic or Latino
Year householder moved into unit - Moved in 1995 to 1998 (%) - American Indian and Alaska Native
Year householder moved into unit - Moved in 1995 to 1998 (%) - Multirace
Year householder moved into unit - Moved in 1995 to 1998 (%) - Other Race
Year householder moved into unit - Moved in 1990 to 1994 (%)
Year householder moved into unit - Moved in 1990 to 1994 (%) - White
Year householder moved into unit - Moved in 1990 to 1994 (%) - Black or African American
Year householder moved into unit - Moved in 1990 to 1994 (%) - Asian
Year householder moved into unit - Moved in 1990 to 1994 (%) - Hispanic or Latino
Year householder moved into unit - Moved in 1990 to 1994 (%) - American Indian and Alaska Native
Year householder moved into unit - Moved in 1990 to 1994 (%) - Multirace
Year householder moved into unit - Moved in 1990 to 1994 (%) - Other Race
Year householder moved into unit - Moved in 1980 to 1989 (%)
Year householder moved into unit - Moved in 1980 to 1989 (%) - White
Year householder moved into unit - Moved in 1980 to 1989 (%) - Black or African American
Year householder moved into unit - Moved in 1980 to 1989 (%) - Asian
Year householder moved into unit - Moved in 1980 to 1989 (%) - Hispanic or Latino
Year householder moved into unit - Moved in 1980 to 1989 (%) - American Indian and Alaska Native
Year householder moved into unit - Moved in 1980 to 1989 (%) - Multirace
Year householder moved into unit - Moved in 1980 to 1989 (%) - Other Race
Year householder moved into unit - Moved in 1970 to 1979 (%)
Year householder moved into unit - Moved in 1970 to 1979 (%) - White
Year householder moved into unit - Moved in 1970 to 1979 (%) - Black or African American
Year householder moved into unit - Moved in 1970 to 1979 (%) - Asian
Year householder moved into unit - Moved in 1970 to 1979 (%) - Hispanic or Latino
Year householder moved into unit - Moved in 1970 to 1979 (%) - American Indian and Alaska Native
Year householder moved into unit - Moved in 1970 to 1979 (%) - Multirace
Year householder moved into unit - Moved in 1970 to 1979 (%) - Other Race
Year householder moved into unit - Moved in 1969 or earlier (%)
Year householder moved into unit - Moved in 1969 or earlier (%) - White
Year householder moved into unit - Moved in 1969 or earlier (%) - Black or African American
Year householder moved into unit - Moved in 1969 or earlier (%) - Asian
Year householder moved into unit - Moved in 1969 or earlier (%) - Hispanic or Latino
Year householder moved into unit - Moved in 1969 or earlier (%) - American Indian and Alaska Native
Year householder moved into unit - Moved in 1969 or earlier (%) - Multirace
Year householder moved into unit - Moved in 1969 or earlier (%) - Other Race
Housing units lacking complete plumbing facilities (%)
Housing units lacking complete kitchen facilities (%)
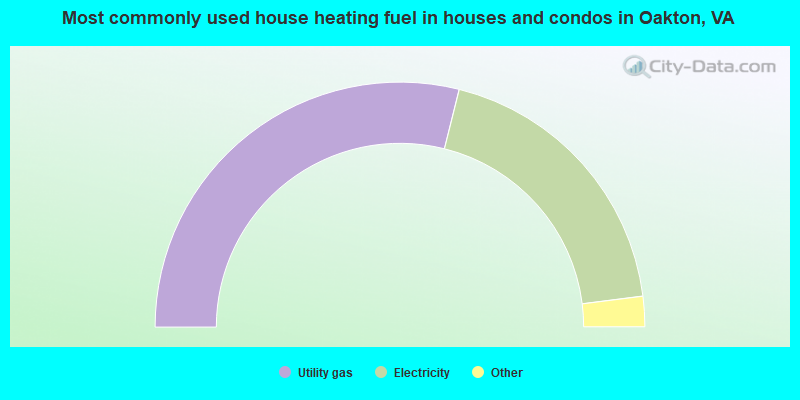
House heating fuel used in houses and condos - Utility gas (%)
House heating fuel used in houses and condos - Bottled, tank, or LP gas (%)
House heating fuel used in houses and condos - Electricity (%)
House heating fuel used in houses and condos - Fuel oil, kerosene, etc. (%)
House heating fuel used in houses and condos - Coal or coke (%)
House heating fuel used in houses and condos - Wood (%)
House heating fuel used in houses and condos - Solar energy (%)
House heating fuel used in houses and condos - Other fuel (%)
House heating fuel used in houses and condos - No fuel used (%)
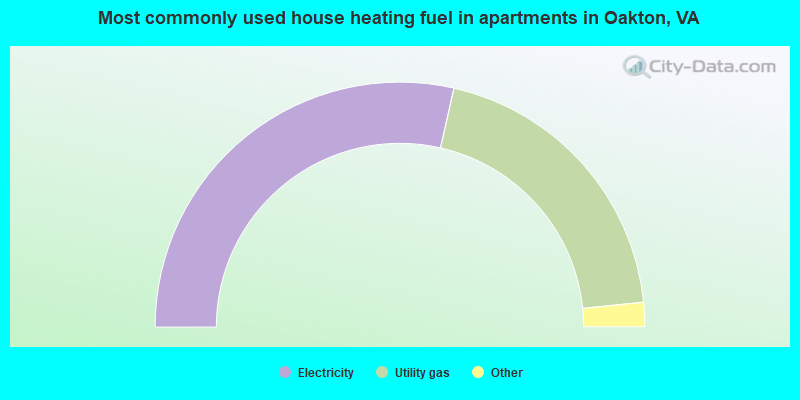
House heating fuel used in apartments - Utility gas (%)
House heating fuel used in apartments - Bottled, tank, or LP gas (%)
House heating fuel used in apartments - Electricity (%)
House heating fuel used in apartments - Fuel oil, kerosene, etc. (%)
House heating fuel used in apartments - Coal or coke (%)
House heating fuel used in apartments - Wood (%)
House heating fuel used in apartments - Solar energy (%)
House heating fuel used in apartments - Other fuel (%)
House heating fuel used in apartments - No fuel used (%)
Latest news about housing in Oakton, VA collected exclusively by city-data.com from local newspapers, TV, and radio stations
Median year house/condo built: 1981Median year apartment built: 1988Household type by relationship:
Households: 36,305
Male householders: 7,644 (1,496 living alone ), Female householders: 6,339 (2,322 living alone )7,660 spouses (7,566 opposite-sex spouses ), 574 unmarried partners , (557 opposite-sex unmarried partners ), 10,555 children (9,823 natural , 280 adopted , 452 stepchildren ), 172 grandchildren , 334 brothers or sisters , 682 parents , 0 foster children , 702 other relatives , 1,596 non-relatives In group quarters: 39
Size of family households: 4,035 2-persons , 1,955 3-persons , 2,151 4-persons , 635 5-persons , 232 6-persons , 253 7-or-more-persons .
Size of nonfamily households: 3,939 1-person , 955 2-persons , 130 3-persons , 7 4-persons , 35 5-persons .
6,237 married couples with children. single-parent households (489 men , 566 women ).
63.8% of residents of Oakton speak English at home. of residents speak Spanish at home (54% speak English very well , 28% speak English well , 12% speak English not well , 5% don't speak English at all ).of residents speak other Indo-European language at home (82% speak English very well , 15% speak English well , 3% speak English not well ).of residents speak Asian or Pacific Island language at home (58% speak English very well , 27% speak English well , 15% speak English not well ).of residents speak other language at home (85% speak English very well , 9% speak English well , 5% speak English not well , 2% don't speak English at all ).
Foreign born population: 11,889 (32.7%)of them are naturalized citizens )
Median number of rooms in houses and condos:
Median number of rooms in apartments
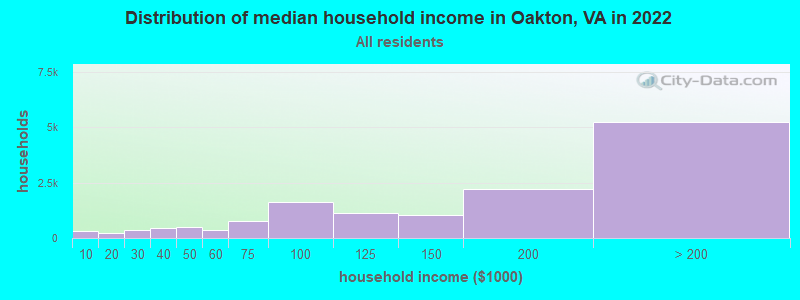
Oakton, VA household income distribution 309 Less than $10,000219 $10,000 to $19,999341 $20,000 to $29,999436 $30,000 to $39,999483 $40,000 to $49,999375 $50,000 to $59,999773 $60,000 to $74,9991,615 $75,000 to $99,9991,142 $100,000 to $124,9991,059 $125,000 to $149,9992,206 $150,000 to $199,9995,248 $200,000 or more
Home value of owner - occupied houses in 2022 in Oakton, VA 39 Less than $10,00017 $10,000 to $14,99943 $25,000 to $29,99952 $50,000 to $59,99935 $100,000 to $124,99942 $175,000 to $199,999101 $200,000 to $249,999217 $250,000 to $299,999878 $300,000 to $399,999609 $400,000 to $499,9992,312 $500,000 to $749,9992,686 $750,000 to $999,9992,125 $1,000,000 to $1,499,999312 $1,500,000 to $1,999,999294 $2,000,000 or moreRent paid by renters in 2022 in Oakton, VA 15 $100 to $1498 $350 to $39913 $500 to $54936 $700 to $74946 $750 to $79990 $1,000 to $1,24941 $1,250 to $1,4991,713 $1,500 to $1,9991,565 $2,000 to $2,499609 $2,500 to $2,999247 $3,000 to $3,499168 $3,500 or more62 No cash rent
Percentage of workers working in this county: 71.9%Number of people working at home: 6,679 (33.4% of all workers )
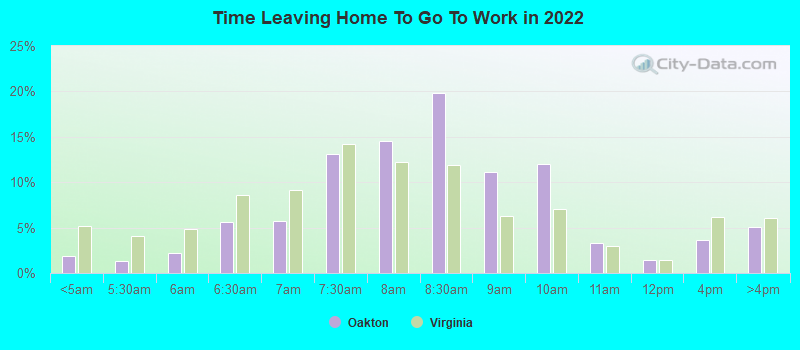
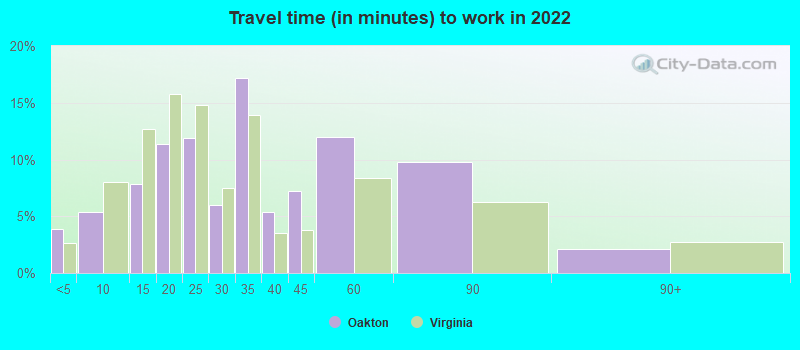
Travel time to work (commute)
Less than 5 minutes: 2835 to 9 minutes: 69410 to 14 minutes: 96615 to 19 minutes: 1,75620 to 24 minutes: 2,03125 to 29 minutes: 1,57330 to 34 minutes: 2,44535 to 39 minutes: 54540 to 44 minutes: 56845 to 59 minutes: 1,49260 to 89 minutes: 91790 or more minutes: 238
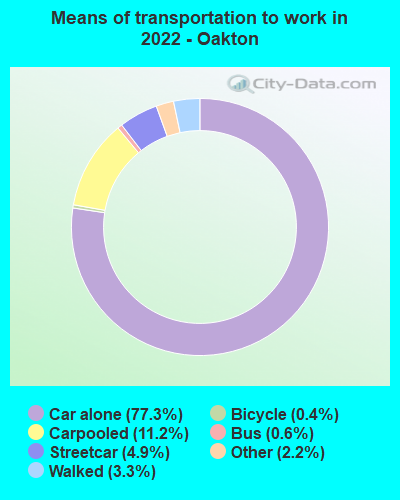
Means of transportation to work:
Drove a car alone: 5,056 (41.3%)Carpooled: 750 (6.1%)Bus : 27 (0.2%)Subway or elevated rail : 274 (2.2%)Taxi: 199 (1.6%)Bicycle: 20 (0.2%)Walked: 246 (2.0%)Worked at home: 6,679 (54.6%)
Unemployment by race in 2022
Unemployment rate for White non-Hispanic residents 3.9% Males1.4% FemalesUnemployment rate for Black residents 6.0% FemalesUnemployment rate for Asian residents 1.7% Males1.9% FemalesUnemployment rate for other race residents 3.5% FemalesUnemployment rate for two or more race residents 6.2% FemalesUnemployment rate for Hispanic or Latino residents 1.2% Males3.0% Females
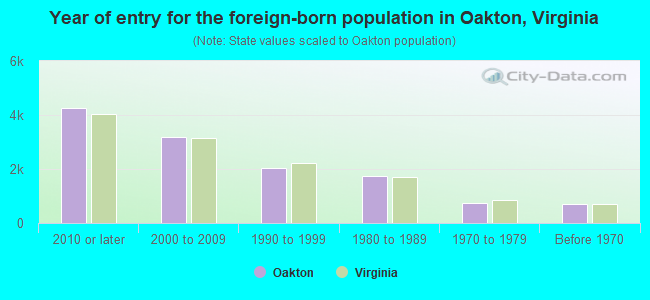
Year of entry for the foreign-born population in Oakton, Virginia
4,252 2010 or later 3,177 2000 to 2009 2,036 1990 to 1999 1,744 1980 to 1989 725 1970 to 1979 709 Before 1970
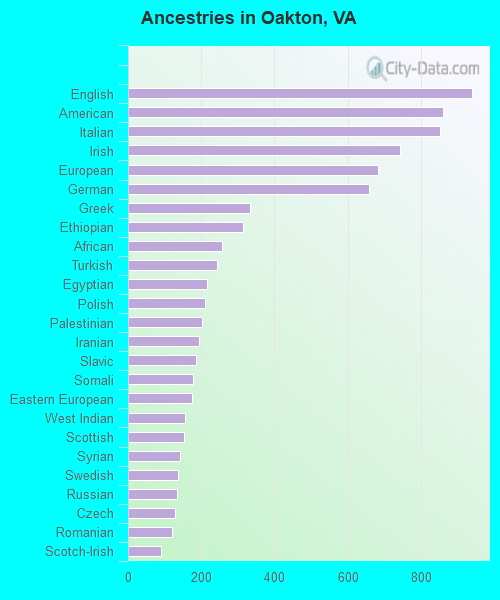
First ancestries reported:
English: 939 (4.6%)
American: 861 (4.2%)
Italian: 853 (4.2%)
Irish: 744 (3.6%)
European: 682 (3.3%)
German: 659 (3.2%)
Greek: 332 (1.6%)
Ethiopian: 315 (1.5%)
African: 256 (1.3%)
Turkish: 244 (1.2%)
Egyptian: 215 (1.1%)
Polish: 210 (1.0%)
Palestinian: 203 (1.0%)
Iranian: 194 (1.0%)
Slavic: 185 (0.9%)
Somali: 178 (0.9%)
Eastern European: 176 (0.9%)
West Indian: 155 (0.8%)
Scottish: 154 (0.8%)
Syrian: 142 (0.7%)
Swedish: 137 (0.7%)
Russian: 135 (0.7%)
Czech: 127 (0.6%)
Romanian: 121 (0.6%)
Scotch-Irish: 89 (0.4%)
British: 88 (0.4%)
Albanian: 83 (0.4%)
Norwegian: 80 (0.4%)
French: 68 (0.3%)
Belgian: 64 (0.3%)
Dutch: 63 (0.3%)
Iraqi: 59 (0.3%)
Afghan: 57 (0.3%)
Serbian: 57 (0.3%)
Brazilian: 55 (0.3%)
Hungarian: 46 (0.2%)
Ukrainian: 45 (0.2%)
Jamaican: 41 (0.2%)
Latvian: 38 (0.2%)
Scandinavian: 33 (0.2%)
Macedonian: 26 (0.1%)
Barbadian: 26 (0.1%)
Portuguese: 20 (0.10%)
Australian: 19 (0.09%)
Swiss: 19 (0.09%)
Armenian: 18 (0.09%)
Slovak: 17 (0.08%)
Finnish: 15 (0.07%)
Celtic: 11 (0.05%)
Moroccan: 9 (0.04%)
Lebanese: 8 (0.04%)
New Zealander: 8 (0.04%)
Welsh: 7 (0.03%)
Croatian: 6 (0.03%)
Most common places of birth for foreign-born residents (%): Korea Oakton:
13.1% (1,556)Virginia:
4.9% (52,857)
China, excluding Hong Kong and Taiwan Oakton:
10.5% (1,252)Virginia:
3.9% (42,989)
India Oakton:
7.8% (931)Virginia:
9.0% (97,830)
Peru Oakton:
4.6% (544)Virginia:
2.4% (26,366)
Vietnam Oakton:
4.2% (503)Virginia:
4.2% (45,750)
Nepal Oakton:
4.2% (501)Virginia:
0.9% (9,695)
Ethiopia Oakton:
3.3% (391)Virginia:
2.9% (32,082)
El Salvador Oakton:
2.9% (342)Virginia:
9.9% (107,534)
Philippines Oakton:
2.3% (275)Virginia:
4.8% (52,629)
Egypt Oakton:
2.1% (246)Virginia:
0.9% (9,672)
Bolivia Oakton:
2.0% (240)Virginia:
2.4% (25,722)
Mexico Oakton:
1.9% (225)Virginia:
5.3% (57,498)
Romania Oakton:
1.6% (186)Virginia:
0.3% (2,805)
Bangladesh Oakton:
1.6% (186)Virginia:
1.1% (12,049)
Honduras Oakton:
1.6% (185)Virginia:
3.0% (32,892)
Colombia Oakton:
1.5% (179)Virginia:
1.3% (14,435)
Place of birth for U.S.-born residents:
This state: 8,722Other state: 14,480Northeast: 5,032Midwest: 2,072South: 5,426West: 1,977 86.1% of Oakton residents lived in the same house 1 years ago.
Out of people who lived in different houses, 28.0% lived in this county.
Out of people who lived in different counties, 47.4% lived in Virginia.
Oakton:
86.1%State average:
86.6%
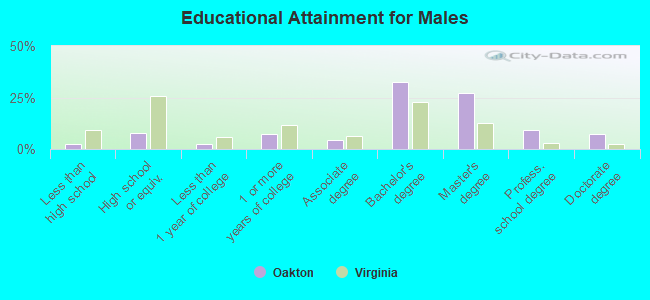
Education attainment for males 25 years and older:
No schooling: 108Nursery to 4th grade: 05th and 6th grade: 647th and 8th grade: 149th grade: 1910th grade: 4011th grade: 012th grade, no diploma: 39High school graduate (or equivalency): 1,007Less than 1 year of college: 290Some college more than 1 year, no degree: 920Associate degree: 525Bachelor's degree: 4,135Master's degree: 3,432Professional school degree: 1,148Doctorate degree: 947
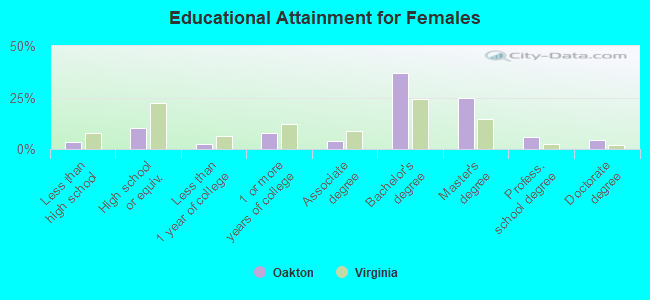
Education attainment for females 25 years and older:
No schooling: 224Nursery to 4th grade: 05th and 6th grade: 187th and 8th grade: 289th grade: 2910th grade: 3911th grade: 1512th grade, no diploma: 118High school graduate (or equivalency): 1,329Less than 1 year of college: 344Some college more than 1 year, no degree: 1,010Associate degree: 507Bachelor's degree: 4,779Master's degree: 3,229Professional school degree: 751Doctorate degree: 598
Housing units in structures:
One, detached: 5,167One, attached: 4,051Two: 1563 or 4: 2095 to 9: 81710 to 19: 1,69620 to 49: 1,12950 or more: 1,322Mobile homes: 11Housing units lacking complete plumbing facilities in 2022: 0.1%Housing units lacking complete kitchen facilities in 2022: 0.5%House/condo owner moved in on average 10 years ago
Renter moved in on average 3 years ago
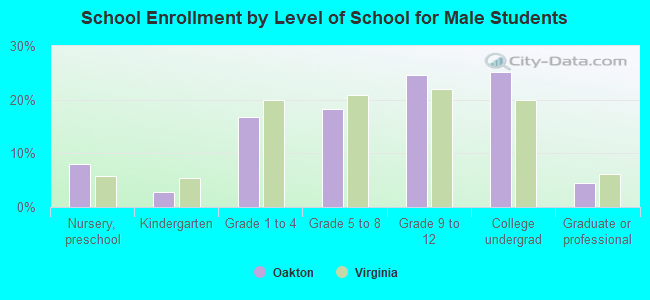
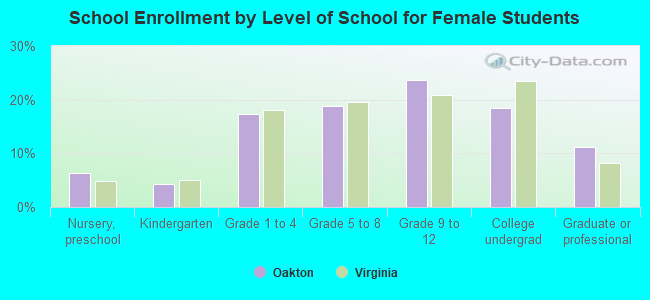
Private vs. public school enrollment:
Students in private schools in grades 1 to 8 (elementary and middle school): 332 Students in private schools in grades 9 to 12 (high school): 333 Students in private undergraduate colleges: 389