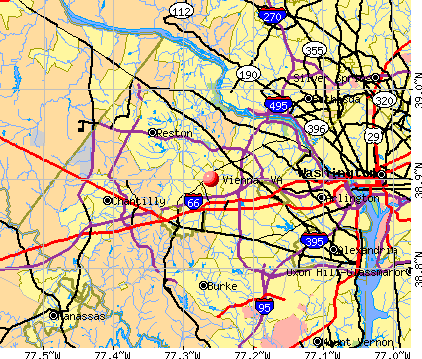
Vienna, Virginia

Vienna: A lovely surprise on a snowy February day. A red-tailed-hawk in the South Side Park of Vienna, Virginia.

Vienna: 24 February 2005 - Red-tailed-hawk in the South Side Park of Vienna, VA

Vienna: Meadowlark Park, Vienna, VA - a swallowtail working hard on Labor Day 2005!katyakei@cox.net

Vienna: A lovely surprise on a snowy February day. A red-tailed-hawk in the South Side Park of Vienna, Virginia.
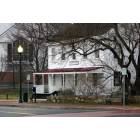
Vienna: Freeman Store
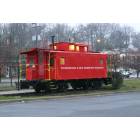
Vienna: W&OD Caboose at Vienna Centennial Park

Vienna: "Snowflakes on my deck." The December 2009 snowstorm in Vienna...
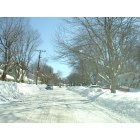
Vienna: A snow-covered street in Vienna, VA - The storm of February 2010... Cold and beautiful!

Vienna: Two friends in the Southside Park's woods...

Vienna: The mysterious beauty of wild mushrooms in the Southside Park of Vienna, Virginia. (Late November 2009.)

Vienna: Photo taken from a car in motion. Wild and wonderful nature - early Spring 2009... Beadle Road of Richmond, ME.
- see
23
more - add
your
Submit your own pictures of this town and show them to the world
- OSM Map
- General Map
- Google Map
- MSN Map
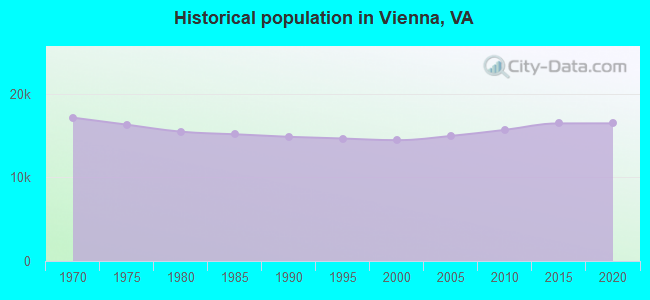
Population change since 2000: +12.6%
 |
| Males: 7,915 | |
| Females: 8,361 |
| Median resident age: | 42.1 years |
| Virginia median age: | 39.0 years |
Zip codes: 22180.
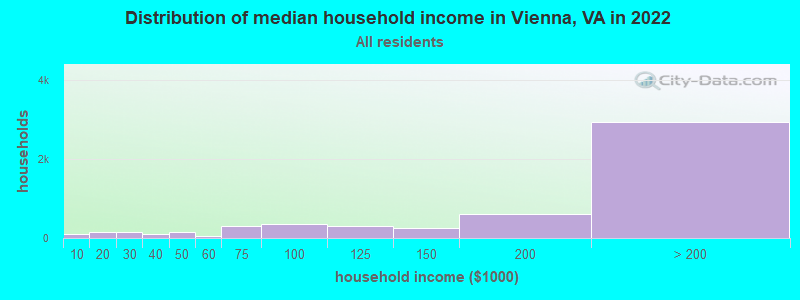
| Vienna: | over $200,000 |
| VA: | $85,873 |
Estimated per capita income in 2022: $89,170 (it was $37,753 in 2000)
Vienna town income, earnings, and wages data
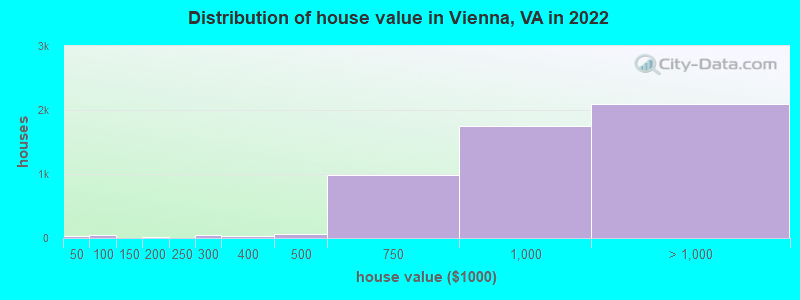
Estimated median house or condo value in 2022: $951,085 (it was $230,000 in 2000)
| Vienna: | $951,085 |
| VA: | $365,700 |
Mean prices in 2022: all housing units: over $1,000,000; detached houses: over $1,000,000; townhouses or other attached units: $836,461; in 5-or-more-unit structures: $355,451
Median gross rent in 2022: $2,353.
(3.5% for White Non-Hispanic residents, 8.0% for Black residents, 10.8% for Hispanic or Latino residents, 29.3% for other race residents, 1.8% for two or more races residents)
Detailed information about poverty and poor residents in Vienna, VA


Compare current foreclosures near Vienna, VA:
| Photo | Address | Area | Beds / Baths | Price | Details |
|---|---|---|---|---|---|

|
#1
Counsellor Dr
Vienna, VA 22181
|
1,916 sq. feet
|
2 baths 5 beds |
show details | |

|
#2
Clovermeadow Dr
Vienna, VA 22182
|
3,767 sq. feet
|
4 baths 6 beds |
show details | |

|
#3
Moore Ave SW
Vienna, VA 22180
|
1,008 sq. feet
|
3 baths 4 beds |
show details | |

|
#4
Bellforest Ct Apt 401
Vienna, VA 22180
|
1,126 sq. feet
|
3 baths 3 beds |
show details | |

|
#5
Wesleyan St
Vienna, VA 22180
|
1,242 sq. feet
|
2 baths 3 beds |
show details | |

|
#6
Fairway Dr NE
Vienna, VA 22180
|
1,472 sq. feet
|
3 baths 4 beds |
show details | |

|
#7
Windover Ave NW
Vienna, VA 22180
|
1,900 sq. feet
|
2 baths 4 beds |
show details | |

|
#8
Huntrace Way
Vienna, VA 22182
|
2,110 sq. feet
|
3 baths 5 beds |
show details | |

|
#9
Dellwood Dr
Vienna, VA 22180
|
1,196 sq. feet
|
2 baths 5 beds |
show details | |

|
#10
Cottage St SW
Vienna, VA 22180
|
1,800 sq. feet
|
5 baths 5 beds |
show details |
| Photo | Address | Area | Beds / Baths | Price | Details |
|---|---|---|---|---|---|

|
#11
Beulah Rd
Vienna, VA 22182
|
1,096 sq. feet
|
1 baths 4 beds |
show details | |

|
#12
Oakdale Woods Ct
Vienna, VA 22181
|
1,332 sq. feet
|
2 baths 3 beds |
show details | |

|
#13
Hunt Country Ln
Vienna, VA 22182
|
2,710 sq. feet
|
2 baths - beds |
show details | |

|
#14
Verveille Dr
Vienna, VA 22182
|
3,361 sq. feet
|
4 baths - beds |
show details | |

|
#15
Kramer Dr SE
Vienna, VA 22180
|
1,470 sq. feet
|
2 baths - beds |
show details | |

|
#16
Westbriar Ct NE
Vienna, VA 22180
|
1,122 sq. feet
|
2 baths - beds |
show details | |

|
#17
Maple Ave W # 155
Vienna, VA 22180
|
- sq. feet
|
3 baths - beds |
show details | |

|
#18
Leesburg Pike # 12
Vienna, VA 22182
|
- sq. feet
|
- baths - beds |
show details | |

|
#19
Gallows Rd
Vienna, VA 22180
|
- sq. feet
|
- baths - beds |
show details | |

|
#20
Harte Pl Apt 303
Vienna, VA 22180
|
- sq. feet
|
- baths - beds |
show details |
| Photo | Address | Area | Beds / Baths | Price | Details |
|---|---|---|---|---|---|

|
#21
Cathedral Ave NW Apt 108
Washington, DC 20016
|
765 sq. feet
|
1 baths 1 beds |
$279,900
|
show details |

|
#22
19th St NW
Washington, DC 20036
|
2,515 sq. feet
|
6 baths 8 beds |
$1,684,800
|
show details |

|
#23
Pooks Hill Rd Apt 1612s
Bethesda, MD 20814
|
1,250 sq. feet
|
1 baths 2 beds |
$289,000
|
show details |

|
#24
17th St NW Apt 504
Washington, DC 20009
|
800 sq. feet
|
1 baths 1 beds |
$419,900
|
show details |

|
#25
Eastern Ave NE
Washington, DC 20011
|
1,024 sq. feet
|
1 baths 3 beds |
$395,000
|
show details |

|
#26
Delaware Ave SW Apt N720
Washington, DC 20024
|
- sq. feet
|
1 baths 1 beds |
$155,000
|
show details |

|
#27
T St SE Apt 3
Washington, DC 20020
|
- sq. feet
|
2 baths 4 beds |
$339,900
|
show details |

|
#28
4th St NE Apt 2
Washington, DC 20002
|
1,061 sq. feet
|
2 baths 2 beds |
show details | |

|
#29
Prosperity Ave
Fairfax, VA 22031
|
2,090 sq. feet
|
3 baths 4 beds |
show details | |

|
#30
Commonwealth Blvd
Fairfax, VA 22032
|
2,103 sq. feet
|
2 baths 4 beds |
show details |
| Photo | Address | Area | Beds / Baths | Price | Details |
|---|---|---|---|---|---|

|
#31
Sunrise Valley Dr
Reston, VA 20191
|
980 sq. feet
|
2 baths 2 beds |
show details | |

|
#32
Sargent Rd NE
Washington, DC 20017
|
1,360 sq. feet
|
2 baths 3 beds |
show details | |

|
#33
Winthrop St
Oxon Hill, MD 20745
|
1,020 sq. feet
|
1 baths 3 beds |
show details | |

|
#34
Barnaby St SE
Washington, DC 20032
|
2,092 sq. feet
|
2 baths 4 beds |
show details | |

|
#35
Kincheloe Rd
Clifton, VA 20124
|
4,492 sq. feet
|
4 baths 5 beds |
show details | |

|
#36
Blacksmith Sq
Ashburn, VA 20147
|
1,377 sq. feet
|
3 baths 3 beds |
show details | |

|
#37
S George Mason Dr Unit 918n
Falls Church, VA 22041
|
752 sq. feet
|
1 baths 1 beds |
show details | |

|
#38
Carolyn Forest Dr
Woodbridge, VA 22192
|
1,593 sq. feet
|
2 baths 2 beds |
show details | |

|
#39
Wedgedale Dr
Sterling, VA 20164
|
1,540 sq. feet
|
2 baths 4 beds |
show details | |

|
#40
T Pl SE
Washington, DC 20020
|
900 sq. feet
|
2 baths 2 beds |
show details |
| Photo | Address | Area | Beds / Baths | Price | Details |
|---|---|---|---|---|---|

|
#41
Oklahoma Ave NE Apt 203
Washington, DC 20002
|
- sq. feet
|
1 baths 1 beds |
show details | |

|
#42
Stonepath Cir
Centreville, VA 20120
|
1,452 sq. feet
|
3 baths 4 beds |
show details | |

|
#43
Connecticut Ave NW Apt 606
Washington, DC 20008
|
160 sq. feet
|
1 baths 1 beds |
show details | |

|
#44
Saddlehorn Ct
Burke, VA 22015
|
1,138 sq. feet
|
2 baths 3 beds |
show details | |

|
#45
Lakewood Dr
Woodbridge, VA 22192
|
2,038 sq. feet
|
2 baths 4 beds |
show details | |

|
#46
1918 M Street NE
Washington, DC 20002
|
5,487 sq. feet
|
12 baths 18 beds |
show details | |

|
#47
Eaton Woods Pl
Lorton, VA 22079
|
1,448 sq. feet
|
2 baths 3 beds |
show details | |

|
#48
Newtowne Ct
Lorton, VA 22079
|
- sq. feet
|
2 baths 4 beds |
show details | |

|
#49
Kalmia Rd NW
Washington, DC 20012
|
2,382 sq. feet
|
4 baths 4 beds |
show details | |

|
Check over 1 million property listings on Foreclosure.com!
|
browse all offers | |||


- 10,42363.9%White alone
- 2,18813.4%Asian alone
- 1,3968.6%Hispanic
- 1,1176.9%Two or more races
- 8505.2%Black alone
- 1320.8%Other race alone
- 1150.7%American Indian alone
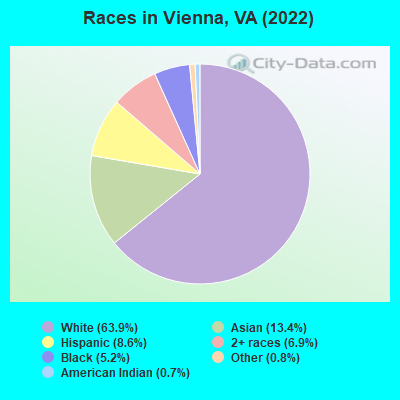
Races in Vienna detailed stats: ancestries, foreign born residents, place of birth
According to our research of Virginia and other state lists, there were 23 registered sex offenders living in Vienna, Virginia as of April 27, 2024.
The ratio of all residents to sex offenders in Vienna is 716 to 1.
The ratio of registered sex offenders to all residents in this city is lower than the state average.
Type |
2009 |
2010 |
2011 |
2012 |
2013 |
2014 |
2015 |
2016 |
2017 |
2018 |
2019 |
2020 |
2021 |
2022 |
|---|---|---|---|---|---|---|---|---|---|---|---|---|---|---|
| Murders (per 100,000) | 2 (13.4) | 0 (0.0) | 0 (0.0) | 0 (0.0) | 0 (0.0) | 0 (0.0) | 0 (0.0) | 0 (0.0) | 1 (6.0) | 0 (0.0) | 0 (0.0) | 0 (0.0) | 0 (0.0) | 0 (0.0) |
| Rapes (per 100,000) | 0 (0.0) | 1 (6.4) | 1 (6.3) | 1 (6.2) | 0 (0.0) | 0 (0.0) | 2 (12.0) | 5 (30.0) | 2 (12.1) | 3 (18.0) | 1 (6.0) | 3 (18.1) | 2 (12.0) | 3 (18.5) |
| Robberies (per 100,000) | 4 (26.8) | 9 (57.4) | 8 (50.4) | 3 (18.6) | 2 (12.2) | 0 (0.0) | 3 (18.0) | 0 (0.0) | 1 (6.0) | 2 (12.0) | 5 (30.0) | 3 (18.1) | 2 (12.0) | 2 (12.4) |
| Assaults (per 100,000) | 4 (26.8) | 17 (108.4) | 8 (50.4) | 2 (12.4) | 7 (42.9) | 8 (48.4) | 5 (30.0) | 2 (12.0) | 0 (0.0) | 4 (24.0) | 15 (90.0) | 4 (24.1) | 6 (36.1) | 4 (24.7) |
| Burglaries (per 100,000) | 27 (180.7) | 35 (223.1) | 9 (56.7) | 30 (185.9) | 29 (177.5) | 14 (84.7) | 14 (84.1) | 15 (89.9) | 10 (60.3) | 15 (90.0) | 2 (12.0) | 7 (42.2) | 8 (48.2) | 5 (30.9) |
| Thefts (per 100,000) | 269 (1,800) | 227 (1,447) | 181 (1,140) | 151 (935.6) | 178 (1,090) | 146 (883.4) | 133 (799.3) | 149 (893.3) | 121 (729.4) | 125 (750.3) | 157 (942.4) | 180 (1,086) | 105 (632.6) | 153 (944.8) |
| Auto thefts (per 100,000) | 7 (46.8) | 14 (89.2) | 5 (31.5) | 5 (31.0) | 3 (18.4) | 4 (24.2) | 4 (24.0) | 9 (54.0) | 3 (18.1) | 9 (54.0) | 7 (42.0) | 29 (175.0) | 7 (42.2) | 9 (55.6) |
| Arson (per 100,000) | 0 (0.0) | 1 (6.4) | 1 (6.3) | 0 (0.0) | 0 (0.0) | 0 (0.0) | 1 (6.0) | 1 (6.0) | 1 (6.0) | 0 (0.0) | 0 (0.0) | 0 (0.0) | 0 (0.0) | 0 (0.0) |
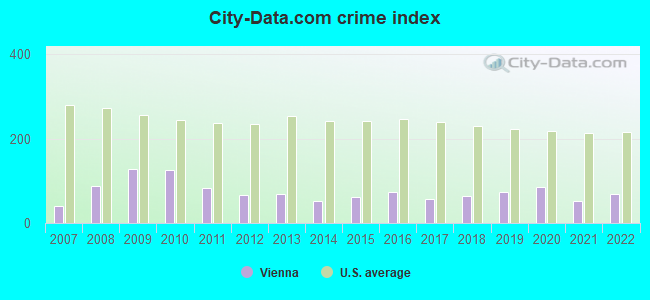
| City-Data.com crime index | 128.5 | 124.6 | 82.3 | 65.9 | 69.7 | 52.9 | 60.8 | 72.7 | 58.3 | 63.4 | 73.7 | 85.2 | 52.5 | 67.9 |
The City-Data.com crime index weighs serious crimes and violent crimes more heavily. Higher means more crime, U.S. average is 246.1. It adjusts for the number of visitors and daily workers commuting into cities.
Crime rate in Vienna detailed stats: murders, rapes, robberies, assaults, burglaries, thefts, arson
Full-time law enforcement employees in 2021, including police officers: 49 (39 officers - 34 male; 5 female).
| Officers per 1,000 residents here: | 2.35 |
| Virginia average: | 2.24 |
 Recent articles from our blog. Our writers, many of them Ph.D. graduates or candidates, create easy-to-read articles on a wide variety of topics.

 | Slug Lines At Vienna Metro (0 replies) |
| Things to do in Vienna? (18 replies) |
| Fair Lakes Shuttle to Vienna Metro? (1 reply) |
| Brainstorming ---- wanting to move from Sterling to Vienna/tysons/wolf trap (4 replies) |
| Vienna vs. Falls Church (20 replies) |
| New to Vienna (12 replies) |
Latest news from Vienna, VA collected exclusively by city-data.com from local newspapers, TV, and radio stations
Ancestries: European (7.1%), English (6.8%), American (5.7%), Irish (5.7%), German (5.6%), Iranian (3.5%).
Current Local Time: EST time zone
Incorporated in 1890
Elevation: 430 feet
Land area: 4.44 square miles.
Population density: 3,664 people per square mile (average).
3,655 residents are foreign born (12.6% Asia, 4.0% Europe, 2.8% Africa, 2.2% Latin America).
| This town: | 22.4% |
| Virginia: | 12.6% |
Median real estate property taxes paid for housing units with mortgages in 2022: $10,018 (1.0%)
Median real estate property taxes paid for housing units with no mortgage in 2022: $9,832 (1.1%)
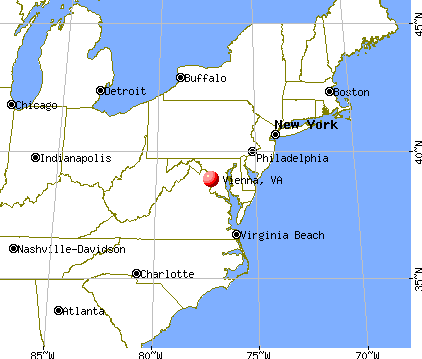
Nearest city with pop. 50,000+: Annandale, VA  (5.2 miles , pop. 54,994).
Nearest city with pop. 200,000+: Washington, DC (13.4 miles , pop. 572,059).
Nearest city with pop. 1,000,000+: Philadelphia, PA (136.2 miles , pop. 1,517,550).
Nearest cities:
), ), ), ), ), )Latitude: 38.90 N, Longitude: 77.26 W
Daytime population change due to commuting: +5,410 (+33.2%)
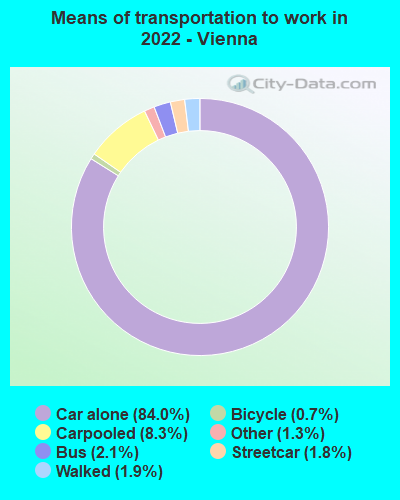
Workers who live and work in this town: 3,577 (43.0%)
Property values in Vienna, VA
Vienna tourist attractions:
Vienna, Virginia accommodation & food services, waste management - Economy and Business Data
| Here: | 2.3% |
| Virginia: | 2.7% |
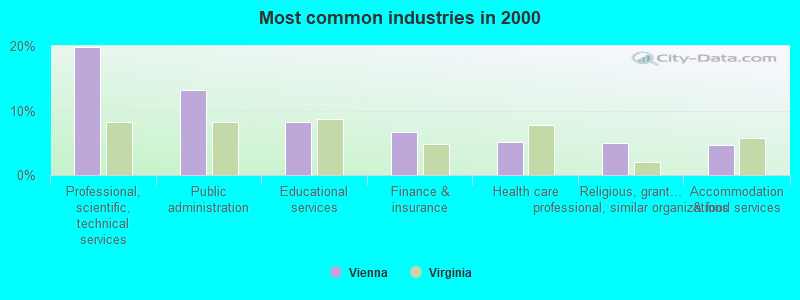
- Professional, scientific, technical services (19.9%)
- Public administration (13.2%)
- Educational services (8.2%)
- Finance & insurance (6.7%)
- Health care (5.1%)
- Religious, grantmaking, civic, professional, similar organizations (4.9%)
- Accommodation & food services (4.6%)
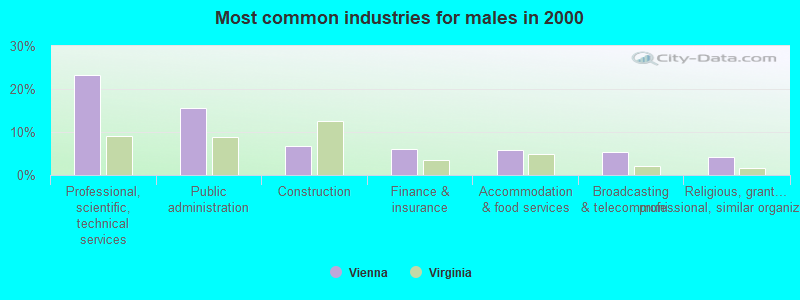
- Professional, scientific, technical services (23.3%)
- Public administration (15.5%)
- Construction (6.7%)
- Finance & insurance (6.0%)
- Accommodation & food services (5.7%)
- Broadcasting & telecommunications (5.2%)
- Religious, grantmaking, civic, professional, similar organizations (4.2%)
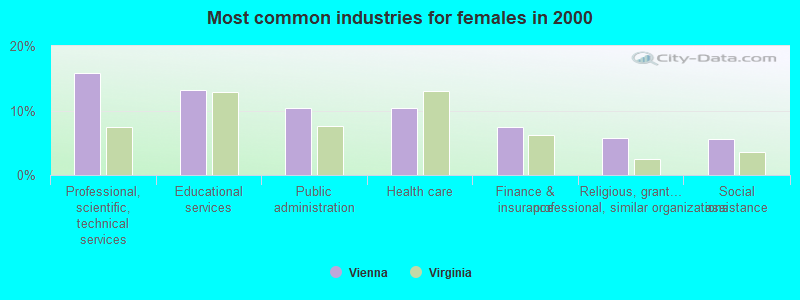
- Professional, scientific, technical services (15.8%)
- Educational services (13.2%)
- Public administration (10.4%)
- Health care (10.3%)
- Finance & insurance (7.4%)
- Religious, grantmaking, civic, professional, similar organizations (5.8%)
- Social assistance (5.6%)
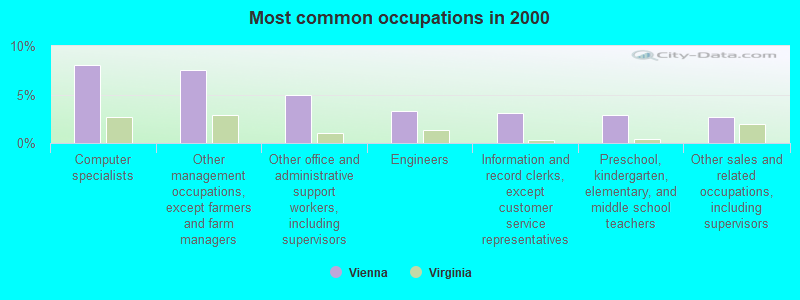
- Computer specialists (8.1%)
- Other management occupations, except farmers and farm managers (7.5%)
- Other office and administrative support workers, including supervisors (4.9%)
- Engineers (3.3%)
- Information and record clerks, except customer service representatives (3.0%)
- Preschool, kindergarten, elementary, and middle school teachers (2.9%)
- Other sales and related occupations, including supervisors (2.7%)
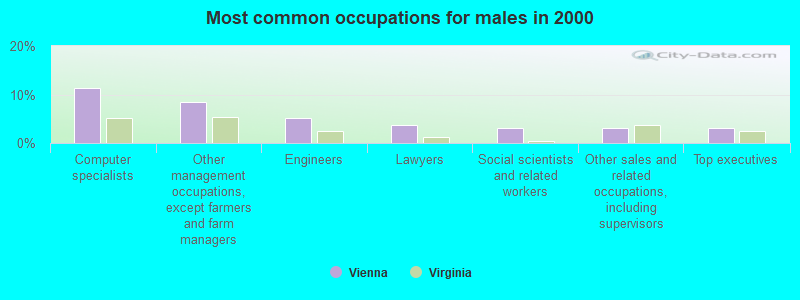
- Computer specialists (11.3%)
- Other management occupations, except farmers and farm managers (8.4%)
- Engineers (5.2%)
- Lawyers (3.6%)
- Social scientists and related workers (3.1%)
- Other sales and related occupations, including supervisors (3.1%)
- Top executives (3.1%)
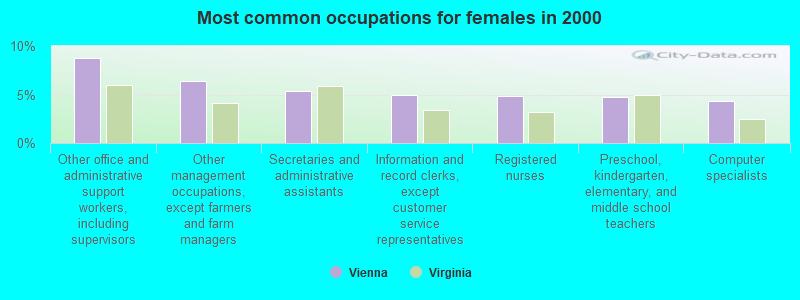
- Other office and administrative support workers, including supervisors (8.7%)
- Other management occupations, except farmers and farm managers (6.4%)
- Secretaries and administrative assistants (5.4%)
- Information and record clerks, except customer service representatives (5.0%)
- Registered nurses (4.8%)
- Preschool, kindergarten, elementary, and middle school teachers (4.8%)
- Computer specialists (4.3%)
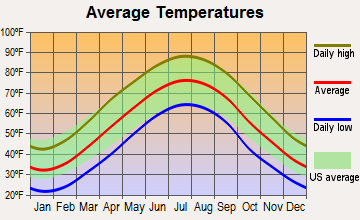
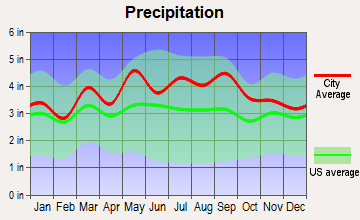
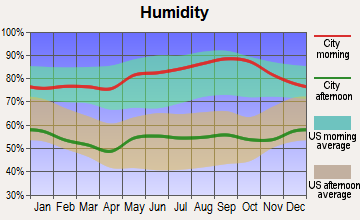
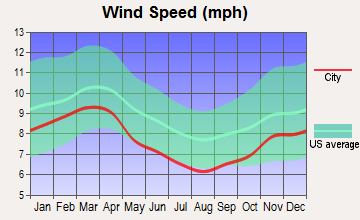
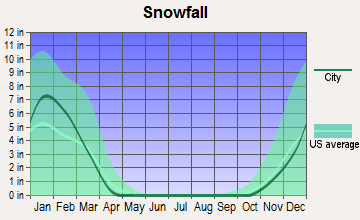
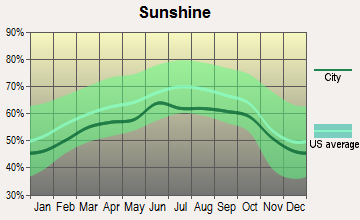
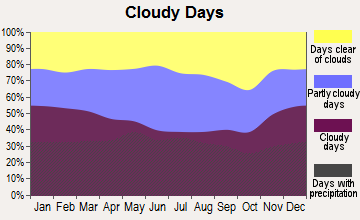
Average climate in Vienna, Virginia
Based on data reported by over 4,000 weather stations
|
|

(lower is better)
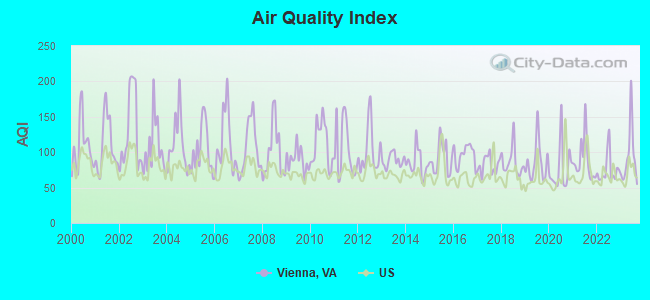
Air Quality Index (AQI) level in 2023 was 93.5. This is worse than average.
| City: | 93.5 |
| U.S.: | 72.6 |
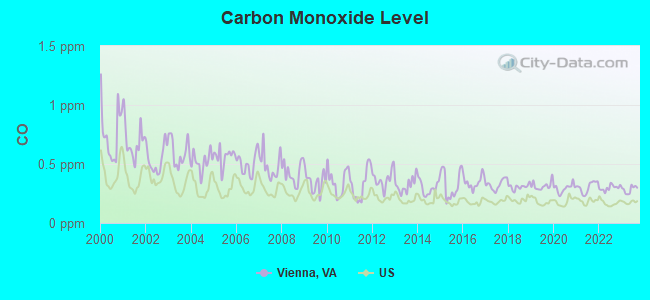
Carbon Monoxide (CO) [ppm] level in 2023 was 0.284. This is about average. Closest monitor was 4.1 miles away from the city center.
| City: | 0.284 |
| U.S.: | 0.251 |
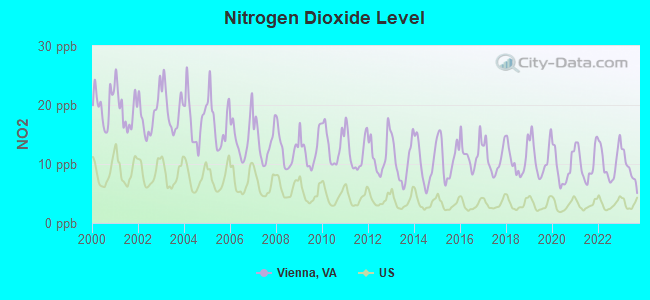
Nitrogen Dioxide (NO2) [ppb] level in 2023 was 9.13. This is significantly worse than average. Closest monitor was 0.6 miles away from the city center.
| City: | 9.13 |
| U.S.: | 5.11 |
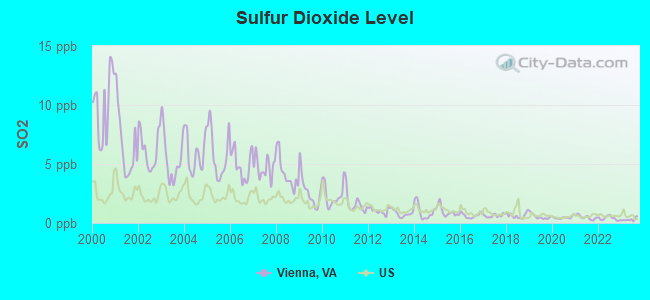
Sulfur Dioxide (SO2) [ppb] level in 2023 was 0.303. This is significantly better than average. Closest monitor was 0.6 miles away from the city center.
| City: | 0.303 |
| U.S.: | 1.515 |
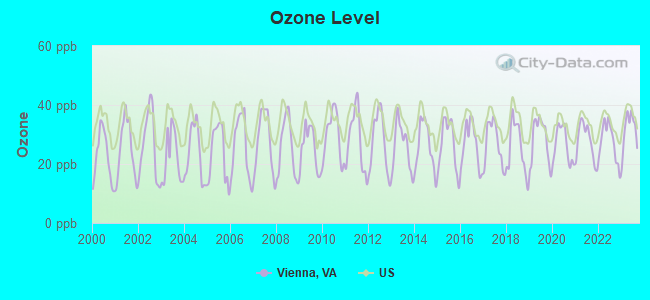
Ozone [ppb] level in 2023 was 31.5. This is about average. Closest monitor was 4.1 miles away from the city center.
| City: | 31.5 |
| U.S.: | 33.3 |
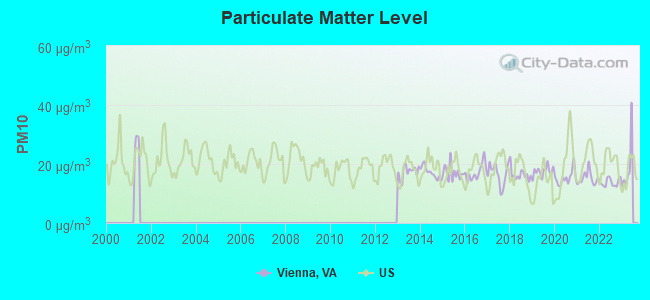
Particulate Matter (PM10) [µg/m3] level in 2022 was 13.8. This is better than average. Closest monitor was 3.6 miles away from the city center.
| City: | 13.8 |
| U.S.: | 19.2 |
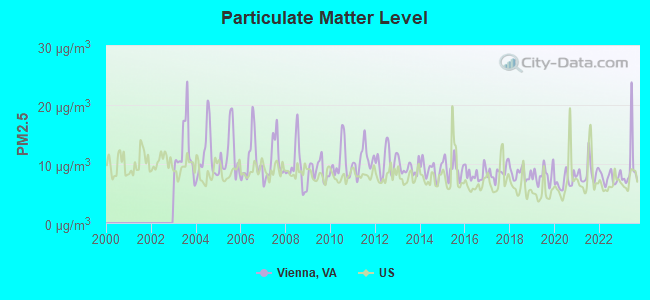
Particulate Matter (PM2.5) [µg/m3] level in 2023 was 9.54. This is about average. Closest monitor was 4.1 miles away from the city center.
| City: | 9.54 |
| U.S.: | 8.11 |
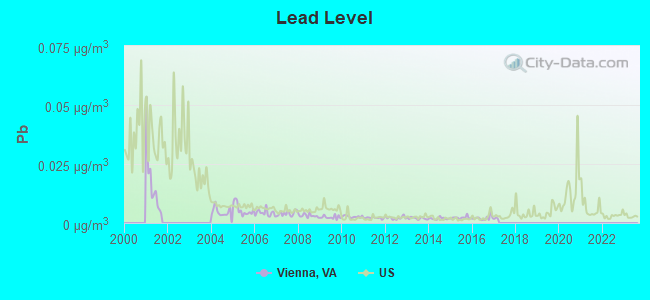
Lead (Pb) [µg/m3] level in 2016 was 0.00212. This is significantly better than average. Closest monitor was 3.1 miles away from the city center.
| City: | 0.00212 |
| U.S.: | 0.00931 |
Tornado activity:
Vienna-area historical tornado activity is above Virginia state average. It is 9% greater than the overall U.S. average.
On 4/28/2002, a category F4 (max. wind speeds 207-260 mph) tornado 24.5 miles away from the Vienna town center killed 3 people and injured 122 people and caused $124 million in damages.
On 4/1/1973, a category F3 (max. wind speeds 158-206 mph) tornado 5.3 miles away from the town center injured 37 people and caused between $5,000,000 and $50,000,000 in damages.
Earthquake activity:
Vienna-area historical earthquake activity is significantly above Virginia state average. It is 56% smaller than the overall U.S. average.On 8/23/2011 at 17:51:04, a magnitude 5.8 (5.8 MW, Depth: 3.7 mi, Class: Moderate, Intensity: VI - VII) earthquake occurred 77.6 miles away from the city center
On 8/25/2011 at 05:07:52, a magnitude 4.5 (4.5 ML, Depth: 4.2 mi, Class: Light, Intensity: IV - V) earthquake occurred 76.2 miles away from the city center
On 12/9/2003 at 20:59:18, a magnitude 4.5 (4.5 ML, Depth: 6.2 mi) earthquake occurred 90.2 miles away from the city center
On 12/9/2003 at 20:59:14, a magnitude 4.5 (4.5 MB, 4.5 LG) earthquake occurred 97.2 miles away from Vienna center
On 1/16/1994 at 01:49:16, a magnitude 4.6 (4.6 MB, 4.6 LG, Depth: 3.1 mi) earthquake occurred 118.5 miles away from the city center
On 9/25/1998 at 19:52:52, a magnitude 5.2 (4.8 MB, 4.3 MS, 5.2 LG, 4.5 MW, Depth: 3.1 mi) earthquake occurred 244.1 miles away from the city center
Magnitude types: regional Lg-wave magnitude (LG), body-wave magnitude (MB), local magnitude (ML), surface-wave magnitude (MS), moment magnitude (MW)
Natural disasters:
The number of natural disasters in Fairfax County (15) is near the US average (15).Major Disasters (Presidential) Declared: 12
Emergencies Declared: 3
Causes of natural disasters: Winter Storms: 5, Hurricanes: 4, Snowstorms: 3, Storms: 2, Tropical Storms: 2, Blizzard: 1, Flood: 1, Tornado: 1, Wind: 1, Other: 1 (Note: some incidents may be assigned to more than one category).

Main business address for: CONVERA CORP (SERVICES-PREPACKAGED SOFTWARE), CEL SCI CORP (BIOLOGICAL PRODUCTS (NO DIAGNOSTIC SUBSTANCES)), ALLIED DEFENSE GROUP INC (ORDNANCE & ACCESSORIES, (NO VEHICLES/GUIDED MISSILES)).
Hospitals and medical centers in Vienna:
- EVERCARE HOSPICE (8245 BOONE BOULEVARD, SUITE 400)
- HOSPICE OF AMERICAN HEALTH CARE (120 BEULAH ROAD SUITE 201)
- HOUSECALL HOSPICE (8206 LEESBURG PIKE)
- MINERVA FISHER HALL GROUP HOME (8207 WOLFTRAP RD)
- ODYSSEY HEALTHCARE OF ARLINGTON (8381 OLD COURTHOUSE RD SUITE 100)
- DAVITA - TYSONS CORNER (8391 OLD COURTHOUSE RD)
- ADVENTIST HOME HEALTH SERVICES INC (8233 OLD COURTHOUSE ROAD SUITE 160)
- AMERICAN HEALTH CARE PROFESSIONALS (8500 LEESBURG PIKE, SUITE 202)
- HOUSECALL HOME HEALTHCARE (8206 LEESBURG PIKE #201)
Heliports located in Vienna:
Amtrak stations near Vienna:
- 11 miles: DULLES INTERNATIONAL AP'T (HERNDON, DULLES INTERNATIONAL AIRPORT) - Bus Station . Services: enclosed waiting area, public restrooms, public payphones, full-service food facilities, paid short-term parking, paid long-term parking, car rental agency, taxi stand, public transit connection.
- 13 miles: ALEXANDRIA (110 CALLAHAN DR.) . Services: ticket office, partially wheelchair accessible, enclosed waiting area, public restrooms, public payphones, vending machines, ATM, free short-term parking, free long-term parking, call for car rental service, call for taxi service, public transit connection.
- 14 miles: LORTON (AUTO-TRAIN) (LORTON, 8006 LORTON RD.) . Services: ticket office, fully wheelchair accessible, enclosed waiting area, public restrooms, public payphones, vending machines, free short-term parking, call for taxi service.
Colleges/Universities in Vienna:
- Everest College-McLean (Full-time enrollment: 382; Location: 8620 Westwood Center Dr.; Private, for-profit; Website: www.everest.edu/campus/tysons_corner)
- University of the Potomac-VA Campus (Full-time enrollment: 19; Location: 2070 Chain Bridge Road; Private, for-profit; Website: www.potomac.edu/; Offers Master's degree)
Colleges/universities with over 2000 students nearest to Vienna:
- Stratford University (about 4 miles; Fairfax, VA; Full-time enrollment: 2,570)
- Northern Virginia Community College (about 5 miles; Annandale, VA; FT enrollment: 35,721)
- Medtech Institute (about 6 miles; Falls Church, VA; FT enrollment: 2,900)
- George Mason University (about 6 miles; Fairfax, VA; FT enrollment: 26,002)
- Marymount University (about 8 miles; Arlington, VA; FT enrollment: 3,361)
- Strayer University-Virginia (about 10 miles; Arlington, VA; FT enrollment: 7,005)
- American University (about 10 miles; Washington, DC; FT enrollment: 9,850)
Public high schools in Vienna:
- OAKTON HIGH (Students: 2,382, Location: 2900 SUTTON RD, Grades: 9-12)
- MADISON HIGH (Students: 1,944, Location: 2500 JAMES MADISON DR, Grades: 9-12)
- KILMER CENTER (Students: 78, Location: 8102 WOLFTRAP RD, Grades: PK-12)
Private high school in Vienna:
Biggest public elementary/middle schools in Vienna:
- KILMER MIDDLE (Students: 1,068, Location: 8100 WOLFTRAP RD, Grades: 7-8)
- COLVIN RUN ELEM (Students: 853, Location: 1400 TRAP RD., Grades: PK-6)
- THOREAU MIDDLE (Students: 777, Location: 2505 CEDAR LN, Grades: 7-8)
- FLINT HILL ELEM (Students: 679, Location: 2444 FLINT HILL RD, Grades: PK-6)
- WOLFTRAP ELEM (Students: 634, Location: 1903 BEULAH RD, Grades: PK-6)
- MARSHALL ROAD ELEM (Students: 533, Location: 730 MARSHALL RD SW, Grades: PK-6)
- FREEDOM HILL ELEM (Students: 532, Location: 1945 LORD FAIRFAX RD, Grades: PK-6)
- STENWOOD ELEM (Students: 462, Location: 2620 GALLOWS RD, Grades: PK-6)
- WESTBRIAR ELEM (Students: 442, Location: 1741 PINE VALLEY DR, Grades: PK-6)
- CUNNINGHAM PARK ELEM (Students: 402, Location: 1001 PARK ST SE, Grades: PK-6)
Private elementary/middle schools in Vienna:
- OUR LADY OF GOOD COUNSEL SCHOOL (Students: 453, Location: 8601 WOLFTRAP RD, Grades: KG-8)
- ST MARK CATHOLIC SCHOOL (Students: 406, Location: 9970 VALE RD, Grades: UG-8)
- GREEN HEDGES SCHOOL (Students: 163, Location: 415 WINDOVER AVE NW, Grades: PK-8)
- CHESTERBROOK ACADEMY #1160 (Students: 85, Location: 9525 LEESBURG PIKE, Grades: UG-2)
- VIENNA ADVENTIST ACADEMY (Students: 77, Location: 340 COURTHOUSE RD SW, Grades: PK-8)
User-submitted facts and corrections:
- Private high school in Vienna: Private primary/middle school in Vienna CHRISTIAN ASSEMBLY ACADEMY (Students: 84; Location: 8200 Bell Lane; Grades: KG - 8; Website: www.christianassemblyacademy.net)
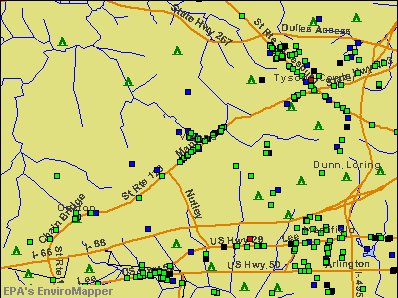
Points of interest:
Notable locations in Vienna: Vienna Technology Park (A), Westwood Country Club (B), Patrick Henry Library (C), Vienna Town Hall (D), Fairfax County Fire and Rescue Department Station 2 Vienna (E), Vienna Police Station (F), Freeman House Historic Site (G). Display/hide their locations on the map
Shopping Centers: Danor Plaza Shopping Center (1), Glyndon Shopping Center (2), Maple Shopping Center (3), Vienna Plaza Shopping Center (4), Vienna Shopping Center (5), Village Green Shopping Center (6), Wolftrappe Shopping Center (7), Cedar Lane Shopping Center (8), Cedar Lane Shopping Center (9). Display/hide their locations on the map
Churches in Vienna include: Vienna Assembly of God Church (A), New Union Baptist Church (B), Vienna Baptist Church (C), Church of the Nazarene (D), Holy Comforter Church (E), Epiphany United Methodist Church (F), Faith Baptist Church (G), First Baptist Church (H), The United Church of Christ (I). Display/hide their locations on the map
Cemetery: Moorefield Cemetery (1). Display/hide its location on the map
Parks in Vienna include: Nottoway Park (1), Town Park (2), Southside Park (3), Northside Park (4), Meadow Lane Park (5), Glyndon Park (6), Cunningham Park (7). Display/hide their locations on the map
Tourist attractions: Freeman Store & Museum (131 Church Street Northwest), Information Systems Consultants Inc (Museums; 311 Maple Avenue West Suite D), Historic Vienna Inc (Museums; 131 Church Street Northwest), Advance Auto Parts (Cultural Attractions- Events- & Facilities; 311 Maple Avenue West Suite B), Fairfax County - Libraries- Regional Libraries- Community Libraries- Patrick H (Cultural Attractions- Events- & Facilities; 101 Maple Avenue East), ABC Travel Service (8027 Leesburg Pike), Space Prefect India Pvt. Ltd. (Recreational Trips & Guides; 9316 Kilby Glen Drive), Atlantic Sun Llc (Tours & Charters; 8056 Yarmouth Forest Pl), All Around Express (Tours & Charters; 386 Maple Avenue E Suite 112).
Hotels: Comfort Inn (1587 Spring Hill Rd), Embassy Suites Hotel (8517 Leesburg Pike), Embassy Suites Tysons Corner (8517 Leesburg Pike), Holiday Inn Dulles International Airport (1000 Sudly Road), Chantilly's Restaurant (1000 Sully Road), District of Columbia (1000 Sully Road), Comfort Inn Tysons Corner (1587 Spring Hill Road), Embassy Suites Hotel Tyson Corner (8517 Leeburg Pike), Homestead Guest Studios (8201 Old Courthouse Road).
Birthplace of: Alex Albrecht - Television personality, Michael McCrary - Football player, Sandra Beasley - Poet, Dave Aschwege - Baseball umpire, Mike Orfini - College basketball player (Stony Brook Seawolves).
| This town: | 2.8 people |
| Virginia: | 2.5 people |
| This town: | 76.2% |
| Whole state: | 67.0% |
| This town: | 3.1% |
| Whole state: | 5.7% |
Likely homosexual households (counted as self-reported same-sex unmarried-partner households)
- Lesbian couples: 0.3% of all households
- Gay men: 0.3% of all households
10 people in nursing homes in 2000
Banks with most branches in Vienna (2011 data):
- Branch Banking and Trust Company: Tysons Courthouse Branch, Vienna East Branch, Vienna West Branch, Pike Seven Plaza Branch, Cedar Park Branch. Info updated 2010/03/29: Bank assets: $168,867.6 mil, Deposits: $127,549.5 mil, headquarters in Winston Salem, NC, positive income, Commercial Lending Specialization, 1793 total offices, Holding Company: Bb&T Corporation
- Manufacturers and Traders Trust Company: Vienna Branch at 527 Maple Avenue East, branch established on 1995/03/27; Gallows Road Branch at 1960 Gallows Road, branch established on 2007/12/08. Info updated 2011/08/08: Bank assets: $76,887.1 mil, Deposits: $60,064.2 mil, headquarters in Buffalo, NY, positive income, Commercial Lending Specialization, 808 total offices, Holding Company: M&T Bank Corporation
- United Bank: Tysons Branch at 2071 Chain Bridge Road, branch established on 1995/08/30; Vienna Branch at 226 Maple Avenue West, branch established on 1991/11/26. Info updated 2007/08/13: Bank assets: $3,634.1 mil, Deposits: $2,729.4 mil, headquarters in Fairfax, VA, positive income, Commercial Lending Specialization, 57 total offices, Holding Company: United Bankshares, Inc.
- PNC Bank, National Association: Tysons Corner Branch at 8150 Leesburg Pike, branch established on 1997/08/04; Vienna Branch at 353 Maple Avenue East, branch established on 1989/09/18. Info updated 2012/03/20: Bank assets: $263,309.6 mil, Deposits: $197,343.0 mil, headquarters in Wilmington, DE, positive income, Commercial Lending Specialization, 3085 total offices, Holding Company: Pnc Financial Services Group, Inc., The
- TD Bank, National Association: Vienna Branch at 308 Maple Avenue East, branch established on 2006/12/19; Tyson Corner Branch at 2070 Chain Bridge Road, branch established on 2006/05/12. Info updated 2010/10/04: Bank assets: $188,912.6 mil, Deposits: $153,149.8 mil, headquarters in Wilmington, DE, positive income, 1314 total offices, Holding Company: Toronto-Dominion Bank, The
- Bank of America, National Association: Tysons Corner Branch at 1934 Old Gallows Road, branch established on 1962/02/23; Vienna Branch at 235 Maple Avenue West, branch established on 1966/04/28. Info updated 2009/11/18: Bank assets: $1,451,969.3 mil, Deposits: $1,077,176.8 mil, headquarters in Charlotte, NC, positive income, 5782 total offices, Holding Company: Bank Of America Corporation
- SunTrust Bank: Vienna Branch at 515 Maple Avenue East, branch established on 1864/01/01; West Vienna Branch at 501 Maple Avenue West, branch established on 1990/07/31. Info updated 2010/05/27: Bank assets: $171,291.7 mil, Deposits: $129,833.2 mil, headquarters in Atlanta, GA, positive income, Commercial Lending Specialization, 1716 total offices, Holding Company: Suntrust Banks, Inc.
- Beal Bank, SSB: Dc / Virginia Branch at 8130 Boone Blvd Suite 115, branch established on 2009/08/24. Info updated 2011/10/26: Bank assets: $3,750.0 mil, Deposits: $2,445.6 mil, headquarters in Plano, TX, positive income, Mortgage Lending Specialization, 38 total offices
- Burke & Herbert Bank & Trust Company: West Maple Branch at 302 Maple Ave West, branch established on 2008/11/29. Info updated 2010/05/12: Bank assets: $2,461.7 mil, Deposits: $2,022.3 mil, headquarters in Alexandria, VA, positive income, Commercial Lending Specialization, 25 total offices
- 14 other banks with 14 local branches
For population 15 years and over in Vienna:
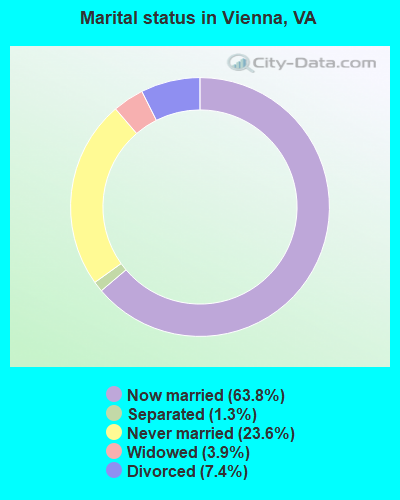
- Never married: 23.6%
- Now married: 63.8%
- Separated: 1.3%
- Widowed: 3.9%
- Divorced: 7.4%
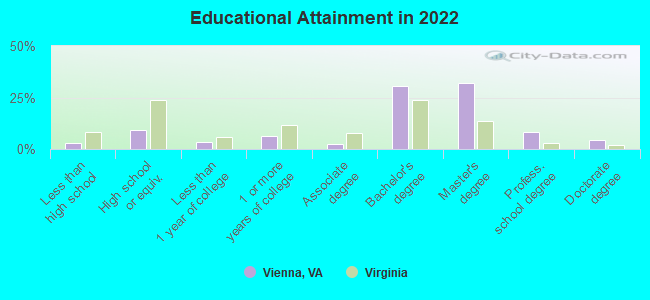
For population 25 years and over in Vienna:
- High school or higher: 96.9%
- Bachelor's degree or higher: 74.1%
- Graduate or professional degree: 43.5%
- Unemployed: 2.5%
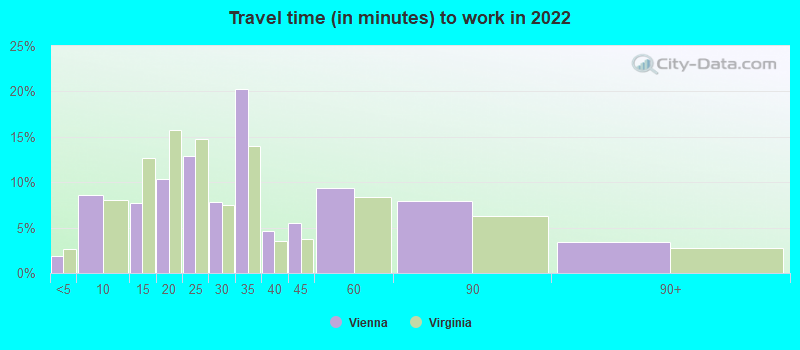
- Mean travel time to work (commute): 17.5 minutes
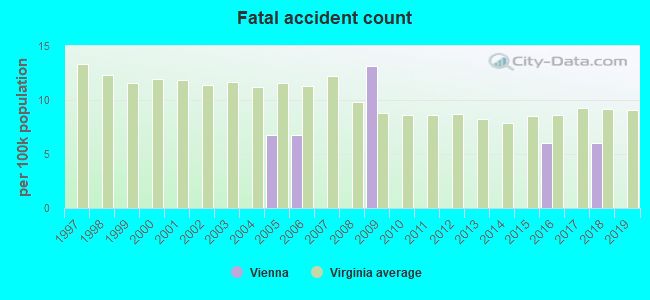
| Here: | 10.0 |
| Virginia average: | 12.1 |
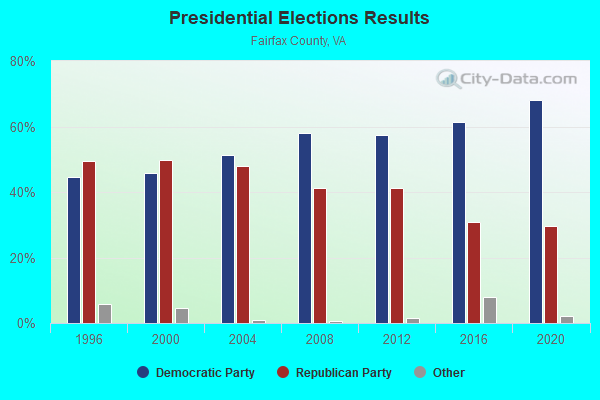
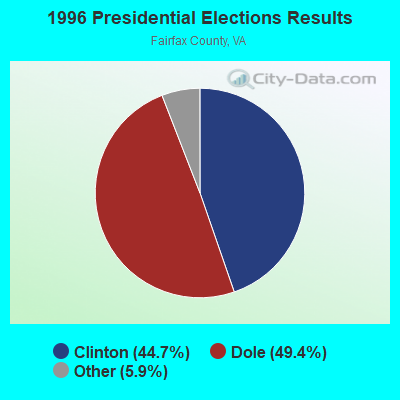
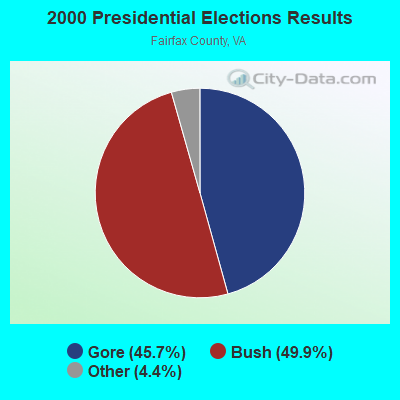
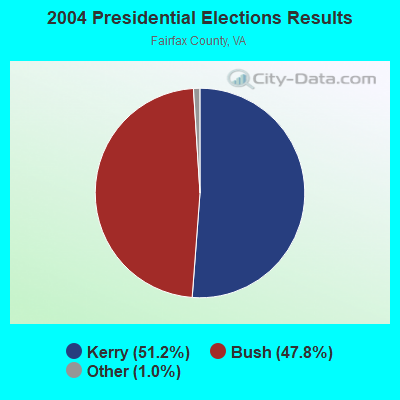
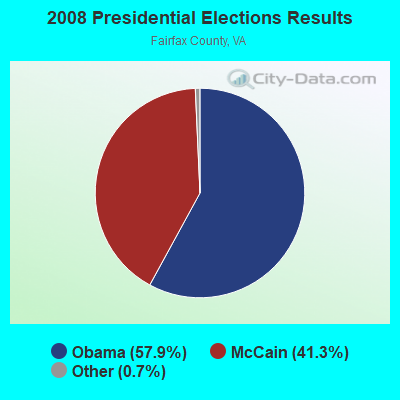
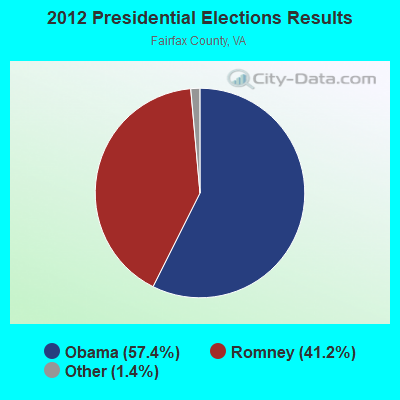


Graphs represent county-level data. Detailed 2008 Election Results
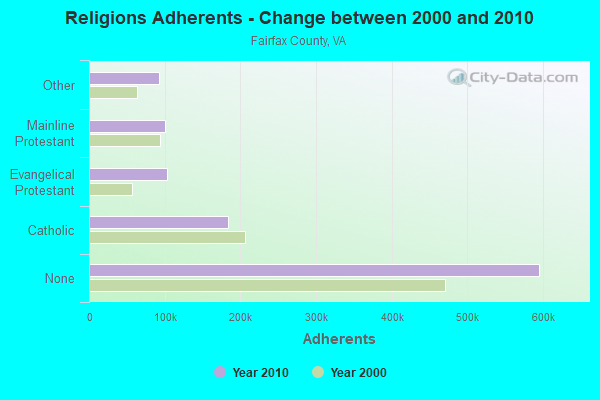
Religion statistics for Vienna, VA (based on Fairfax County data)
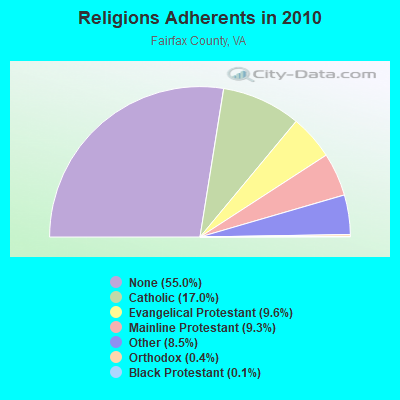
| Religion | Adherents | Congregations |
|---|---|---|
| Catholic | 184,183 | 29 |
| Evangelical Protestant | 103,522 | 316 |
| Mainline Protestant | 100,525 | 146 |
| Other | 91,925 | 119 |
| Orthodox | 4,694 | 8 |
| Black Protestant | 1,509 | 9 |
| None | 595,368 | - |
Food Environment Statistics:
| Fairfax County: | 1.81 / 10,000 pop. |
| State: | 2.03 / 10,000 pop. |
| Fairfax County: | 0.03 / 10,000 pop. |
| Virginia: | 0.17 / 10,000 pop. |
| Fairfax County: | 1.29 / 10,000 pop. |
| Virginia: | 1.43 / 10,000 pop. |
| Here: | 1.62 / 10,000 pop. |
| State: | 4.03 / 10,000 pop. |
| Here: | 6.90 / 10,000 pop. |
| State: | 7.65 / 10,000 pop. |
| Fairfax County: | 7.2% |
| State: | 9.3% |
| Fairfax County: | 22.2% |
| Virginia: | 26.7% |
| Fairfax County: | 27.6% |
| State: | 18.6% |
Health and Nutrition:
| Vienna: | 54.3% |
| Virginia: | 50.6% |
| This city: | 52.8% |
| State: | 48.6% |
| Vienna: | 28.0 |
| Virginia: | 28.6 |
| Vienna: | 18.8% |
| Virginia: | 20.2% |
| Vienna: | 9.9% |
| Virginia: | 10.5% |
| Vienna: | 6.9 |
| Virginia: | 6.8 |
| Here: | 33.7% |
| Virginia: | 33.5% |
| This city: | 59.8% |
| Virginia: | 57.4% |
| Vienna: | 80.2% |
| State: | 80.5% |
More about Health and Nutrition of Vienna, VA Residents
| Local government employment and payroll (March 2022) | |||||
| Function | Full-time employees | Monthly full-time payroll | Average yearly full-time wage | Part-time employees | Monthly part-time payroll |
|---|---|---|---|---|---|
| Police Protection - Officers | 36 | $291,292 | $97,097 | 0 | $0 |
| Parks and Recreation | 23 | $146,528 | $76,449 | 24 | $30,759 |
| Other Government Administration | 21 | $182,048 | $104,027 | 51 | $14,835 |
| Other and Unallocable | 20 | $145,171 | $87,103 | 0 | $0 |
| Financial Administration | 16 | $123,198 | $92,399 | 3 | $12,646 |
| Solid Waste Management | 16 | $81,902 | $61,427 | 0 | $0 |
| Streets and Highways | 13 | $72,959 | $67,347 | 0 | $0 |
| Police - Other | 10 | $63,311 | $75,973 | 0 | $0 |
| Sewerage | 9 | $57,943 | $77,257 | 0 | $0 |
| Water Supply | 8 | $60,685 | $91,028 | 0 | $0 |
| Totals for Government | 172 | $1,225,036 | $85,468 | 78 | $58,240 |
Vienna government finances - Expenditure in 2021 (per resident):
- Construction - Regular Highways: $1,697,000 ($104.26)
Parks and Recreation: $1,517,000 ($93.20)
General Public Buildings: $1,146,000 ($70.41)
General - Other: $648,000 ($39.81)
Sewerage: $518,000 ($31.83)
Water Utilities: $501,000 ($30.78)
- Current Operations - Police Protection: $8,296,000 ($509.71)
Financial Administration: $4,858,000 ($298.48)
Water Utilities: $3,975,000 ($244.22)
Parks and Recreation: $3,647,000 ($224.07)
Sewerage: $3,300,000 ($202.75)
General Public Buildings: $3,262,000 ($200.42)
Regular Highways: $2,950,000 ($181.25)
Solid Waste Management: $2,029,000 ($124.66)
Housing and Community Development: $1,144,000 ($70.29)
Central Staff Services: $599,000 ($36.80)
General - Other: $400,000 ($24.58)
Public Welfare - Other: $238,000 ($14.62)
Local Fire Protection: $70,000 ($4.30)
- General - Interest on Debt: $1,034,000 ($63.53)
Vienna government finances - Revenue in 2021 (per resident):
- Charges - Sewerage: $4,037,000 ($248.03)
Parks and Recreation: $1,871,000 ($114.95)
Regular Highways: $56,000 ($3.44)
- Federal Intergovernmental - Other: $1,203,000 ($73.91)
Transit Utilities: $190,000 ($11.67)
- Local Intergovernmental - Other: $594,000 ($36.50)
Highways: $579,000 ($35.57)
Sewerage: $416,000 ($25.56)
- Miscellaneous - General Revenue - Other: $433,000 ($26.60)
Donations From Private Sources: $409,000 ($25.13)
Interest Earnings: $304,000 ($18.68)
Fines and Forfeits: $11,000 ($0.68)
- Revenue - Water Utilities: $4,715,000 ($289.69)
- State Intergovernmental - Highways: $2,001,000 ($122.94)
Other: $1,491,000 ($91.61)
Transit Utilities: $598,000 ($36.74)
Sewerage: $326,000 ($20.03)
- Tax - Property: $12,340,000 ($758.17)
Other License: $3,138,000 ($192.80)
Occupation and Business License - Other: $2,646,000 ($162.57)
Documentary and Stock Transfer: $2,567,000 ($157.72)
General Sales and Gross Receipts: $1,570,000 ($96.46)
Public Utilities Sales: $754,000 ($46.33)
Motor Vehicle License: $419,000 ($25.74)
Tobacco Products Sales: $192,000 ($11.80)
Vienna government finances - Debt in 2021 (per resident):
- Long Term Debt - Beginning Outstanding - Unspecified Public Purpose: $53,695,000 ($3299.03)
Outstanding Unspecified Public Purpose: $49,098,000 ($3016.59)
Retired Unspecified Public Purpose: $4,597,000 ($282.44)
Vienna government finances - Cash and Securities in 2021 (per resident):
- Bond Funds - Cash and Securities: $44,000,000 ($2703.37)
- Other Funds - Cash and Securities: $26,200,000 ($1609.73)
- Sinking Funds - Cash and Securities: $8,976,000 ($551.49)
8.87% of this county's 2021 resident taxpayers lived in other counties in 2020 ($108,323 average adjusted gross income)
| Here: | 8.87% |
| Virginia average: | 10.16% |
0.19% of residents moved from foreign countries ($2,634 average AGI)
Fairfax County: 0.19% Virginia average: 0.12%
Top counties from which taxpayers relocated into this county between 2020 and 2021:
| from Arlington County, VA | |
| from Alexandria city, VA | |
| from Loudoun County, VA |
10.12% of this county's 2020 resident taxpayers moved to other counties in 2021 ($118,643 average adjusted gross income)
| Here: | 10.12% |
| Virginia average: | 10.20% |
0.16% of residents moved to foreign countries ($2,238 average AGI)
Fairfax County: 0.16% Virginia average: 0.09%
Top counties to which taxpayers relocated from this county between 2020 and 2021:
| to Loudoun County, VA | |
| to Prince William County, VA | |
| to Arlington County, VA |
| Businesses in Vienna, VA | ||||
| Name | Count | Name | Count | |
|---|---|---|---|---|
| 7-Eleven | 6 | McDonald's | 5 | |
| AT&T | 2 | Men's Wearhouse | 1 | |
| Advance Auto Parts | 1 | Nike | 3 | |
| Audi | 1 | Nissan | 1 | |
| Baskin-Robbins | 1 | Olive Garden | 1 | |
| Bed Bath & Beyond | 1 | On The Border | 1 | |
| Blockbuster | 1 | Outback | 1 | |
| Budget Car Rental | 1 | Outback Steakhouse | 1 | |
| CVS | 2 | Panera Bread | 1 | |
| Chevrolet | 1 | Papa John's Pizza | 2 | |
| Chipotle | 1 | Payless | 1 | |
| Cold Stone Creamery | 1 | Pier 1 Imports | 1 | |
| Comfort Inn | 1 | Pizza Hut | 2 | |
| Curves | 1 | Popeyes | 1 | |
| DHL | 1 | Quiznos | 1 | |
| Dairy Queen | 1 | RadioShack | 2 | |
| Domino's Pizza | 1 | Rite Aid | 1 | |
| FedEx | 10 | Sheraton | 1 | |
| Ford | 1 | Sprint Nextel | 1 | |
| GNC | 1 | Staples | 1 | |
| GameStop | 2 | Starbucks | 4 | |
| Giant | 1 | Subaru | 1 | |
| H&R Block | 2 | Subway | 5 | |
| Hilton | 1 | T.J.Maxx | 1 | |
| Homestead Studio Suites | 1 | Taco Bell | 2 | |
| Honda | 1 | Toyota | 1 | |
| Just Tires | 1 | U-Haul | 1 | |
| KFC | 1 | UPS | 13 | |
| Lane Furniture | 3 | Verizon Wireless | 1 | |
| Marriott | 4 | Walgreens | 1 | |
| Marshalls | 1 | Wendy's | 2 | |
| MasterBrand Cabinets | 1 | Whole Foods Market | 1 | |
| Mazda | 1 | |||
Strongest AM radio stations in Vienna:
- WUST (1120 AM; daytime; 20 kW; WASHINGTON, DC)
- WDCT (1310 AM; 5 kW; FAIRFAX, VA; Owner: FAMILY RADIO, LTD.)
- WTEM (980 AM; 50 kW; WASHINGTON, DC; Owner: AMFM RADIO LICENSES, L.L.C.)
- WFAX (1220 AM; 5 kW; FALLS CHURCH, VA; Owner: NEWCOMB BROADCASTING CORP.)
- WTOP (1500 AM; 50 kW; WASHINGTON, DC; Owner: BONNEVILLE HOLDING COMPANY)
- WZHF (1390 AM; 5 kW; ARLINGTON, VA; Owner: WAY BROADCASTING, INC.)
- WABS (780 AM; daytime; 5 kW; ARLINGTON, VA; Owner: SALEM MEDIA OF VIRGINIA, INC.)
- WMET (1150 AM; 50 kW; GAITHERSBURG, MD; Owner: BELTWAY ACQUISITION CORPORATION)
- WPGC (1580 AM; 50 kW; MORNINGSIDE, MD; Owner: INFINITY WPGC(AM), INC.)
- WTNT (570 AM; 5 kW; BETHESDA, MD; Owner: AMFM RADIO LICENSES, L.L.C.)
- WMAL (630 AM; 5 kW; WASHINGTON, DC; Owner: WMAL, INC.)
- WKDL (730 AM; 8 kW; ALEXANDRIA, VA; Owner: MEGA COMMUNICATIONS OF ALEXANDRIA LICENSEE, LLC)
- WKCW (1420 AM; 50 kW; WARRENTON, VA; Owner: WAY BROADCASTING, INC.)
Strongest FM radio stations in Vienna:
- WJFK-FM (106.7 FM; MANASSAS, VA; Owner: INFINITY BROADCASTING CORP. OF WASHINGTON, DC)
- WJZW (105.9 FM; WOODBRIDGE, VA; Owner: WMAL, INC.)
- WMZQ-FM (98.7 FM; WASHINGTON, DC; Owner: AMFM RADIO LICENSES, L.L.C.)
- WGTS (91.9 FM; TAKOMA PARK, MD; Owner: COLUMBIA UNION COLLEGE BROADCASTING, INC.)
- WETA (90.9 FM; WASHINGTON, DC; Owner: GREATER WASHINGTON EDUCATIONAL TELECOMMUNICATIONS ASSN.)
- WAVA (105.1 FM; ARLINGTON, VA; Owner: SALEM MEDIA OF VIRGINIA, INC.)
- WARW (94.7 FM; BETHESDA, MD; Owner: INFINITY BROADCASTING OPERATIONS, INC.)
- WIHT (99.5 FM; WASHINGTON, DC; Owner: AMFM RADIO LICENSES, L.L.C.)
- WRQX (107.3 FM; WASHINGTON, DC; Owner: WMAL, INC.)
- WASH (97.1 FM; WASHINGTON, DC; Owner: AMFM RADIO LICENSES, L.L.C.)
- WHUR-FM (96.3 FM; WASHINGTON, DC; Owner: THE HOWARD UNIVERSITY)
- WKYS (93.9 FM; WASHINGTON, DC; Owner: RADIO ONE LICENSES, LLC)
- WGMS-FM (103.5 FM; WASHINGTON, DC; Owner: BONNEVILLE HOLDING COMPANY)
- WAMU (88.5 FM; WASHINGTON, DC; Owner: THE EXEC. COMM. OF THE BD. OF TRUSTEES OF AMERICAN UNIV.)
- WWDC-FM (101.1 FM; WASHINGTON, DC; Owner: AMFM RADIO LICENSES, L.L.C.)
- WMMJ (102.3 FM; BETHESDA, MD; Owner: RADIO ONE LICENSES, LLC)
- WPFW (89.3 FM; WASHINGTON, DC; Owner: PACIFICA FOUNDATION, INC.)
- WCSP-FM (90.1 FM; WASHINGTON, DC; Owner: NATIONAL CABLE SATELLITE CORPORATION)
- WBIG-FM (100.3 FM; WASHINGTON, DC; Owner: AMFM RADIO LICENSES, L.L.C.)
- WPGC-FM (95.5 FM; MORNINGSIDE, MD; Owner: INFINITY BROADCASTING CORPORATION OF MARYLAND)
TV broadcast stations around Vienna:
- WNVC (Channel 56; FAIRFAX, VA; Owner: COMMONWEALTH PUBLIC BROADCASTING CORPORATION)
- WETA-TV (Channel 26; WASHINGTON, DC; Owner: THE GREATER WASHINGTON ED TELECOMM. ASSOC)
- WJLA-TV (Channel 7; WASHINGTON, DC; Owner: ACC LICENSEE, INC.)
- WUSA (Channel 9; WASHINGTON, DC; Owner: THE DETROIT NEWS, INC.)
- WTTG (Channel 5; WASHINGTON, DC; Owner: FOX TELEVISION STATIONS, INC.)
- WDCA (Channel 20; WASHINGTON, DC; Owner: FOX TELEVISION STATIONS, INC.)
- W42BE (Channel 42; FAIRFAX, VA; Owner: FAIRFAX LOW POWER CO.)
- WHUT-TV (Channel 32; WASHINGTON, DC; Owner: HOWARD UNIVERSITY)
- WRC-TV (Channel 4; WASHINGTON, DC; Owner: NBC SUBSIDIARY (WRC-TV), INC.)
- WPXW (Channel 66; MANASSAS, VA; Owner: PAXSON WASHINGTON LICENSE, INC.)
- WBDC-TV (Channel 50; WASHINGTON, DC; Owner: WBDC BROADCASTING, INC.)
- W28BY (Channel 63; BALTIMORE, MD; Owner: INFORMATION SUPER STATION, L.L.C.)
- WMDO-CA (Channel 30; WASHINGTON, DC; Owner: ENTRAVISION HOLDINGS, LLC)
- WZDC-LP (Channel 64; WASHINGTON, DC; Owner: ONDA CAPITAL, INC.)
- WNVT (Channel 53; GOLDVEIN, VA; Owner: COMMONWEALTH PUBLIC BROADCASTING CORPORATION)
- WKRP-LP (Channel 42; WASHINGTON, DC; Owner: CAPITAL MEDIA, LLC)
- WBFF (Channel 45; BALTIMORE, MD; Owner: CHESAPEAKE TELEVISION LICENSEE, LLC)
- WIAV-LP (Channel 58; WASHINGTON, DC; Owner: ASIAVISION, INC.)
- WNUV (Channel 54; BALTIMORE, MD; Owner: BALTIMORE (WNUV-TV) LICENSEE, INC.)
- WMPT (Channel 22; ANNAPOLIS, MD; Owner: MARYLAND PUBLIC BROADCASTING COMMISSION)
- WUTB (Channel 24; BALTIMORE, MD; Owner: FOX TELEVISION STATIONS, INC.)
- WMPB (Channel 67; BALTIMORE, MD; Owner: MARYLAND PUBLIC BROADCASTING COMMISSION)
- WFPT (Channel 62; FREDERICK, MD; Owner: MARYLAND PUBLIC BROADCASTING COMMISSION)
- National Bridge Inventory (NBI) Statistics
- 9Number of bridges
- 30ft / 9.1mTotal length
- $94,000Total costs
- 72,787Total average daily traffic
- 1,210Total average daily truck traffic
- 88,692Total future (year 2034) average daily traffic
FCC Registered Antenna Towers: 53 (See the full list of FCC Registered Antenna Towers)
FCC Registered Private Land Mobile Towers: 5 (See the full list of FCC Registered Private Land Mobile Towers in Vienna, VA)
FCC Registered Broadcast Land Mobile Towers: 38 (See the full list of FCC Registered Broadcast Land Mobile Towers)
FCC Registered Microwave Towers: 15 (See the full list of FCC Registered Microwave Towers in this town)
FCC Registered Amateur Radio Licenses: 448 (See the full list of FCC Registered Amateur Radio Licenses in Vienna)
FAA Registered Aircraft: 44 (See the full list of FAA Registered Aircraft in Vienna)
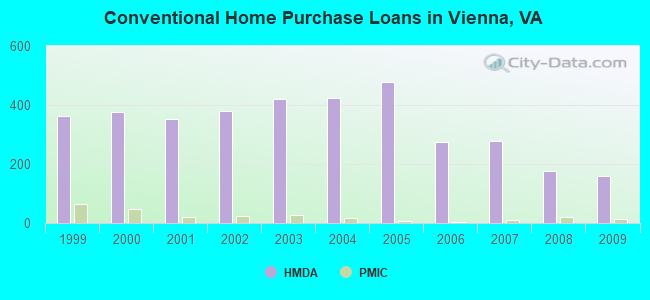
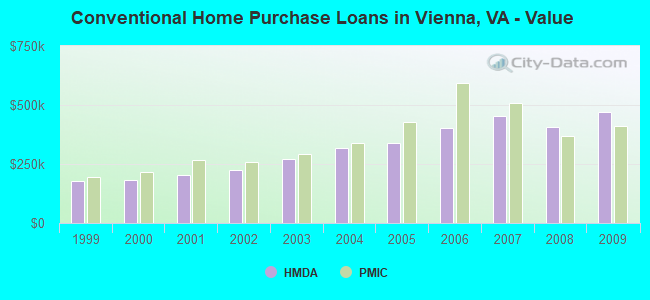
| Home Mortgage Disclosure Act Aggregated Statistics For Year 2009 (Based on 4 full tracts) | ||||||||||
| A) FHA, FSA/RHS & VA Home Purchase Loans | B) Conventional Home Purchase Loans | C) Refinancings | D) Home Improvement Loans | F) Non-occupant Loans on < 5 Family Dwellings (A B C & D) | ||||||
|---|---|---|---|---|---|---|---|---|---|---|
| Number | Average Value | Number | Average Value | Number | Average Value | Number | Average Value | Number | Average Value | |
| LOANS ORIGINATED | 33 | $502,879 | 158 | $469,348 | 698 | $359,736 | 23 | $184,478 | 36 | $296,111 |
| APPLICATIONS APPROVED, NOT ACCEPTED | 1 | $565,000 | 5 | $409,800 | 38 | $335,395 | 5 | $144,400 | 3 | $411,667 |
| APPLICATIONS DENIED | 3 | $370,333 | 10 | $582,400 | 120 | $452,233 | 11 | $187,091 | 7 | $139,143 |
| APPLICATIONS WITHDRAWN | 8 | $457,500 | 21 | $454,714 | 144 | $405,208 | 6 | $170,667 | 10 | $306,200 |
| FILES CLOSED FOR INCOMPLETENESS | 0 | $0 | 1 | $384,000 | 35 | $354,629 | 2 | $97,500 | 1 | $397,000 |
Detailed HMDA statistics for the following Tracts: 4607.00 , 4608.00, 4609.00, 4610.00
| Private Mortgage Insurance Companies Aggregated Statistics For Year 2009 (Based on 4 full tracts) | ||||
| A) Conventional Home Purchase Loans | B) Refinancings | |||
|---|---|---|---|---|
| Number | Average Value | Number | Average Value | |
| LOANS ORIGINATED | 15 | $409,200 | 7 | $466,714 |
| APPLICATIONS APPROVED, NOT ACCEPTED | 4 | $422,750 | 3 | $568,333 |
| APPLICATIONS DENIED | 1 | $625,000 | 1 | $413,000 |
| APPLICATIONS WITHDRAWN | 0 | $0 | 0 | $0 |
| FILES CLOSED FOR INCOMPLETENESS | 0 | $0 | 1 | $614,000 |
Detailed PMIC statistics for the following Tracts: 4607.00 , 4608.00, 4609.00, 4610.00
2006 - 2018 National Fire Incident Reporting System (NFIRS) incidents
- Fire incident types reported to NFIRS in Vienna, VA
- 45951.2%Structure Fires
- 26629.7%Outside Fires
- 12213.6%Mobile Property/Vehicle Fires
- 495.5%Other
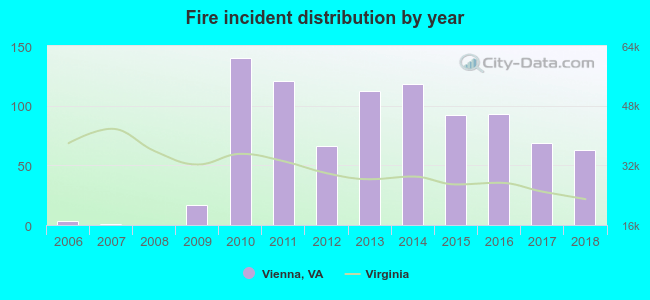 According to the data from the years 2006 - 2018 the average number of fire incidents per year is 69. The highest number of reported fire incidents - 140 took place in 2010, and the least - 0 in 2008. The data has a rising trend.
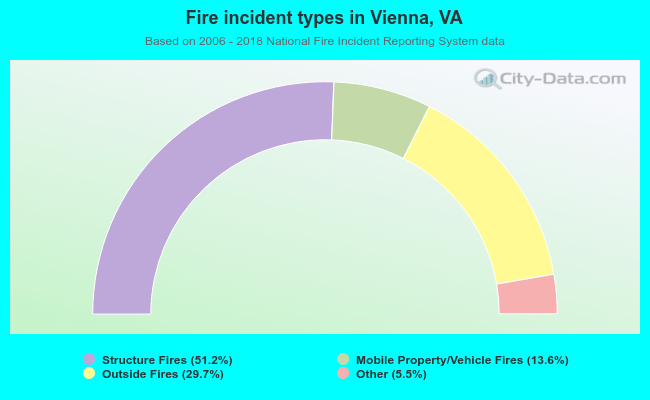 When looking into fire subcategories, the most reports belonged to: Structure Fires (51.2%), and Outside Fires (29.7%).
Fire-safe hotels and motels in Vienna, Virginia:
- Embassy Suites Hotel Tysons Corner, 8517 Leesburg Pike, Vienna, Virginia 22182 , Phone: (703) 883-0707, Fax: (703) 760-9842
- Comfort Inn Tysons Corner, 1587 Springhill Rd, Vienna, Virginia 22182 , Phone: (703) 448-8020, Fax: (703) 448-0343
- Sheraton Tysons Hotel, 8661 Leesburg Pike, Vienna, Virginia 22182 , Phone: (703) 448-1234, Fax: (703) 893-8193
- Residence Inn-Tysons Corner Mall, 8400 Old Courthouse Rd, Vienna, Virginia 22182 , Phone: (703) 917-6262, Fax: (703) 917-6262
- Courtyard By Marriott Dunn Loring, 2722 Gallows Rd, Vienna, Virginia 22180 , Phone: (703) 573-9555, Fax: (703) 573-6266
- Hilton Garden Inn Tysons Corner, 8301 Boone Blvd, Vienna, Virginia 22182 , Phone: (703) 760-9777, Fax: (703) 760-9780
- Hawthorn Suites Vienna Near Tysons Corner, 8616 Westwood Center Dr, Vienna, Virginia 22182 , Phone: (703) 893-0120, Fax: (703) 790-8896
- Extended Stay America, 8201 Old Courthouse Rd, Vienna, Virginia 22182 , Phone: (703) 356-6300, Fax: (703) 356-6353
| Most common first names in Vienna, VA among deceased individuals | ||
| Name | Count | Lived (average) |
|---|---|---|
| Mary | 226 | 80.9 years |
| John | 206 | 73.8 years |
| William | 182 | 73.6 years |
| Robert | 168 | 70.6 years |
| James | 167 | 70.5 years |
| Margaret | 116 | 81.2 years |
| Helen | 111 | 82.0 years |
| Charles | 103 | 72.6 years |
| Dorothy | 96 | 78.4 years |
| Joseph | 94 | 75.4 years |
| Most common last names in Vienna, VA among deceased individuals | ||
| Last name | Count | Lived (average) |
|---|---|---|
| Smith | 70 | 76.0 years |
| Brown | 48 | 73.9 years |
| Williams | 44 | 75.4 years |
| Thompson | 39 | 75.3 years |
| Davis | 33 | 79.1 years |
| Johnson | 32 | 76.1 years |
| Lee | 29 | 77.6 years |
| Carter | 27 | 76.8 years |
| Martin | 26 | 72.2 years |
| Miller | 26 | 74.7 years |
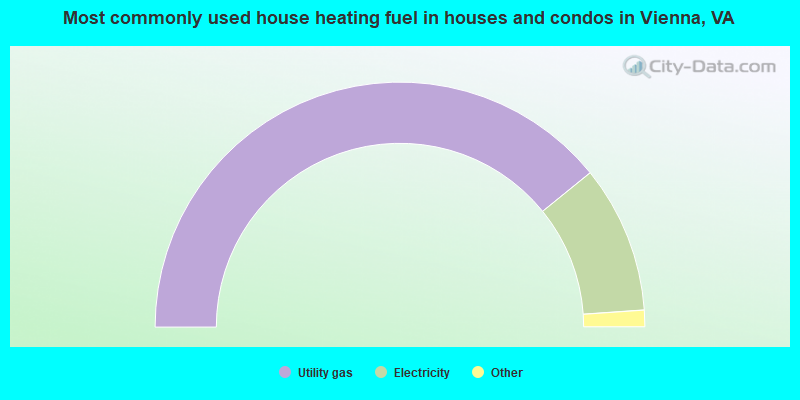
- 78.4%Utility gas
- 19.5%Electricity
- 1.2%Fuel oil, kerosene, etc.
- 0.8%Bottled, tank, or LP gas
- 0.2%Other fuel
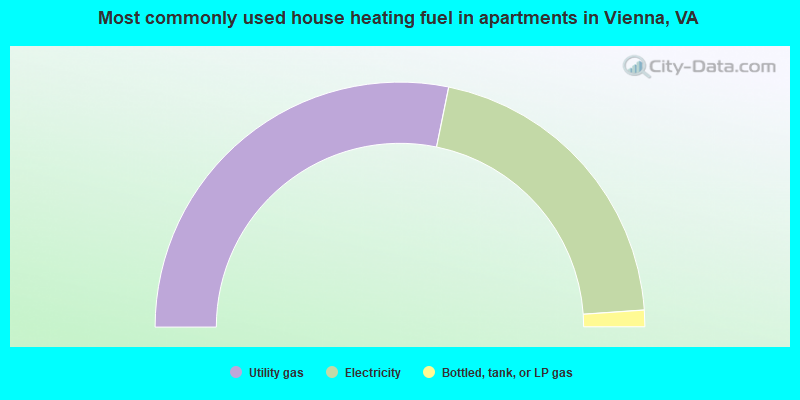
- 56.4%Utility gas
- 41.4%Electricity
- 2.2%Bottled, tank, or LP gas
Vienna compared to Virginia state average:
- Median household income significantly above state average.
- Median house value significantly above state average.
- Unemployed percentage significantly below state average.
- Black race population percentage significantly below state average.
- Median age above state average.
- Foreign-born population percentage above state average.
- Renting percentage below state average.
- Length of stay since moving in significantly above state average.
- Number of rooms per house above state average.
- House age significantly below state average.
- Percentage of population with a bachelor's degree or higher significantly above state average.
Vienna on our top lists:
- #17 on the list of "Top 101 cities with the most residents born in Bolivia (population 500+)"
- #51 on the list of "Top 101 cities with largest percentage of males in industries: professional, scientific, and technical services (population 5,000+)"
- #68 on the list of "Top 101 cities with largest percentage of females in industries: professional, scientific, and technical services (population 5,000+)"
- #82 on the list of "Top 101 cities with the most residents born in Iran (population 500+)"
- #3 on the list of "Top 101 counties with the largest number of children under 18 without health insurance coverage in 2000 (pop. 50,000+)"
- #4 on the list of "Top 101 counties with the lowest lead air pollution readings in 2012 (µg/m3)"
- #5 on the list of "Top 101 counties with the largest number of people without health insurance coverage in 2000 (pop. 50,000+)"
- #7 on the list of "Top 101 counties with the largest increase in the number of infant deaths per 1000 residents 2000-2006 to 2007-2013 (pop. 50,000+)"
- #13 on the list of "Top 101 counties with the lowest number of deaths per 1000 residents 2007-2013 (pop. 50,000+)"

|
|
Total of 1513 patent applications in 2008-2024.