Annandale, Virginia Submit your own pictures of this place and show them to the world
OSM Map
General Map
Google Map
MSN Map
OSM Map
General Map
Google Map
MSN Map
OSM Map
General Map
Google Map
MSN Map
OSM Map
General Map
Google Map
MSN Map
Please wait while loading the map...
Population in 2010: 41,008. Population change since 2000: -25.4%Males: 20,037 Females: 20,971
March 2022 cost of living index in Annandale: 166.7 (very high, U.S. average is 100) Percentage of residents living in poverty in 2022: 10.4%for White Non-Hispanic residents , 11.7% for Black residents , 16.1% for Hispanic or Latino residents , 12.4% for American Indian residents , 89.7% for Native Hawaiian and other Pacific Islander residents , 17.1% for other race residents , 16.5% for two or more races residents )
Profiles of local businesses
Business Search - 14 Million verified businesses
Data:
Median household income ($)
Median household income (% change since 2000)
Household income diversity
Ratio of average income to average house value (%)
Ratio of average income to average rent
Median household income ($) - White
Median household income ($) - Black or African American
Median household income ($) - Asian
Median household income ($) - Hispanic or Latino
Median household income ($) - American Indian and Alaska Native
Median household income ($) - Multirace
Median household income ($) - Other Race
Median household income for houses/condos with a mortgage ($)
Median household income for apartments without a mortgage ($)
Races - White alone (%)
Races - White alone (% change since 2000)
Races - Black alone (%)
Races - Black alone (% change since 2000)
Races - American Indian alone (%)
Races - American Indian alone (% change since 2000)
Races - Asian alone (%)
Races - Asian alone (% change since 2000)
Races - Hispanic (%)
Races - Hispanic (% change since 2000)
Races - Native Hawaiian and Other Pacific Islander alone (%)
Races - Native Hawaiian and Other Pacific Islander alone (% change since 2000)
Races - Two or more races (%)
Races - Two or more races (% change since 2000)
Races - Other race alone (%)
Races - Other race alone (% change since 2000)
Racial diversity
Unemployment (%)
Unemployment (% change since 2000)
Unemployment (%) - White
Unemployment (%) - Black or African American
Unemployment (%) - Asian
Unemployment (%) - Hispanic or Latino
Unemployment (%) - American Indian and Alaska Native
Unemployment (%) - Multirace
Unemployment (%) - Other Race
Population density (people per square mile)
Population - Males (%)
Population - Females (%)
Population - Males (%) - White
Population - Males (%) - Black or African American
Population - Males (%) - Asian
Population - Males (%) - Hispanic or Latino
Population - Males (%) - American Indian and Alaska Native
Population - Males (%) - Multirace
Population - Males (%) - Other Race
Population - Females (%) - White
Population - Females (%) - Black or African American
Population - Females (%) - Asian
Population - Females (%) - Hispanic or Latino
Population - Females (%) - American Indian and Alaska Native
Population - Females (%) - Multirace
Population - Females (%) - Other Race
Coronavirus confirmed cases (Apr 27, 2024)
Deaths caused by coronavirus (Apr 27, 2024)
Coronavirus confirmed cases (per 100k population) (Apr 27, 2024)
Deaths caused by coronavirus (per 100k population) (Apr 27, 2024)
Daily increase in number of cases (Apr 27, 2024)
Weekly increase in number of cases (Apr 27, 2024)
Cases doubled (in days) (Apr 27, 2024)
Hospitalized patients (Apr 18, 2022)
Negative test results (Apr 18, 2022)
Total test results (Apr 18, 2022)
COVID Vaccine doses distributed (per 100k population) (Sep 19, 2023)
COVID Vaccine doses administered (per 100k population) (Sep 19, 2023)
COVID Vaccine doses distributed (Sep 19, 2023)
COVID Vaccine doses administered (Sep 19, 2023)
Likely homosexual households (%)
Likely homosexual households (% change since 2000)
Likely homosexual households - Lesbian couples (%)
Likely homosexual households - Lesbian couples (% change since 2000)
Likely homosexual households - Gay men (%)
Likely homosexual households - Gay men (% change since 2000)
Cost of living index
Median gross rent ($)
Median contract rent ($)
Median monthly housing costs ($)
Median house or condo value ($)
Median house or condo value ($ change since 2000)
Mean house or condo value by units in structure - 1, detached ($)
Mean house or condo value by units in structure - 1, attached ($)
Mean house or condo value by units in structure - 2 ($)
Mean house or condo value by units in structure by units in structure - 3 or 4 ($)
Mean house or condo value by units in structure - 5 or more ($)
Mean house or condo value by units in structure - Boat, RV, van, etc. ($)
Mean house or condo value by units in structure - Mobile home ($)
Median house or condo value ($) - White
Median house or condo value ($) - Black or African American
Median house or condo value ($) - Asian
Median house or condo value ($) - Hispanic or Latino
Median house or condo value ($) - American Indian and Alaska Native
Median house or condo value ($) - Multirace
Median house or condo value ($) - Other Race
Median resident age
Resident age diversity
Median resident age - Males
Median resident age - Females
Median resident age - White
Median resident age - Black or African American
Median resident age - Asian
Median resident age - Hispanic or Latino
Median resident age - American Indian and Alaska Native
Median resident age - Multirace
Median resident age - Other Race
Median resident age - Males - White
Median resident age - Males - Black or African American
Median resident age - Males - Asian
Median resident age - Males - Hispanic or Latino
Median resident age - Males - American Indian and Alaska Native
Median resident age - Males - Multirace
Median resident age - Males - Other Race
Median resident age - Females - White
Median resident age - Females - Black or African American
Median resident age - Females - Asian
Median resident age - Females - Hispanic or Latino
Median resident age - Females - American Indian and Alaska Native
Median resident age - Females - Multirace
Median resident age - Females - Other Race
Commute - mean travel time to work (minutes)
Travel time to work - Less than 5 minutes (%)
Travel time to work - Less than 5 minutes (% change since 2000)
Travel time to work - 5 to 9 minutes (%)
Travel time to work - 5 to 9 minutes (% change since 2000)
Travel time to work - 10 to 19 minutes (%)
Travel time to work - 10 to 19 minutes (% change since 2000)
Travel time to work - 20 to 29 minutes (%)
Travel time to work - 20 to 29 minutes (% change since 2000)
Travel time to work - 30 to 39 minutes (%)
Travel time to work - 30 to 39 minutes (% change since 2000)
Travel time to work - 40 to 59 minutes (%)
Travel time to work - 40 to 59 minutes (% change since 2000)
Travel time to work - 60 to 89 minutes (%)
Travel time to work - 60 to 89 minutes (% change since 2000)
Travel time to work - 90 or more minutes (%)
Travel time to work - 90 or more minutes (% change since 2000)
Marital status - Never married (%)
Marital status - Now married (%)
Marital status - Separated (%)
Marital status - Widowed (%)
Marital status - Divorced (%)
Median family income ($)
Median family income (% change since 2000)
Median non-family income ($)
Median non-family income (% change since 2000)
Median per capita income ($)
Median per capita income (% change since 2000)
Median family income ($) - White
Median family income ($) - Black or African American
Median family income ($) - Asian
Median family income ($) - Hispanic or Latino
Median family income ($) - American Indian and Alaska Native
Median family income ($) - Multirace
Median family income ($) - Other Race
Median year house/condo built
Median year apartment built
Year house built - Built 2005 or later (%)
Year house built - Built 2000 to 2004 (%)
Year house built - Built 1990 to 1999 (%)
Year house built - Built 1980 to 1989 (%)
Year house built - Built 1970 to 1979 (%)
Year house built - Built 1960 to 1969 (%)
Year house built - Built 1950 to 1959 (%)
Year house built - Built 1940 to 1949 (%)
Year house built - Built 1939 or earlier (%)
Average household size
Household density (households per square mile)
Average household size - White
Average household size - Black or African American
Average household size - Asian
Average household size - Hispanic or Latino
Average household size - American Indian and Alaska Native
Average household size - Multirace
Average household size - Other Race
Occupied housing units (%)
Vacant housing units (%)
Owner occupied housing units (%)
Renter occupied housing units (%)
Vacancy status - For rent (%)
Vacancy status - For sale only (%)
Vacancy status - Rented or sold, not occupied (%)
Vacancy status - For seasonal, recreational, or occasional use (%)
Vacancy status - For migrant workers (%)
Vacancy status - Other vacant (%)
Residents with income below the poverty level (%)
Residents with income below 50% of the poverty level (%)
Children below poverty level (%)
Poor families by family type - Married-couple family (%)
Poor families by family type - Male, no wife present (%)
Poor families by family type - Female, no husband present (%)
Poverty status for native-born residents (%)
Poverty status for foreign-born residents (%)
Poverty among high school graduates not in families (%)
Poverty among people who did not graduate high school not in families (%)
Residents with income below the poverty level (%) - White
Residents with income below the poverty level (%) - Black or African American
Residents with income below the poverty level (%) - Asian
Residents with income below the poverty level (%) - Hispanic or Latino
Residents with income below the poverty level (%) - American Indian and Alaska Native
Residents with income below the poverty level (%) - Multirace
Residents with income below the poverty level (%) - Other Race
Air pollution - Air Quality Index (AQI)
Air pollution - CO
Air pollution - NO2
Air pollution - SO2
Air pollution - Ozone
Air pollution - PM10
Air pollution - PM25
Air pollution - Pb
Crime - Murders per 100,000 population
Crime - Rapes per 100,000 population
Crime - Robberies per 100,000 population
Crime - Assaults per 100,000 population
Crime - Burglaries per 100,000 population
Crime - Thefts per 100,000 population
Crime - Auto thefts per 100,000 population
Crime - Arson per 100,000 population
Crime - City-data.com crime index
Crime - Violent crime index
Crime - Property crime index
Crime - Murders per 100,000 population (5 year average)
Crime - Rapes per 100,000 population (5 year average)
Crime - Robberies per 100,000 population (5 year average)
Crime - Assaults per 100,000 population (5 year average)
Crime - Burglaries per 100,000 population (5 year average)
Crime - Thefts per 100,000 population (5 year average)
Crime - Auto thefts per 100,000 population (5 year average)
Crime - Arson per 100,000 population (5 year average)
Crime - City-data.com crime index (5 year average)
Crime - Violent crime index (5 year average)
Crime - Property crime index (5 year average)
1996 Presidential Elections Results (%) - Democratic Party (Clinton)
1996 Presidential Elections Results (%) - Republican Party (Dole)
1996 Presidential Elections Results (%) - Other
2000 Presidential Elections Results (%) - Democratic Party (Gore)
2000 Presidential Elections Results (%) - Republican Party (Bush)
2000 Presidential Elections Results (%) - Other
2004 Presidential Elections Results (%) - Democratic Party (Kerry)
2004 Presidential Elections Results (%) - Republican Party (Bush)
2004 Presidential Elections Results (%) - Other
2008 Presidential Elections Results (%) - Democratic Party (Obama)
2008 Presidential Elections Results (%) - Republican Party (McCain)
2008 Presidential Elections Results (%) - Other
2012 Presidential Elections Results (%) - Democratic Party (Obama)
2012 Presidential Elections Results (%) - Republican Party (Romney)
2012 Presidential Elections Results (%) - Other
2016 Presidential Elections Results (%) - Democratic Party (Clinton)
2016 Presidential Elections Results (%) - Republican Party (Trump)
2016 Presidential Elections Results (%) - Other
2020 Presidential Elections Results (%) - Democratic Party (Biden)
2020 Presidential Elections Results (%) - Republican Party (Trump)
2020 Presidential Elections Results (%) - Other
Ancestries Reported - Arab (%)
Ancestries Reported - Czech (%)
Ancestries Reported - Danish (%)
Ancestries Reported - Dutch (%)
Ancestries Reported - English (%)
Ancestries Reported - French (%)
Ancestries Reported - French Canadian (%)
Ancestries Reported - German (%)
Ancestries Reported - Greek (%)
Ancestries Reported - Hungarian (%)
Ancestries Reported - Irish (%)
Ancestries Reported - Italian (%)
Ancestries Reported - Lithuanian (%)
Ancestries Reported - Norwegian (%)
Ancestries Reported - Polish (%)
Ancestries Reported - Portuguese (%)
Ancestries Reported - Russian (%)
Ancestries Reported - Scotch-Irish (%)
Ancestries Reported - Scottish (%)
Ancestries Reported - Slovak (%)
Ancestries Reported - Subsaharan African (%)
Ancestries Reported - Swedish (%)
Ancestries Reported - Swiss (%)
Ancestries Reported - Ukrainian (%)
Ancestries Reported - United States (%)
Ancestries Reported - Welsh (%)
Ancestries Reported - West Indian (%)
Ancestries Reported - Other (%)
Educational Attainment - No schooling completed (%)
Educational Attainment - Less than high school (%)
Educational Attainment - High school or equivalent (%)
Educational Attainment - Less than 1 year of college (%)
Educational Attainment - 1 or more years of college (%)
Educational Attainment - Associate degree (%)
Educational Attainment - Bachelor's degree (%)
Educational Attainment - Master's degree (%)
Educational Attainment - Professional school degree (%)
Educational Attainment - Doctorate degree (%)
School Enrollment - Nursery, preschool (%)
School Enrollment - Kindergarten (%)
School Enrollment - Grade 1 to 4 (%)
School Enrollment - Grade 5 to 8 (%)
School Enrollment - Grade 9 to 12 (%)
School Enrollment - College undergrad (%)
School Enrollment - Graduate or professional (%)
School Enrollment - Not enrolled in school (%)
School enrollment - Public schools (%)
School enrollment - Private schools (%)
School enrollment - Not enrolled (%)
Median number of rooms in houses and condos
Median number of rooms in apartments
Housing units lacking complete plumbing facilities (%)
Housing units lacking complete kitchen facilities (%)
Density of houses
Urban houses (%)
Rural houses (%)
Households with people 60 years and over (%)
Households with people 65 years and over (%)
Households with people 75 years and over (%)
Households with one or more nonrelatives (%)
Households with no nonrelatives (%)
Population in households (%)
Family households (%)
Nonfamily households (%)
Population in families (%)
Family households with own children (%)
Median number of bedrooms in owner occupied houses
Mean number of bedrooms in owner occupied houses
Median number of bedrooms in renter occupied houses
Mean number of bedrooms in renter occupied houses
Median number of vehichles in owner occupied houses
Mean number of vehichles in owner occupied houses
Median number of vehichles in renter occupied houses
Mean number of vehichles in renter occupied houses
Mortgage status - with mortgage (%)
Mortgage status - with second mortgage (%)
Mortgage status - with home equity loan (%)
Mortgage status - with both second mortgage and home equity loan (%)
Mortgage status - without a mortgage (%)
Average family size
Average family size - White
Average family size - Black or African American
Average family size - Asian
Average family size - Hispanic or Latino
Average family size - American Indian and Alaska Native
Average family size - Multirace
Average family size - Other Race
Geographical mobility - Same house 1 year ago (%)
Geographical mobility - Moved within same county (%)
Geographical mobility - Moved from different county within same state (%)
Geographical mobility - Moved from different state (%)
Geographical mobility - Moved from abroad (%)
Place of birth - Born in state of residence (%)
Place of birth - Born in other state (%)
Place of birth - Native, outside of US (%)
Place of birth - Foreign born (%)
Housing units in structures - 1, detached (%)
Housing units in structures - 1, attached (%)
Housing units in structures - 2 (%)
Housing units in structures - 3 or 4 (%)
Housing units in structures - 5 to 9 (%)
Housing units in structures - 10 to 19 (%)
Housing units in structures - 20 to 49 (%)
Housing units in structures - 50 or more (%)
Housing units in structures - Mobile home (%)
Housing units in structures - Boat, RV, van, etc. (%)
House/condo owner moved in on average (years ago)
Renter moved in on average (years ago)
Year householder moved into unit - Moved in 1999 to March 2000 (%)
Year householder moved into unit - Moved in 1995 to 1998 (%)
Year householder moved into unit - Moved in 1990 to 1994 (%)
Year householder moved into unit - Moved in 1980 to 1989 (%)
Year householder moved into unit - Moved in 1970 to 1979 (%)
Year householder moved into unit - Moved in 1969 or earlier (%)
Means of transportation to work - Drove car alone (%)
Means of transportation to work - Carpooled (%)
Means of transportation to work - Public transportation (%)
Means of transportation to work - Bus or trolley bus (%)
Means of transportation to work - Streetcar or trolley car (%)
Means of transportation to work - Subway or elevated (%)
Means of transportation to work - Railroad (%)
Means of transportation to work - Ferryboat (%)
Means of transportation to work - Taxicab (%)
Means of transportation to work - Motorcycle (%)
Means of transportation to work - Bicycle (%)
Means of transportation to work - Walked (%)
Means of transportation to work - Other means (%)
Working at home (%)
Industry diversity
Most Common Industries - Agriculture, forestry, fishing and hunting, and mining (%)
Most Common Industries - Agriculture, forestry, fishing and hunting (%)
Most Common Industries - Mining, quarrying, and oil and gas extraction (%)
Most Common Industries - Construction (%)
Most Common Industries - Manufacturing (%)
Most Common Industries - Wholesale trade (%)
Most Common Industries - Retail trade (%)
Most Common Industries - Transportation and warehousing, and utilities (%)
Most Common Industries - Transportation and warehousing (%)
Most Common Industries - Utilities (%)
Most Common Industries - Information (%)
Most Common Industries - Finance and insurance, and real estate and rental and leasing (%)
Most Common Industries - Finance and insurance (%)
Most Common Industries - Real estate and rental and leasing (%)
Most Common Industries - Professional, scientific, and management, and administrative and waste management services (%)
Most Common Industries - Professional, scientific, and technical services (%)
Most Common Industries - Management of companies and enterprises (%)
Most Common Industries - Administrative and support and waste management services (%)
Most Common Industries - Educational services, and health care and social assistance (%)
Most Common Industries - Educational services (%)
Most Common Industries - Health care and social assistance (%)
Most Common Industries - Arts, entertainment, and recreation, and accommodation and food services (%)
Most Common Industries - Arts, entertainment, and recreation (%)
Most Common Industries - Accommodation and food services (%)
Most Common Industries - Other services, except public administration (%)
Most Common Industries - Public administration (%)
Occupation diversity
Most Common Occupations - Management, business, science, and arts occupations (%)
Most Common Occupations - Management, business, and financial occupations (%)
Most Common Occupations - Management occupations (%)
Most Common Occupations - Business and financial operations occupations (%)
Most Common Occupations - Computer, engineering, and science occupations (%)
Most Common Occupations - Computer and mathematical occupations (%)
Most Common Occupations - Architecture and engineering occupations (%)
Most Common Occupations - Life, physical, and social science occupations (%)
Most Common Occupations - Education, legal, community service, arts, and media occupations (%)
Most Common Occupations - Community and social service occupations (%)
Most Common Occupations - Legal occupations (%)
Most Common Occupations - Education, training, and library occupations (%)
Most Common Occupations - Arts, design, entertainment, sports, and media occupations (%)
Most Common Occupations - Healthcare practitioners and technical occupations (%)
Most Common Occupations - Health diagnosing and treating practitioners and other technical occupations (%)
Most Common Occupations - Health technologists and technicians (%)
Most Common Occupations - Service occupations (%)
Most Common Occupations - Healthcare support occupations (%)
Most Common Occupations - Protective service occupations (%)
Most Common Occupations - Fire fighting and prevention, and other protective service workers including supervisors (%)
Most Common Occupations - Law enforcement workers including supervisors (%)
Most Common Occupations - Food preparation and serving related occupations (%)
Most Common Occupations - Building and grounds cleaning and maintenance occupations (%)
Most Common Occupations - Personal care and service occupations (%)
Most Common Occupations - Sales and office occupations (%)
Most Common Occupations - Sales and related occupations (%)
Most Common Occupations - Office and administrative support occupations (%)
Most Common Occupations - Natural resources, construction, and maintenance occupations (%)
Most Common Occupations - Farming, fishing, and forestry occupations (%)
Most Common Occupations - Construction and extraction occupations (%)
Most Common Occupations - Installation, maintenance, and repair occupations (%)
Most Common Occupations - Production, transportation, and material moving occupations (%)
Most Common Occupations - Production occupations (%)
Most Common Occupations - Transportation occupations (%)
Most Common Occupations - Material moving occupations (%)
People in Group quarters - Institutionalized population (%)
People in Group quarters - Correctional institutions (%)
People in Group quarters - Federal prisons and detention centers (%)
People in Group quarters - Halfway houses (%)
People in Group quarters - Local jails and other confinement facilities (including police lockups) (%)
People in Group quarters - Military disciplinary barracks (%)
People in Group quarters - State prisons (%)
People in Group quarters - Other types of correctional institutions (%)
People in Group quarters - Nursing homes (%)
People in Group quarters - Hospitals/wards, hospices, and schools for the handicapped (%)
People in Group quarters - Hospitals/wards and hospices for chronically ill (%)
People in Group quarters - Hospices or homes for chronically ill (%)
People in Group quarters - Military hospitals or wards for chronically ill (%)
People in Group quarters - Other hospitals or wards for chronically ill (%)
People in Group quarters - Hospitals or wards for drug/alcohol abuse (%)
People in Group quarters - Mental (Psychiatric) hospitals or wards (%)
People in Group quarters - Schools, hospitals, or wards for the mentally retarded (%)
People in Group quarters - Schools, hospitals, or wards for the physically handicapped (%)
People in Group quarters - Institutions for the deaf (%)
People in Group quarters - Institutions for the blind (%)
People in Group quarters - Orthopedic wards and institutions for the physically handicapped (%)
People in Group quarters - Wards in general hospitals for patients who have no usual home elsewhere (%)
People in Group quarters - Wards in military hospitals for patients who have no usual home elsewhere (%)
People in Group quarters - Juvenile institutions (%)
People in Group quarters - Long-term care (%)
People in Group quarters - Homes for abused, dependent, and neglected children (%)
People in Group quarters - Residential treatment centers for emotionally disturbed children (%)
People in Group quarters - Training schools for juvenile delinquents (%)
People in Group quarters - Short-term care, detention or diagnostic centers for delinquent children (%)
People in Group quarters - Type of juvenile institution unknown (%)
People in Group quarters - Noninstitutionalized population (%)
People in Group quarters - College dormitories (includes college quarters off campus) (%)
People in Group quarters - Military quarters (%)
People in Group quarters - On base (%)
People in Group quarters - Barracks, unaccompanied personnel housing (UPH), (Enlisted/Officer), ;and similar group living quarters for military personnel (%)
People in Group quarters - Transient quarters for temporary residents (%)
People in Group quarters - Military ships (%)
People in Group quarters - Group homes (%)
People in Group quarters - Homes or halfway houses for drug/alcohol abuse (%)
People in Group quarters - Homes for the mentally ill (%)
People in Group quarters - Homes for the mentally retarded (%)
People in Group quarters - Homes for the physically handicapped (%)
People in Group quarters - Other group homes (%)
People in Group quarters - Religious group quarters (%)
People in Group quarters - Dormitories (%)
People in Group quarters - Agriculture workers' dormitories on farms (%)
People in Group quarters - Job Corps and vocational training facilities (%)
People in Group quarters - Other workers' dormitories (%)
People in Group quarters - Crews of maritime vessels (%)
People in Group quarters - Other nonhousehold living situations (%)
People in Group quarters - Other noninstitutional group quarters (%)
Residents speaking English at home (%)
Residents speaking English at home - Born in the United States (%)
Residents speaking English at home - Native, born elsewhere (%)
Residents speaking English at home - Foreign born (%)
Residents speaking Spanish at home (%)
Residents speaking Spanish at home - Born in the United States (%)
Residents speaking Spanish at home - Native, born elsewhere (%)
Residents speaking Spanish at home - Foreign born (%)
Residents speaking other language at home (%)
Residents speaking other language at home - Born in the United States (%)
Residents speaking other language at home - Native, born elsewhere (%)
Residents speaking other language at home - Foreign born (%)
Class of Workers - Employee of private company (%)
Class of Workers - Self-employed in own incorporated business (%)
Class of Workers - Private not-for-profit wage and salary workers (%)
Class of Workers - Local government workers (%)
Class of Workers - State government workers (%)
Class of Workers - Federal government workers (%)
Class of Workers - Self-employed workers in own not incorporated business and Unpaid family workers (%)
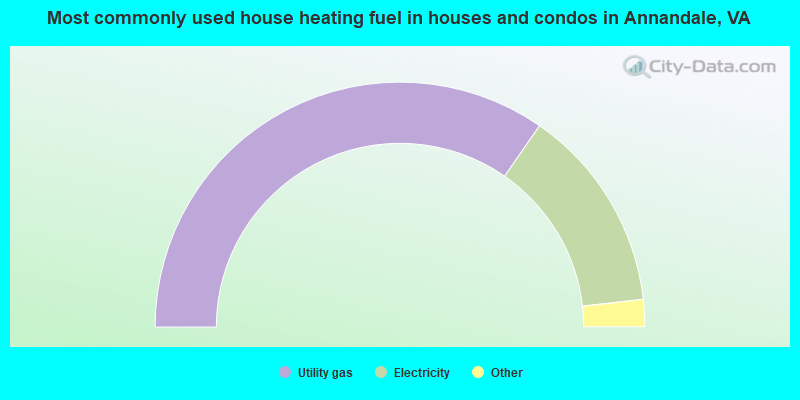
House heating fuel used in houses and condos - Utility gas (%)
House heating fuel used in houses and condos - Bottled, tank, or LP gas (%)
House heating fuel used in houses and condos - Electricity (%)
House heating fuel used in houses and condos - Fuel oil, kerosene, etc. (%)
House heating fuel used in houses and condos - Coal or coke (%)
House heating fuel used in houses and condos - Wood (%)
House heating fuel used in houses and condos - Solar energy (%)
House heating fuel used in houses and condos - Other fuel (%)
House heating fuel used in houses and condos - No fuel used (%)
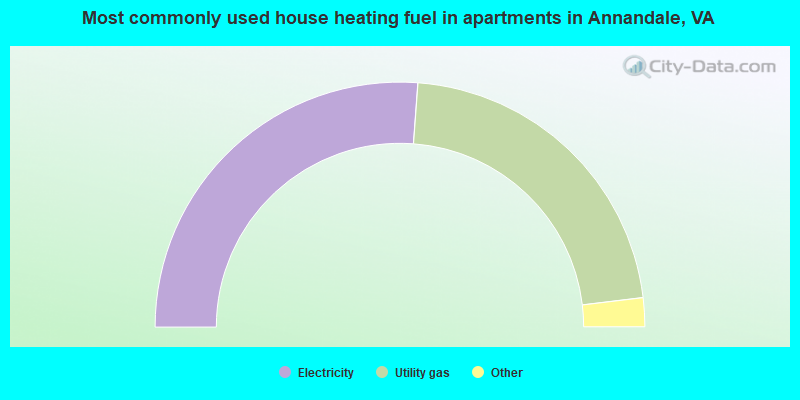
House heating fuel used in apartments - Utility gas (%)
House heating fuel used in apartments - Bottled, tank, or LP gas (%)
House heating fuel used in apartments - Electricity (%)
House heating fuel used in apartments - Fuel oil, kerosene, etc. (%)
House heating fuel used in apartments - Coal or coke (%)
House heating fuel used in apartments - Wood (%)
House heating fuel used in apartments - Solar energy (%)
House heating fuel used in apartments - Other fuel (%)
House heating fuel used in apartments - No fuel used (%)
Armed forces status - In Armed Forces (%)
Armed forces status - Civilian (%)
Armed forces status - Civilian - Veteran (%)
Armed forces status - Civilian - Nonveteran (%)
Fatal accidents locations in years 2005-2021
Fatal accidents locations in 2005
Fatal accidents locations in 2006
Fatal accidents locations in 2007
Fatal accidents locations in 2008
Fatal accidents locations in 2009
Fatal accidents locations in 2010
Fatal accidents locations in 2011
Fatal accidents locations in 2012
Fatal accidents locations in 2013
Fatal accidents locations in 2014
Fatal accidents locations in 2015
Fatal accidents locations in 2016
Fatal accidents locations in 2017
Fatal accidents locations in 2018
Fatal accidents locations in 2019
Fatal accidents locations in 2020
Fatal accidents locations in 2021
Alcohol use - People drinking some alcohol every month (%)
Alcohol use - People not drinking at all (%)
Alcohol use - Average days/month drinking alcohol
Alcohol use - Average drinks/week
Alcohol use - Average days/year people drink much
Audiometry - Average condition of hearing (%)
Audiometry - People that can hear a whisper from across a quiet room (%)
Audiometry - People that can hear normal voice from across a quiet room (%)
Audiometry - Ears ringing, roaring, buzzing (%)
Audiometry - Had a job exposure to loud noise (%)
Audiometry - Had off-work exposure to loud noise (%)
Blood Pressure & Cholesterol - Has high blood pressure (%)
Blood Pressure & Cholesterol - Checking blood pressure at home (%)
Blood Pressure & Cholesterol - Frequently checking blood cholesterol (%)
Blood Pressure & Cholesterol - Has high cholesterol level (%)
Consumer Behavior - Money monthly spent on food at supermarket/grocery store
Consumer Behavior - Money monthly spent on food at other stores
Consumer Behavior - Money monthly spent on eating out
Consumer Behavior - Money monthly spent on carryout/delivered foods
Consumer Behavior - Income spent on food at supermarket/grocery store (%)
Consumer Behavior - Income spent on food at other stores (%)
Consumer Behavior - Income spent on eating out (%)
Consumer Behavior - Income spent on carryout/delivered foods (%)
Current Health Status - General health condition (%)
Current Health Status - Blood donors (%)
Current Health Status - Has blood ever tested for HIV virus (%)
Current Health Status - Left-handed people (%)
Dermatology - People using sunscreen (%)
Diabetes - Diabetics (%)
Diabetes - Had a blood test for high blood sugar (%)
Diabetes - People taking insulin (%)
Diet Behavior & Nutrition - Diet health (%)
Diet Behavior & Nutrition - Milk product consumption (# of products/month)
Diet Behavior & Nutrition - Meals not home prepared (#/week)
Diet Behavior & Nutrition - Meals from fast food or pizza place (#/week)
Diet Behavior & Nutrition - Ready-to-eat foods (#/month)
Diet Behavior & Nutrition - Frozen meals/pizza (#/month)
Drug Use - People that ever used marijuana or hashish (%)
Drug Use - Ever used hard drugs (%)
Drug Use - Ever used any form of cocaine (%)
Drug Use - Ever used heroin (%)
Drug Use - Ever used methamphetamine (%)
Health Insurance - People covered by health insurance (%)
Kidney Conditions-Urology - Avg. # of times urinating at night
Medical Conditions - People with asthma (%)
Medical Conditions - People with anemia (%)
Medical Conditions - People with psoriasis (%)
Medical Conditions - People with overweight (%)
Medical Conditions - Elderly people having difficulties in thinking or remembering (%)
Medical Conditions - People who ever received blood transfusion (%)
Medical Conditions - People having trouble seeing even with glass/contacts (%)
Medical Conditions - People with arthritis (%)
Medical Conditions - People with gout (%)
Medical Conditions - People with congestive heart failure (%)
Medical Conditions - People with coronary heart disease (%)
Medical Conditions - People with angina pectoris (%)
Medical Conditions - People who ever had heart attack (%)
Medical Conditions - People who ever had stroke (%)
Medical Conditions - People with emphysema (%)
Medical Conditions - People with thyroid problem (%)
Medical Conditions - People with chronic bronchitis (%)
Medical Conditions - People with any liver condition (%)
Medical Conditions - People who ever had cancer or malignancy (%)
Mental Health - People who have little interest in doing things (%)
Mental Health - People feeling down, depressed, or hopeless (%)
Mental Health - People who have trouble sleeping or sleeping too much (%)
Mental Health - People feeling tired or having little energy (%)
Mental Health - People with poor appetite or overeating (%)
Mental Health - People feeling bad about themself (%)
Mental Health - People who have trouble concentrating on things (%)
Mental Health - People moving or speaking slowly or too fast (%)
Mental Health - People having thoughts they would be better off dead (%)
Oral Health - Average years since last visit a dentist
Oral Health - People embarrassed because of mouth (%)
Oral Health - People with gum disease (%)
Oral Health - General health of teeth and gums (%)
Oral Health - Average days a week using dental floss/device
Oral Health - Average days a week using mouthwash for dental problem
Oral Health - Average number of teeth
Pesticide Use - Households using pesticides to control insects (%)
Pesticide Use - Households using pesticides to kill weeds (%)
Physical Activity - People doing vigorous-intensity work activities (%)
Physical Activity - People doing moderate-intensity work activities (%)
Physical Activity - People walking or bicycling (%)
Physical Activity - People doing vigorous-intensity recreational activities (%)
Physical Activity - People doing moderate-intensity recreational activities (%)
Physical Activity - Average hours a day doing sedentary activities
Physical Activity - Average hours a day watching TV or videos
Physical Activity - Average hours a day using computer
Physical Functioning - People having limitations keeping them from working (%)
Physical Functioning - People limited in amount of work they can do (%)
Physical Functioning - People that need special equipment to walk (%)
Physical Functioning - People experiencing confusion/memory problems (%)
Physical Functioning - People requiring special healthcare equipment (%)
Prescription Medications - Average number of prescription medicines taking
Preventive Aspirin Use - Adults 40+ taking low-dose aspirin (%)
Reproductive Health - Vaginal deliveries (%)
Reproductive Health - Cesarean deliveries (%)
Reproductive Health - Deliveries resulted in a live birth (%)
Reproductive Health - Pregnancies resulted in a delivery (%)
Reproductive Health - Women breastfeeding newborns (%)
Reproductive Health - Women that had a hysterectomy (%)
Reproductive Health - Women that had both ovaries removed (%)
Reproductive Health - Women that have ever taken birth control pills (%)
Reproductive Health - Women taking birth control pills (%)
Reproductive Health - Women that have ever used Depo-Provera or injectables (%)
Reproductive Health - Women that have ever used female hormones (%)
Sexual Behavior - People 18+ that ever had sex (vaginal, anal, or oral) (%)
Sexual Behavior - Males 18+ that ever had vaginal sex with a woman (%)
Sexual Behavior - Males 18+ that ever performed oral sex on a woman (%)
Sexual Behavior - Males 18+ that ever had anal sex with a woman (%)
Sexual Behavior - Males 18+ that ever had any sex with a man (%)
Sexual Behavior - Females 18+ that ever had vaginal sex with a man (%)
Sexual Behavior - Females 18+ that ever performed oral sex on a man (%)
Sexual Behavior - Females 18+ that ever had anal sex with a man (%)
Sexual Behavior - Females 18+ that ever had any kind of sex with a woman (%)
Sexual Behavior - Average age people first had sex
Sexual Behavior - Average number of female sex partners in lifetime (males 18+)
Sexual Behavior - Average number of female vaginal sex partners in lifetime (males 18+)
Sexual Behavior - Average age people first performed oral sex on a woman (18+)
Sexual Behavior - Average number of woman performed oral sex on in lifetime (18+)
Sexual Behavior - Average number of male sex partners in lifetime (males 18+)
Sexual Behavior - Average number of male anal sex partners in lifetime (males 18+)
Sexual Behavior - Average age people first performed oral sex on a man (18+)
Sexual Behavior - Average number of male oral sex partners in lifetime (18+)
Sexual Behavior - People using protection when performing oral sex (%)
Sexual Behavior - Average number of times people have vaginal or anal sex a year
Sexual Behavior - People having sex without condom (%)
Sexual Behavior - Average number of male sex partners in lifetime (females 18+)
Sexual Behavior - Average number of male vaginal sex partners in lifetime (females 18+)
Sexual Behavior - Average number of female sex partners in lifetime (females 18+)
Sexual Behavior - Circumcised males 18+ (%)
Sleep Disorders - Average hours sleeping at night
Sleep Disorders - People that has trouble sleeping (%)
Smoking-Cigarette Use - People smoking cigarettes (%)
Taste & Smell - People 40+ having problems with smell (%)
Taste & Smell - People 40+ having problems with taste (%)
Taste & Smell - People 40+ that ever had wisdom teeth removed (%)
Taste & Smell - People 40+ that ever had tonsils teeth removed (%)
Taste & Smell - People 40+ that ever had a loss of consciousness because of a head injury (%)
Taste & Smell - People 40+ that ever had a broken nose or other serious injury to face or skull (%)
Taste & Smell - People 40+ that ever had two or more sinus infections (%)
Weight - Average height (inches)
Weight - Average weight (pounds)
Weight - Average BMI
Weight - People that are obese (%)
Weight - People that ever were obese (%)
Weight - People trying to lose weight (%)
According to our research of Virginia and other state lists, there were 37 registered sex offenders living in Annandale, Virginia as of April 27, 2024 . The ratio of all residents to sex offenders in Annandale is 1,172 to 1.The ratio of registered sex offenders to all residents in this city is much lower than the state average.
Latest news from Annandale, VA collected exclusively by city-data.com from local newspapers, TV, and radio stations
Annandale, VA City Guides: Ancestries: German (3.3%), Ethiopian (3.0%), Afghan (2.8%), Irish (2.7%), American (2.7%), English (1.9%).
Current Local Time:
Land area: 13.8 square miles.
Population density: 2,971 people per square mile (average).
18,453 residents are foreign born (19.6% Latin America , 18.7% Asia ).
This place:
43.9%Virginia:
12.6%
Median real estate property taxes paid for housing units with mortgages in 2022: $6,259 (1.0%)Median real estate property taxes paid for housing units with no mortgage in 2022: $6,440 (1.1%)
Nearest city with pop. 200,000+: Washington, DC
Nearest city with pop. 1,000,000+: Philadelphia, PA
Nearest cities:
Latitude: 38.83 N, Longitude: 77.21 W
Daytime population change due to commuting: -6,029 (-14.3%)Workers who live and work in this place: 7,136 (31.2%)
Property values in Annandale, VA
Unemployment in December 2023:
Most common occupations in Annandale, VA (%)
Both Males Females
Computer specialists (8.4%)
Other management occupations, except farmers and farm managers (6.4%)
Other office and administrative support workers, including supervisors (4.2%)
Other sales and related occupations, including supervisors (3.9%)
Secretaries and administrative assistants (3.7%)
Building and grounds cleaning and maintenance occupations (3.7%)
Accountants and auditors (3.0%)
Computer specialists (11.2%)
Other management occupations, except farmers and farm managers (7.6%)
Other sales and related occupations, including supervisors (4.4%)
Engineers (3.3%)
Accountants and auditors (2.7%)
Building and grounds cleaning and maintenance occupations (2.6%)
Sales representatives, services, wholesale and manufacturing (2.6%)
Secretaries and administrative assistants (7.4%)
Other office and administrative support workers, including supervisors (6.0%)
Computer specialists (5.3%)
Other management occupations, except farmers and farm managers (5.0%)
Building and grounds cleaning and maintenance occupations (4.8%)
Preschool, kindergarten, elementary, and middle school teachers (4.2%)
Other sales and related occupations, including supervisors (3.4%)
Tornado activity:
Annandale-area historical tornado activity is above Virginia state average. It is 9% greater than the overall U.S. average.
On 4/28/2002, a category F4 (max. wind speeds 207-260 mph) tornado 19.7 miles away from the Annandale place center killed 3 people and injured 122 people and caused $124 million in damages.
On 4/1/1973, a category F3 (max. wind speeds 158-206 mph) tornado 3.3 miles away from the place center injured 37 people and caused between $5,000,000 and $50,000,000 in damages.
Earthquake activity:
Annandale-area historical earthquake activity is significantly above Virginia state average. It is 56% smaller than the overall U.S. average. On 8/23/2011 at 17:51:04, a magnitude 5.8 (5.8 MW, Depth: 3.7 mi, Class: Moderate, Intensity: VI - VII) earthquake occurred 75.1 miles away from the city center On 8/25/2011 at 05:07:52, a magnitude 4.5 (4.5 ML, Depth: 4.2 mi, Class: Light, Intensity: IV - V) earthquake occurred 73.8 miles away from Annandale center On 12/9/2003 at 20:59:18, a magnitude 4.5 (4.5 ML, Depth: 6.2 mi) earthquake occurred 87.8 miles away from the city center On 12/9/2003 at 20:59:14, a magnitude 4.5 (4.5 MB, 4.5 LG) earthquake occurred 94.1 miles away from the city center On 1/16/1994 at 01:49:16, a magnitude 4.6 (4.6 MB, 4.6 LG, Depth: 3.1 mi) earthquake occurred 120.9 miles away from Annandale center On 9/25/1998 at 19:52:52, a magnitude 5.2 (4.8 MB, 4.3 MS, 5.2 LG, 4.5 MW, Depth: 3.1 mi) earthquake occurred 249.2 miles away from the city center Magnitude types: regional Lg-wave magnitude (LG), body-wave magnitude (MB), local magnitude (ML), surface-wave magnitude (MS), moment magnitude (MW) Natural disasters: The number of natural disasters in Fairfax County (15) is near the US average (15).Major Disasters (Presidential) Declared: 12Emergencies Declared: 3Winter Storms: 5, Hurricanes: 4, Snowstorms: 3, Storms: 2, Tropical Storms: 2, Blizzard: 1, Flood: 1, Tornado: 1, Wind: 1, Other: 1 (Note: some incidents may be assigned to more than one category). Hospitals and medical centers in Annandale: CRI QUEEN ELIZABETH ICF (8518 QUEEN ELIZABETH BLVD) AMEDISYS HOME HEALTH OF ANNANDALE (7857 HERITAGE DRIVE, SUITE 200)
PAVILION MEDICAL HOME CARE AND STAFFING, LLC (4115 ANNANDALE ROAD, SUITE 202)
PROFESSIONAL HEALTHCARE RESOUR (7619 LITTLE RIVER TURNPIKE, SUITE 600)
GOLDEN LIVINGCENTER-SLEEPY HOLLOW (6700 COLUMBIA PK)
LEEWOOD HEALTHCARE CENTER (7120 BRADDOCK ROAD)
Amtrak stations near Annandale: 9 miles: ALEXANDRIA (110 CALLAHAN DR.) Services: ticket office, partially wheelchair accessible, enclosed waiting area, public restrooms, public payphones, vending machines, ATM, free short-term parking, free long-term parking, call for car rental service, call for taxi service, public transit connection.
9 miles: LORTON (AUTO-TRAIN) (LORTON, 8006 LORTON RD.) Services: ticket office, fully wheelchair accessible, enclosed waiting area, public restrooms, public payphones, vending machines, free short-term parking, call for taxi service.
12 miles: WASHINGTON (50 MASSACHUSETTS AVE. N.E.) Services: ticket office, fully wheelchair accessible, enclosed waiting area, public restrooms, public payphones, full-service food facilities and snack bar, ATM, paid short-term parking, paid long-term parking, car rental agency, taxi stand, public transit connection.
Colleges/Universities in Annandale: Northern Virginia Community College Full-time enrollment: 35,721; Location: 4001 Wakefield Chapel Rd; Public; Website: www.nvcc.edu)
Westwood College-Annandale Full-time enrollment: 562; Location: 7619 Little River Turnpike, 5th Floor; Private, for-profit; Website: www.westwood.edu)
Cosmopolitan Beauty and Tech School Full-time enrollment: 107; Location: 4201 John Marr Drive, Suite 206; Private, for-profit; Website: www.cosmobts.com)
Springfield Beauty Academy Full-time enrollment: 59; Location: 4223 Annandale Rd; Private, for-profit; Website: springfieldbeautyacademy.org/about-us/)
Other colleges/universities with over 2000 students near Annandale:
Medtech Institute (about 4 miles; Falls Church, VA ; Full-time enrollment: 2,900)
George Mason University (about 6 miles; Fairfax, VA ; FT enrollment: 26,002)
Stratford University (about 7 miles; Fairfax, VA ; FT enrollment: 2,570)
Marymount University (about 7 miles; Arlington, VA ; FT enrollment: 3,361)
Strayer University-Virginia (about 8 miles; Arlington, VA ; FT enrollment: 7,005)
Georgetown University (about 10 miles; Washington, DC ; FT enrollment: 12,535)
American University (about 10 miles; Washington, DC ; FT enrollment: 9,850)
Public high school in Annandale: ANNANDALE HIGH Students: 2,443, Location: 4700 MEDFORD DR, Grades: 9-12)Private high school in Annandale: PHILLIPS SCHOOL-ANNANDALE Students: 170, Location: 7010 BRADDOCK RD, Grades: 2-12)
Public elementary/middle schools in Annandale: POE MIDDLE Students: 1,167, Location: 7000 CINDY LN, Grades: 6-8)CANTERBURY WOODS ELEM Students: 725, Location: 4910 WILLET DR, Grades: PK-6)ANNANDALE TERRACE ELEM Students: 674, Location: 7604 HERALD ST, Grades: PK-5)BRADDOCK ELEM Students: 582, Location: 7825 HERITAGE DR, Grades: PK-5)COLUMBIA ELEM Students: 377, Location: 6720 ALPINE DR, Grades: PK-5)CAMELOT ELEM Location: 8100 GUINEVERE DR, Grades: PK-6)
MASON CREST ELEM Location: 3705 CREST DR, Grades: PK-5)
Private elementary/middle schools in Annandale: WESTMINSTER SCHOOL Students: 265, Location: 3819 GALLOWS RD, Grades: PK-8)
MONTESSORI SCHOOL OF NORTHERN VIRGINIA Students: 229, Location: 6820 PACIFIC LN, Grades: PK-6)
ST MICHAEL SCHOOL Students: 201, Location: 7401 SAINT MICHAELS LN, Grades: PK-8)
ST AMBROSE SCHOOL Students: 190, Location: 3827 WOODBURN RD, Grades: KG-8)
KENWOOD SCHOOL Students: 138, Location: 4955 SUNSET LN, Grades: PK-4)
PINECREST SCHOOL Students: 84, Location: 7209 QUIET COVE, Grades: PK-6)
See full list of schools located in Annandale
Notable locations in Annandale: (A) , Newton C Edwards Amphitheater (B) , Springfield Professional Center (C) , Annandale Business Center (D) , Fairfax County Support Bureau (E) , Fairfax County Fire and Rescue Department Station 8 Annandale (F) , George Mason Regional Library (G) , Sleepy Hollow Community Center (H) , Hidden Oaks Nature Center (I) , Fairfax County Fairfax House (J) , Manson Government Center (K) , Annandale District Government Center (L) , Fairfax County Police Station Number 4 (M) , Fairfax County Police Academy (N) , Phi Air Medical Ambulance (O) , Fairfax County Police Department Communications Traffic and Administrative Support (P) . Display/hide their locations on the map
Shopping Centers: (1) , Bradlick Shopping Center (2) , Annandale Shopping Center (3) , Heritage Mall Shopping Center (4) . Display/hide their locations on the map
Churches in Annandale include: (A) , Calvary Church of the Nazarene (B) , Eckankar Center of Northern Virginia (C) , Holy Spirit Wesleyan Church (D) , Northern Virginia Korean Presbyterian Church (E) , Annandale United Methodist Church (F) , Bible Baptist Church (G) , Annandale Church of Christ (H) , Braddock Hills Wesleyan Church (I) . Display/hide their locations on the map
Cemeteries: (1) , Gooding Family Cemetery (2) , Pleasant Valley Memorial Park (3) . Display/hide their locations on the map
Streams, rivers, and creeks: (A) , Turkey Run (B) . Display/hide their locations on the map
Parks in Annandale include: (1) , Annandale Community Park (2) , Woodburn Road Park (3) , Wakefield Park (4) , Valley Crest Park (5) , Mill Creek Park (6) , Mason District Park (7) , Accotink Stream Valley Park (8) , Wilburdale Park (9) . Display/hide their locations on the map
Tourist attractions: (1) , G-Force Enterprises (Amusement & Theme Parks; 7221 Beverly Street) (2) , Laser Skermish Of Washington D.c (Amusement & Theme Parks; 3425 Holly Rd) (3) , Amf Annandale Lanes (Amusement & Theme Parks; 4245 Markham Street) (4) . Display/hide their approximate locations on the map
Hotel: (1) . Display/hide its approximate location on the map
Court: (1) . Display/hide its approximate location on the map
Birthplace of: Bill Hamid - Soccer player, Carl Strong - Soccer player, Nick Grant - College basketball player (Drake Bulldogs).
Fairfax County has a predicted average indoor radon screening level greater than 4 pCi/L (pico curies per liter) - Highest Potential Drinking water stations with addresses in Annandale that have no violations reported:
RELAX INN-KING GEORGE (Population served: 25, Primary Water Source Type: Groundwater)
Average household size: This place:
2.9 peopleVirginia:
2.5 people
Percentage of family households: This place:
69.0%Whole state:
67.0%
Percentage of households with unmarried partners: This place:
5.1%Whole state:
5.7%
Likely homosexual households (counted as self-reported same-sex unmarried-partner households)
Lesbian couples: 0.3% of all households Gay men: 0.6% of all households
312 people in nursing facilities/skilled-nursing facilities in 2010people in group homes intended for adults in 2010People in group quarters in Annandale in 2000:
347 people in nursing homes
120 people in homes for the mentally retarded
14 people in religious group quarters
10 people in other noninstitutional group quarters
6 people in homes for the mentally ill
Banks with most branches in Annandale (2011 data):
Capital One, National Association: Turnpike Plaza Shopping Center Branc, Bradlick Shopping Center Branch, Annandale Branch. Info updated 2011/07/01: Bank assets: $133,477.8 mil, Deposits: $97,063.7 mil, headquarters in Mclean, VA, positive income , 984 total offices , Holding Company: Capital One Financial Corporation
Wells Fargo Bank, National Association: Annandale- John Marr at 4260 John Marr Drive, branch established on 1976/03/15; Annandale- Little River at 7620 Little River Turnpike, branch established on 1952/01/01. Info updated 2011/04/05: Bank assets: $1,161,490.0 mil, Deposits: $905,653.0 mil, headquarters in Sioux Falls, SD, positive income , 6395 total offices , Holding Company: Wells Fargo & Company
SunTrust Bank: Annandale Branch at 7617 Little River Turnpike, branch established on 1969/12/15; Annandale East Branch at 4250 John Marr Drive, branch established on 1935/11/13. Info updated 2010/05/27: Bank assets: $171,291.7 mil, Deposits: $129,833.2 mil, headquarters in Atlanta, GA, positive income , Commercial Lending Specialization, 1716 total offices , Holding Company: Suntrust Banks, Inc.
Bank of America, National Association: Columbia Pike Branch at 7220 Columbia Pike, branch established on 1971/03/01; Annandale Branch at 7400 Little River Turnpike, branch established on 1961/12/01. Info updated 2009/11/18: Bank assets: $1,451,969.3 mil, Deposits: $1,077,176.8 mil, headquarters in Charlotte, NC, positive income , 5782 total offices , Holding Company: Bank Of America Corporation
PNC Bank, National Association: Annandale Office at 6950 Braddock Road, branch established on 2001/12/21. Info updated 2012/03/20: Bank assets: $263,309.6 mil, Deposits: $197,343.0 mil, headquarters in Wilmington, DE, positive income , Commercial Lending Specialization, 3085 total offices , Holding Company: Pnc Financial Services Group, Inc., The
Burke & Herbert Bank & Trust Company: Annandale Road Branch at 4235 Annandale Road, branch established on 2006/12/04. Info updated 2010/05/12: Bank assets: $2,461.7 mil, Deposits: $2,022.3 mil, headquarters in Alexandria, VA, positive income , Commercial Lending Specialization, 25 total offices
Branch Banking and Trust Company: Annandale Branch at 4401 Backlick Rd, branch established on 1972/03/13. Info updated 2010/03/29: Bank assets: $168,867.6 mil, Deposits: $127,549.5 mil, headquarters in Winston Salem, NC, positive income , Commercial Lending Specialization, 1793 total offices , Holding Company: Bb&T Corporation
United Central Bank: Annadale Branch at 7140 Little River, branch established on 2008/10/09. Info updated 2009/08/04: Bank assets: $2,348.5 mil, Deposits: $2,060.1 mil, headquarters in Garland, TX, negative income in the last year , Commercial Lending Specialization, 30 total offices , Holding Company: Central Bancorp, Inc.
Woori America Bank: Annandale Branch at 4231 Markham Street, Units F&G, branch established on 2002/07/22. Info updated 2012/04/03: Bank assets: $939.4 mil, Deposits: $822.6 mil, headquarters in New York, NY, positive income , Commercial Lending Specialization, 18 total offices , Holding Company: Woori Finance Holdings Co., Ltd.
5 other banks with 5 local branches
For population 15 years and over in Annandale:
Never married: 37.0%Now married: 46.8%Separated: 1.7%Widowed: 5.9%Divorced: 8.6% For population 25 years and over in Annandale:
High school or higher: 85.2%Bachelor's degree or higher: 44.0%Graduate or professional degree: 17.7%Unemployed: 2.9%Mean travel time to work (commute): 20.9 minutes
Education Gini index (Inequality in education) Here:
15.8Virginia average:
12.1
Religion statistics for Annandale, VA (based on Fairfax County data)
Religion Adherents Congregations Catholic 184,183 29 Evangelical Protestant 103,522 316 Mainline Protestant 100,525 146 Other 91,925 119 Orthodox 4,694 8 Black Protestant 1,509 9 None 595,368 -
Source: Clifford Grammich, Kirk Hadaway, Richard Houseal, Dale E.Jones, Alexei Krindatch, Richie Stanley and Richard H.Taylor. 2012. 2010 U.S.Religion Census: Religious Congregations & Membership Study. Association of Statisticians of American Religious Bodies. Jones, Dale E., et al. 2002. Congregations and Membership in the United States 2000. Nashville, TN: Glenmary Research Center. Graphs represent county-level data
Food Environment Statistics: Number of grocery stores : 182Fairfax County :
1.81 / 10,000 pop.Virginia :
2.03 / 10,000 pop.
Number of supercenters and club stores : 3This county :
0.03 / 10,000 pop.State :
0.17 / 10,000 pop.
Number of convenience stores (no gas) : 130Fairfax County :
1.29 / 10,000 pop.Virginia :
1.43 / 10,000 pop.
Number of convenience stores (with gas) : 163Fairfax County :
1.62 / 10,000 pop.State :
4.03 / 10,000 pop.
Number of full-service restaurants : 693Here :
6.90 / 10,000 pop.State :
7.65 / 10,000 pop.
Adult diabetes rate : This county :
7.2%Virginia :
9.3%
Adult obesity rate : Fairfax County :
22.2%Virginia :
26.7%
Low-income preschool obesity rate : This county :
27.6%State :
18.6%
Health and Nutrition: Healthy diet rate : Annandale:
52.0%State:
50.6%
Average overall health of teeth and gums : This city:
49.8%Virginia:
48.6%
People feeling badly about themselves : This city:
19.3%Virginia:
20.2%
People not drinking alcohol at all : This city:
12.3%State:
10.5%
Average hours sleeping at night : Overweight people : Annandale:
30.9%Virginia:
33.5%
General health condition : This city:
57.6%State:
57.4%
Average condition of hearing : This city:
80.4%Virginia:
80.5%
More about Health and Nutrition of Annandale, VA Residents
8.87% of this county's 2021 resident taxpayers lived in other counties in 2020 ($108,323 average adjusted gross income )
Here:
8.87%Virginia average:
10.16%
0.19% of residents moved from foreign countries ($2,634 average AGI )Fairfax County:
0.19%Virginia average:
0.12%
Top counties from which taxpayers relocated into this county between 2020 and 2021:
10.12% of this county's 2020 resident taxpayers moved to other counties in 2021 ($118,643 average adjusted gross income )
Here:
10.12%Virginia average:
10.20%
0.16% of residents moved to foreign countries ($2,238 average AGI )Fairfax County:
0.16%Virginia average:
0.09%
Top counties to which taxpayers relocated from this county between 2020 and 2021:
Businesses in Annandale, VA
Name Count Name Count
7-Eleven 5 McDonald's 2 AMF Bowling 1 Nike 2 AT&T 1 Papa John's Pizza 1 Advance Auto Parts 2 Pizza Hut 1 Blockbuster 1 Popeyes 1 Burger King 1 Quiznos 1 CVS 2 RadioShack 1 Cricket Wireless 2 Safeway 1 DHL 1 Sears 1 Domino's Pizza 1 Starbucks 2 FedEx 6 Taco Bell 1 Giant 2 The Room Place 1 H&R Block 1 U-Haul 1 KFC 1 UPS 5 Kmart 1 Vons 1 MasterBrand Cabinets 2 Wendy's 2
Strongest AM radio stations in Annandale:
WUST (1120 AM; daytime; 20 kW; WASHINGTON, DC)
WFAX (1220 AM; 5 kW; FALLS CHURCH, VA; Owner: NEWCOMB BROADCASTING CORP.)
WTEM (980 AM; 50 kW; WASHINGTON, DC; Owner: AMFM RADIO LICENSES, L.L.C.)
WABS (780 AM; daytime; 5 kW; ARLINGTON, VA; Owner: SALEM MEDIA OF VIRGINIA, INC.)
WKDL (730 AM; 8 kW; ALEXANDRIA, VA; Owner: MEGA COMMUNICATIONS OF ALEXANDRIA LICENSEE, LLC)
WZHF (1390 AM; 5 kW; ARLINGTON, VA; Owner: WAY BROADCASTING, INC.)
WTOP (1500 AM; 50 kW; WASHINGTON, DC; Owner: BONNEVILLE HOLDING COMPANY)
WDCT (1310 AM; 5 kW; FAIRFAX, VA; Owner: FAMILY RADIO, LTD.)
WPGC (1580 AM; 50 kW; MORNINGSIDE, MD; Owner: INFINITY WPGC(AM), INC.)
WMET (1150 AM; 50 kW; GAITHERSBURG, MD; Owner: BELTWAY ACQUISITION CORPORATION)
WWGB (1030 AM; daytime; 50 kW; INDIAN HEAD, MD; Owner: GOOD BODY MEDIA, LLC)
WMAL (630 AM; 5 kW; WASHINGTON, DC; Owner: WMAL, INC.)
WKCW (1420 AM; 50 kW; WARRENTON, VA; Owner: WAY BROADCASTING, INC.)
Strongest FM radio stations in Annandale:
WJFK-FM (106.7 FM; MANASSAS, VA; Owner: INFINITY BROADCASTING CORP. OF WASHINGTON, DC)
WJZW (105.9 FM; WOODBRIDGE, VA; Owner: WMAL, INC.)
WMZQ-FM (98.7 FM; WASHINGTON, DC; Owner: AMFM RADIO LICENSES, L.L.C.)
WETA (90.9 FM; WASHINGTON, DC; Owner: GREATER WASHINGTON EDUCATIONAL TELECOMMUNICATIONS ASSN.)
WGTS (91.9 FM; TAKOMA PARK, MD; Owner: COLUMBIA UNION COLLEGE BROADCASTING, INC.)
WAVA (105.1 FM; ARLINGTON, VA; Owner: SALEM MEDIA OF VIRGINIA, INC.)
WRQX (107.3 FM; WASHINGTON, DC; Owner: WMAL, INC.)
WHUR-FM (96.3 FM; WASHINGTON, DC; Owner: THE HOWARD UNIVERSITY)
WARW (94.7 FM; BETHESDA, MD; Owner: INFINITY BROADCASTING OPERATIONS, INC.)
WASH (97.1 FM; WASHINGTON, DC; Owner: AMFM RADIO LICENSES, L.L.C.)
WKYS (93.9 FM; WASHINGTON, DC; Owner: RADIO ONE LICENSES, LLC)
WIHT (99.5 FM; WASHINGTON, DC; Owner: AMFM RADIO LICENSES, L.L.C.)
WGMS-FM (103.5 FM; WASHINGTON, DC; Owner: BONNEVILLE HOLDING COMPANY)
WAMU (88.5 FM; WASHINGTON, DC; Owner: THE EXEC. COMM. OF THE BD. OF TRUSTEES OF AMERICAN UNIV.)
WMMJ (102.3 FM; BETHESDA, MD; Owner: RADIO ONE LICENSES, LLC)
WWDC-FM (101.1 FM; WASHINGTON, DC; Owner: AMFM RADIO LICENSES, L.L.C.)
WPFW (89.3 FM; WASHINGTON, DC; Owner: PACIFICA FOUNDATION, INC.)
WCSP-FM (90.1 FM; WASHINGTON, DC; Owner: NATIONAL CABLE SATELLITE CORPORATION)
WBIG-FM (100.3 FM; WASHINGTON, DC; Owner: AMFM RADIO LICENSES, L.L.C.)
WPGC-FM (95.5 FM; MORNINGSIDE, MD; Owner: INFINITY BROADCASTING CORPORATION OF MARYLAND)
TV broadcast stations around Annandale:
WNVC (Channel 56; FAIRFAX, VA; Owner: COMMONWEALTH PUBLIC BROADCASTING CORPORATION)
WJLA-TV (Channel 7; WASHINGTON, DC; Owner: ACC LICENSEE, INC.)
WUSA (Channel 9; WASHINGTON, DC; Owner: THE DETROIT NEWS, INC.)
WTTG (Channel 5; WASHINGTON, DC; Owner: FOX TELEVISION STATIONS, INC.)
WPXW (Channel 66; MANASSAS, VA; Owner: PAXSON WASHINGTON LICENSE, INC.)
WETA-TV (Channel 26; WASHINGTON, DC; Owner: THE GREATER WASHINGTON ED TELECOMM. ASSOC)
WDCA (Channel 20; WASHINGTON, DC; Owner: FOX TELEVISION STATIONS, INC.)
WHUT-TV (Channel 32; WASHINGTON, DC; Owner: HOWARD UNIVERSITY)
WRC-TV (Channel 4; WASHINGTON, DC; Owner: NBC SUBSIDIARY (WRC-TV), INC.)
W42BE (Channel 42; FAIRFAX, VA; Owner: FAIRFAX LOW POWER CO.)
WBDC-TV (Channel 50; WASHINGTON, DC; Owner: WBDC BROADCASTING, INC.)
W28BY (Channel 63; BALTIMORE, MD; Owner: INFORMATION SUPER STATION, L.L.C.)
WMDO-CA (Channel 30; WASHINGTON, DC; Owner: ENTRAVISION HOLDINGS, LLC)
WNVT (Channel 53; GOLDVEIN, VA; Owner: COMMONWEALTH PUBLIC BROADCASTING CORPORATION)
WZDC-LP (Channel 64; WASHINGTON, DC; Owner: ONDA CAPITAL, INC.)
WIAV-LP (Channel 58; WASHINGTON, DC; Owner: ASIAVISION, INC.)
WKRP-LP (Channel 42; WASHINGTON, DC; Owner: CAPITAL MEDIA, LLC)
WMPT (Channel 22; ANNAPOLIS, MD; Owner: MARYLAND PUBLIC BROADCASTING COMMISSION)
WBFF (Channel 45; BALTIMORE, MD; Owner: CHESAPEAKE TELEVISION LICENSEE, LLC)
WNUV (Channel 54; BALTIMORE, MD; Owner: BALTIMORE (WNUV-TV) LICENSEE, INC.)
WUTB (Channel 24; BALTIMORE, MD; Owner: FOX TELEVISION STATIONS, INC.)
National Bridge Inventory (NBI) Statistics 70 Number of bridges472ft / 144m Total length $2,697,000 Total costs2,677,542 Total average daily traffic138,575 Total average daily truck traffic
New bridges - historical statistics
1 1920-1929 1 1930-1939 6 1960-1969 4 1970-1979 15 1980-1989 3 1990-1999 10 2000-2009 30 2010-2019
See full National Bridge Inventory statistics for Annandale, VA
Home Mortgage Disclosure Act Aggregated Statistics For Year 2009(Based on 8 full and 4 partial tracts) A) FHA, FSA/RHS & VA B) Conventional C) Refinancings D) Home Improvement Loans E) Loans on Dwellings For 5+ Families F) Non-occupant Loans on G) Loans On Manufactured Number Average Value Number Average Value Number Average Value Number Average Value Number Average Value Number Average Value Number Average Value
LOANS ORIGINATED 292 $329,887 476 $288,983 1,285 $295,164 48 $179,176 1 $31,780,000 98 $223,678 0 $0 APPLICATIONS APPROVED, NOT ACCEPTED 24 $320,123 35 $255,225 92 $302,715 9 $48,582 0 $0 11 $165,046 0 $0 APPLICATIONS DENIED 24 $352,103 66 $287,675 324 $313,870 26 $82,037 0 $0 47 $218,521 1 $10,000 APPLICATIONS WITHDRAWN 43 $323,209 78 $282,504 294 $320,774 12 $183,478 0 $0 22 $192,542 0 $0 FILES CLOSED FOR INCOMPLETENESS 9 $326,943 20 $276,406 76 $304,807 0 $0 0 $0 10 $155,400 0 $0
Aggregated Statistics For Year 2008(Based on 8 full and 4 partial tracts) A) FHA, FSA/RHS & VA B) Conventional C) Refinancings D) Home Improvement Loans E) Loans on Dwellings For 5+ Families F) Non-occupant Loans on G) Loans On Manufactured Number Average Value Number Average Value Number Average Value Number Average Value Number Average Value Number Average Value Number Average Value
LOANS ORIGINATED 169 $314,660 542 $299,628 592 $287,426 80 $125,122 1 $7,300,000 95 $227,597 0 $0 APPLICATIONS APPROVED, NOT ACCEPTED 18 $359,377 78 $333,200 117 $273,185 15 $163,268 0 $0 14 $193,739 0 $0 APPLICATIONS DENIED 28 $271,830 120 $324,808 373 $318,059 39 $114,340 0 $0 48 $239,169 1 $27,000 APPLICATIONS WITHDRAWN 25 $333,334 112 $308,560 201 $318,248 13 $151,116 0 $0 25 $225,818 0 $0 FILES CLOSED FOR INCOMPLETENESS 2 $199,015 30 $286,270 30 $373,444 4 $122,598 0 $0 7 $198,226 0 $0
Aggregated Statistics For Year 2007(Based on 8 full and 4 partial tracts) A) FHA, FSA/RHS & VA B) Conventional C) Refinancings D) Home Improvement Loans E) Loans on Dwellings For 5+ Families F) Non-occupant Loans on G) Loans On Manufactured Number Average Value Number Average Value Number Average Value Number Average Value Number Average Value Number Average Value Number Average Value
LOANS ORIGINATED 6 $287,752 770 $299,486 968 $291,130 123 $156,647 1 $3,017,320 89 $241,950 0 $0 APPLICATIONS APPROVED, NOT ACCEPTED 0 $0 106 $325,390 260 $284,346 30 $122,221 1 $7,000 20 $205,764 1 $43,000 APPLICATIONS DENIED 0 $0 191 $305,331 586 $339,753 75 $155,077 1 $7,000 35 $249,334 4 $34,802 APPLICATIONS WITHDRAWN 0 $0 97 $382,320 291 $316,483 23 $175,574 0 $0 24 $225,463 1 $15,000 FILES CLOSED FOR INCOMPLETENESS 0 $0 16 $354,435 88 $325,151 3 $96,057 0 $0 3 $304,697 0 $0
Aggregated Statistics For Year 2006(Based on 8 full and 4 partial tracts) A) FHA, FSA/RHS & VA B) Conventional C) Refinancings D) Home Improvement Loans E) Loans on Dwellings For 5+ Families F) Non-occupant Loans on G) Loans On Manufactured Number Average Value Number Average Value Number Average Value Number Average Value Number Average Value Number Average Value Number Average Value
LOANS ORIGINATED 6 $187,425 1,235 $279,382 1,281 $290,819 199 $158,371 3 $2,795,303 165 $247,924 1 $8,000 APPLICATIONS APPROVED, NOT ACCEPTED 0 $0 126 $288,153 251 $275,541 48 $136,692 0 $0 24 $242,320 1 $24,790 APPLICATIONS DENIED 1 $138,880 299 $266,561 419 $304,204 86 $140,637 0 $0 52 $284,580 1 $103,090 APPLICATIONS WITHDRAWN 1 $347,000 138 $297,225 351 $331,335 42 $185,987 0 $0 27 $314,385 0 $0 FILES CLOSED FOR INCOMPLETENESS 0 $0 29 $321,337 70 $283,026 8 $157,500 0 $0 9 $268,778 0 $0
Aggregated Statistics For Year 2005(Based on 8 full and 4 partial tracts) A) FHA, FSA/RHS & VA B) Conventional C) Refinancings D) Home Improvement Loans E) Loans on Dwellings For 5+ Families F) Non-occupant Loans on G) Loans On Manufactured Number Average Value Number Average Value Number Average Value Number Average Value Number Average Value Number Average Value Number Average Value
LOANS ORIGINATED 7 $205,390 1,839 $277,191 1,833 $285,881 191 $189,632 1 $137,000 285 $233,161 1 $150,000 APPLICATIONS APPROVED, NOT ACCEPTED 0 $0 189 $251,115 263 $258,938 40 $131,131 0 $0 30 $211,518 0 $0 APPLICATIONS DENIED 0 $0 400 $262,220 469 $283,584 85 $152,282 0 $0 62 $214,245 2 $137,285 APPLICATIONS WITHDRAWN 1 $302,930 154 $289,751 383 $287,206 47 $200,493 0 $0 40 $272,374 1 $34,420 FILES CLOSED FOR INCOMPLETENESS 0 $0 47 $270,885 98 $323,788 14 $136,309 0 $0 7 $218,599 0 $0
Aggregated Statistics For Year 2004(Based on 8 full and 4 partial tracts) A) FHA, FSA/RHS & VA B) Conventional C) Refinancings D) Home Improvement Loans E) Loans on Dwellings For 5+ Families F) Non-occupant Loans on G) Loans On Manufactured Number Average Value Number Average Value Number Average Value Number Average Value Number Average Value Number Average Value Number Average Value
LOANS ORIGINATED 39 $202,560 1,662 $250,562 2,015 $229,842 158 $127,496 1 $169,000 286 $190,285 3 $51,000 APPLICATIONS APPROVED, NOT ACCEPTED 4 $226,058 119 $251,442 258 $218,465 38 $102,202 0 $0 25 $162,171 1 $19,310 APPLICATIONS DENIED 5 $260,702 268 $227,752 411 $236,860 86 $100,903 0 $0 53 $211,571 2 $160,400 APPLICATIONS WITHDRAWN 2 $119,990 144 $259,646 348 $237,156 34 $168,231 2 $71,500 24 $247,808 0 $0 FILES CLOSED FOR INCOMPLETENESS 1 $143,180 38 $251,602 86 $252,397 12 $120,203 0 $0 3 $134,727 0 $0
Aggregated Statistics For Year 2003(Based on 8 full and 4 partial tracts) A) FHA, FSA/RHS & VA B) Conventional C) Refinancings D) Home Improvement Loans F) Non-occupant Loans on Number Average Value Number Average Value Number Average Value Number Average Value Number Average Value
LOANS ORIGINATED 80 $172,412 1,499 $221,924 4,796 $197,718 97 $67,527 299 $154,239 APPLICATIONS APPROVED, NOT ACCEPTED 1 $207,640 116 $210,686 523 $186,388 46 $52,074 23 $125,813 APPLICATIONS DENIED 3 $127,667 151 $221,900 558 $195,757 62 $56,134 49 $142,461 APPLICATIONS WITHDRAWN 5 $152,136 103 $254,564 468 $190,283 16 $90,765 37 $167,099 FILES CLOSED FOR INCOMPLETENESS 0 $0 27 $256,183 137 $216,090 7 $119,223 15 $181,301
Aggregated Statistics For Year 2002(Based on 8 full and 4 partial tracts) A) FHA, FSA/RHS & VA B) Conventional C) Refinancings D) Home Improvement Loans F) Non-occupant Loans on Number Average Value Number Average Value Number Average Value Number Average Value Number Average Value
LOANS ORIGINATED 133 $148,853 1,304 $186,451 3,095 $192,926 98 $62,572 187 $122,931 APPLICATIONS APPROVED, NOT ACCEPTED 3 $197,010 93 $183,936 279 $170,989 42 $55,288 22 $122,036 APPLICATIONS DENIED 14 $166,511 103 $152,049 383 $165,346 58 $42,683 27 $103,622 APPLICATIONS WITHDRAWN 5 $186,500 91 $214,997 344 $176,269 26 $67,838 24 $135,728 FILES CLOSED FOR INCOMPLETENESS 2 $123,945 29 $186,818 85 $206,446 4 $34,250 5 $141,734
Aggregated Statistics For Year 2001(Based on 8 full and 4 partial tracts) A) FHA, FSA/RHS & VA B) Conventional C) Refinancings D) Home Improvement Loans F) Non-occupant Loans on Number Average Value Number Average Value Number Average Value Number Average Value Number Average Value
LOANS ORIGINATED 196 $138,747 1,176 $173,680 1,982 $183,410 112 $38,894 95 $120,349 APPLICATIONS APPROVED, NOT ACCEPTED 4 $101,505 84 $168,392 155 $152,460 44 $56,277 7 $113,204 APPLICATIONS DENIED 8 $96,431 112 $149,282 293 $137,286 90 $38,532 27 $117,228 APPLICATIONS WITHDRAWN 6 $148,828 95 $176,630 296 $151,206 47 $46,681 13 $102,125 FILES CLOSED FOR INCOMPLETENESS 3 $106,667 16 $192,356 74 $141,440 15 $37,247 4 $58,595
Aggregated Statistics For Year 2000(Based on 8 full and 4 partial tracts) A) FHA, FSA/RHS & VA B) Conventional C) Refinancings D) Home Improvement Loans E) Loans on Dwellings For 5+ Families F) Non-occupant Loans on Number Average Value Number Average Value Number Average Value Number Average Value Number Average Value Number Average Value
LOANS ORIGINATED 181 $127,813 1,034 $156,054 351 $140,393 114 $38,482 1 $323,000 53 $96,286 APPLICATIONS APPROVED, NOT ACCEPTED 7 $138,307 71 $132,354 77 $113,260 31 $40,722 0 $0 7 $81,679 APPLICATIONS DENIED 15 $102,417 108 $145,607 207 $103,321 62 $39,540 1 $323,000 14 $53,138 APPLICATIONS WITHDRAWN 15 $127,965 75 $162,310 113 $93,771 17 $39,385 0 $0 8 $80,068 FILES CLOSED FOR INCOMPLETENESS 2 $71,500 15 $187,513 16 $131,156 6 $30,928 0 $0 2 $90,500
Aggregated Statistics For Year 1999(Based on 8 full and 4 partial tracts) A) FHA, FSA/RHS & VA B) Conventional C) Refinancings D) Home Improvement Loans F) Non-occupant Loans on Number Average Value Number Average Value Number Average Value Number Average Value Number Average Value
LOANS ORIGINATED 194 $134,721 950 $157,953 840 $143,411 126 $30,339 70 $104,666 APPLICATIONS APPROVED, NOT ACCEPTED 11 $144,943 51 $132,455 103 $121,520 29 $35,782 9 $75,532 APPLICATIONS DENIED 16 $142,652 77 $141,773 204 $121,600 59 $34,119 12 $97,578 APPLICATIONS WITHDRAWN 22 $127,695 66 $141,685 162 $118,430 27 $109,934 7 $95,457 FILES CLOSED FOR INCOMPLETENESS 2 $81,000 22 $151,668 41 $115,834 2 $39,755 5 $54,542
Detailed mortgage data for all 12 tracts in Annandale, VA
Private Mortgage Insurance Companies Aggregated Statistics For Year 2009(Based on 8 full and 4 partial tracts) A) Conventional B) Refinancings C) Non-occupant Loans on Number Average Value Number Average Value Number Average Value
LOANS ORIGINATED 78 $304,748 12 $369,096 0 $0 APPLICATIONS APPROVED, NOT ACCEPTED 19 $307,934 8 $355,015 0 $0 APPLICATIONS DENIED 11 $316,118 4 $310,780 1 $320,000 APPLICATIONS WITHDRAWN 3 $352,800 3 $407,470 0 $0 FILES CLOSED FOR INCOMPLETENESS 4 $188,750 1 $287,100 0 $0
Aggregated Statistics For Year 2008(Based on 8 full and 4 partial tracts) A) Conventional B) Refinancings C) Non-occupant Loans on Number Average Value Number Average Value Number Average Value
LOANS ORIGINATED 139 $296,228 27 $312,034 5 $336,452 APPLICATIONS APPROVED, NOT ACCEPTED 37 $309,860 16 $334,164 6 $308,070 APPLICATIONS DENIED 17 $305,728 4 $306,065 3 $333,047 APPLICATIONS WITHDRAWN 12 $291,420 1 $436,700 2 $148,500 FILES CLOSED FOR INCOMPLETENESS 4 $283,750 0 $0 0 $0
Aggregated Statistics For Year 2007(Based on 8 full and 4 partial tracts) A) Conventional B) Refinancings C) Non-occupant Loans on Number Average Value Number Average Value Number Average Value
LOANS ORIGINATED 97 $302,692 36 $355,363 4 $286,855 APPLICATIONS APPROVED, NOT ACCEPTED 13 $327,248 12 $388,783 3 $271,333 APPLICATIONS DENIED 3 $329,460 0 $0 0 $0 APPLICATIONS WITHDRAWN 2 $917,140 2 $439,010 0 $0 FILES CLOSED FOR INCOMPLETENESS 1 $350,000 2 $353,500 0 $0
Aggregated Statistics For Year 2006(Based on 8 full and 4 partial tracts) A) Conventional B) Refinancings C) Non-occupant Loans on Number Average Value Number Average Value Number Average Value
LOANS ORIGINATED 32 $371,855 17 $401,700 2 $391,635 APPLICATIONS APPROVED, NOT ACCEPTED 4 $418,810 2 $405,140 1 $404,000 APPLICATIONS DENIED 0 $0 2 $523,375 0 $0 APPLICATIONS WITHDRAWN 0 $0 4 $369,960 0 $0 FILES CLOSED FOR INCOMPLETENESS 0 $0 0 $0 0 $0
Aggregated Statistics For Year 2005(Based on 8 full and 4 partial tracts) A) Conventional B) Refinancings C) Non-occupant Loans on Number Average Value Number Average Value Number Average Value
LOANS ORIGINATED 68 $294,526 25 $317,856 7 $276,024 APPLICATIONS APPROVED, NOT ACCEPTED 14 $285,355 0 $0 0 $0 APPLICATIONS DENIED 1 $252,000 0 $0 0 $0 APPLICATIONS WITHDRAWN 4 $263,688 4 $352,105 0 $0 FILES CLOSED FOR INCOMPLETENESS 0 $0 0 $0 0 $0
Aggregated Statistics For Year 2004(Based on 8 full and 4 partial tracts) A) Conventional B) Refinancings C) Non-occupant Loans on Number Average Value Number Average Value Number Average Value
LOANS ORIGINATED 134 $249,446 46 $265,018 14 $197,890 APPLICATIONS APPROVED, NOT ACCEPTED 21 $234,538 25 $265,890 3 $153,333 APPLICATIONS DENIED 4 $240,250 2 $217,205 1 $126,000 APPLICATIONS WITHDRAWN 10 $265,254 3 $138,000 2 $221,500 FILES CLOSED FOR INCOMPLETENESS 2 $204,500 1 $295,000 0 $0
Aggregated Statistics For Year 2003(Based on 8 full and 4 partial tracts) A) Conventional B) Refinancings C) Non-occupant Loans on Number Average Value Number Average Value Number Average Value
LOANS ORIGINATED 196 $214,762 87 $197,535 15 $202,544 APPLICATIONS APPROVED, NOT ACCEPTED 28 $213,565 28 $245,127 4 $144,080 APPLICATIONS DENIED 6 $217,062 4 $207,605 2 $78,865 APPLICATIONS WITHDRAWN 16 $248,916 14 $231,730 1 $105,000 FILES CLOSED FOR INCOMPLETENESS 1 $92,000 0 $0 0 $0
Aggregated Statistics For Year 2002(Based on 8 full and 4 partial tracts) A) Conventional B) Refinancings C) Non-occupant Loans on Number Average Value Number Average Value Number Average Value
LOANS ORIGINATED 241 $186,266 66 $187,459 21 $134,402 APPLICATIONS APPROVED, NOT ACCEPTED 32 $196,607 24 $199,478 6 $106,333 APPLICATIONS DENIED 9 $207,394 3 $134,000 0 $0 APPLICATIONS WITHDRAWN 5 $133,148 5 $215,914 1 $105,000 FILES CLOSED FOR INCOMPLETENESS 0 $0 2 $341,520 0 $0
Aggregated Statistics For Year 2001(Based on 8 full and 4 partial tracts) A) Conventional B) Refinancings C) Non-occupant Loans on Number Average Value Number Average Value Number Average Value
LOANS ORIGINATED 224 $172,251 70 $197,981 15 $95,726 APPLICATIONS APPROVED, NOT ACCEPTED 26 $160,093 24 $194,094 2 $185,920 APPLICATIONS DENIED 8 $166,310 3 $184,473 3 $102,667 APPLICATIONS WITHDRAWN 1 $147,000 3 $197,283 0 $0 FILES CLOSED FOR INCOMPLETENESS 3 $138,000 0 $0 0 $0
Aggregated Statistics For Year 2000(Based on 8 full and 4 partial tracts) A) Conventional B) Refinancings C) Non-occupant Loans on Number Average Value Number Average Value Number Average Value
LOANS ORIGINATED 183 $172,437 21 $173,734 5 $107,910 APPLICATIONS APPROVED, NOT ACCEPTED 21 $188,687 7 $174,687 1 $82,370 APPLICATIONS DENIED 5 $177,800 0 $0 0 $0 APPLICATIONS WITHDRAWN 2 $179,500 0 $0 0 $0 FILES CLOSED FOR INCOMPLETENESS 1 $49,400 0 $0 0 $0
Aggregated Statistics For Year 1999(Based on 8 full and 4 partial tracts) A) Conventional B) Refinancings C) Non-occupant Loans on Number Average Value Number Average Value Number Average Value
LOANS ORIGINATED 245 $185,453 114 $170,248 11 $138,662 APPLICATIONS APPROVED, NOT ACCEPTED 18 $185,902 25 $170,671 0 $0 APPLICATIONS DENIED 13 $166,946 5 $188,708 0 $0 APPLICATIONS WITHDRAWN 11 $194,954 7 $169,949 0 $0 FILES CLOSED FOR INCOMPLETENESS 3 $120,263 16 $128,497 0 $0
Most common first names in Annandale, VA among deceased individuals Name Count Lived (average)
John 220 74.1 years Mary 215 81.2 years William 194 74.6 years Robert 151 71.6 years James 128 72.9 years Margaret 119 80.7 years Charles 118 73.9 years Helen 104 80.0 years Joseph 94 75.3 years George 88 74.4 years
Most common last names in Annandale, VA among deceased individuals Last name Count Lived (average)
Smith 54 76.3 years Johnson 43 75.0 years Kim 41 76.6 years Nguyen 33 76.8 years Williams 33 77.2 years Jones 33 78.4 years Taylor 31 76.4 years White 30 76.5 years Brown 29 76.4 years Miller 27 72.1 years
Annandale compared to Virginia state average:
Median house value above state average. Unemployed percentage significantly below state average. Black race population percentage below state average. Hispanic race population percentage above state average. Foreign-born population percentage significantly above state average. Length of stay since moving in significantly above state average. Percentage of population with a bachelor's degree or higher above state average.
#2 on the list of "Top 101 cities with the most residents born in Bolivia (population 500+)"
#16 on the list of "Top 101 cities with the most residents born in Vietnam (population 500+)"
#19 on the list of "Top 101 cities with the largest percentage population decrease from 2000 (population 5,000+)"
#38 on the list of "Top 100 cities with declining populations from 2000 to 2014 (pop. 5,000+)"
#48 on the list of "Top 101 cities with largest percentage of females in industries: other services, except public administration (population 5,000+)"
#60 on the list of "Top 101 cities with the most residents born in Sierra Leone (population 500+)"
#79 on the list of "Top 101 cities with the most residents born in Afghanistan (population 500+)"
#82 on the list of "Top 101 cities with the most residents born in South America (population 500+)"
#99 on the list of "Top 101 cities with the most residents born in Korea (population 500+)"
#3 on the list of "Top 101 counties with the largest number of children under 18 without health insurance coverage in 2000 (pop. 50,000+)"
#4 on the list of "Top 101 counties with the lowest lead air pollution readings in 2012 (µg/m3 )"
#5 on the list of "Top 101 counties with the largest number of people without health insurance coverage in 2000 (pop. 50,000+)"
#7 on the list of "Top 101 counties with the largest increase in the number of infant deaths per 1000 residents 2000-2006 to 2007-2013 (pop. 50,000+)"
#13 on the list of "Top 101 counties with the lowest number of deaths per 1000 residents 2007-2013 (pop. 50,000+)"
Top Patent Applicants
Barney Bishop (58)
Lane Bernard Scheiber (29)
Eugene M. Lee (22)
Narasimhan Sundaram (16)
Rajko Ilincic (16)
John David Terry (14)
Abraham Mcallister (13)
Dixon Cleveland (13)
Oliver Jojic (12)
Charles J. Kim (9)
Total of 512 patent applications in 2008-2024.


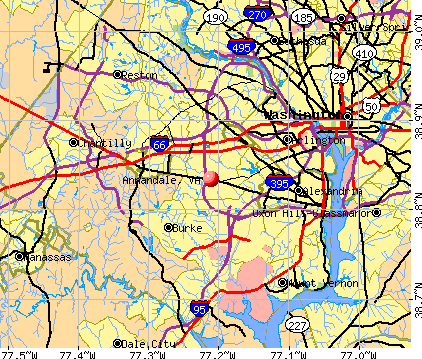


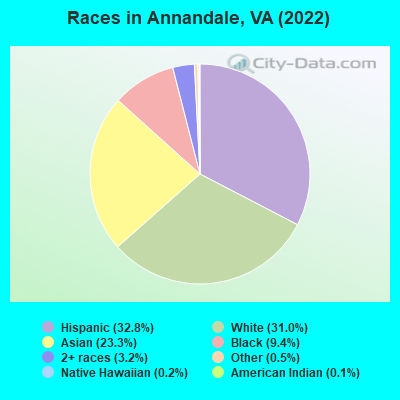
 Recent articles from our blog. Our writers, many of them Ph.D. graduates or candidates, create easy-to-read articles on a wide variety of topics.

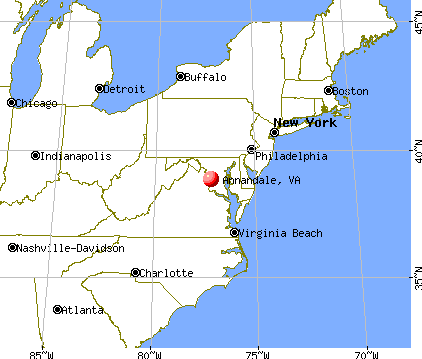
 (12.0 miles
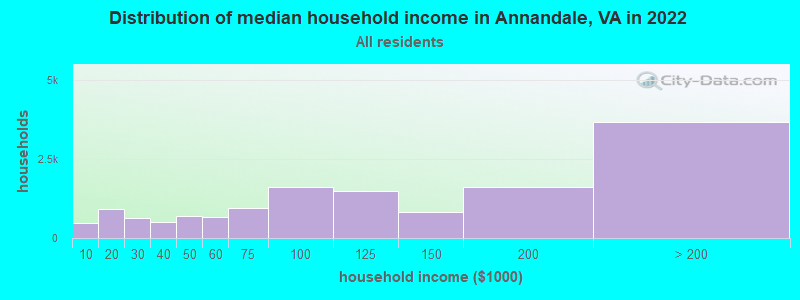
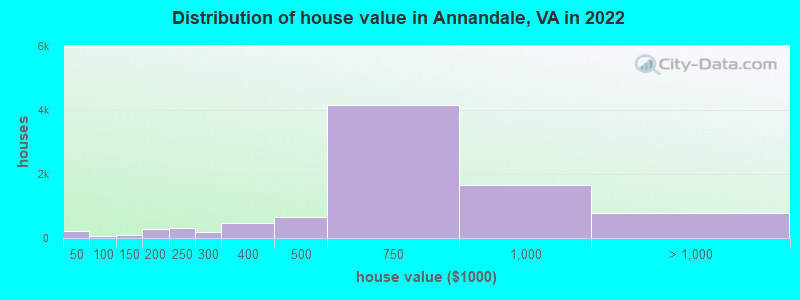

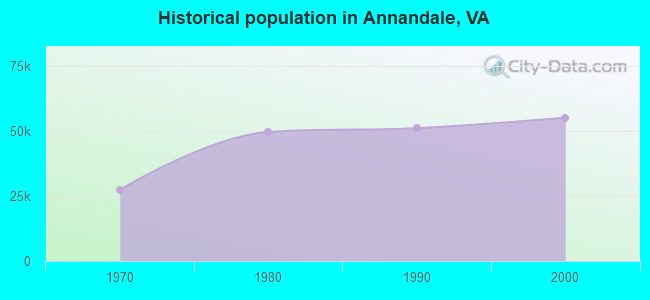
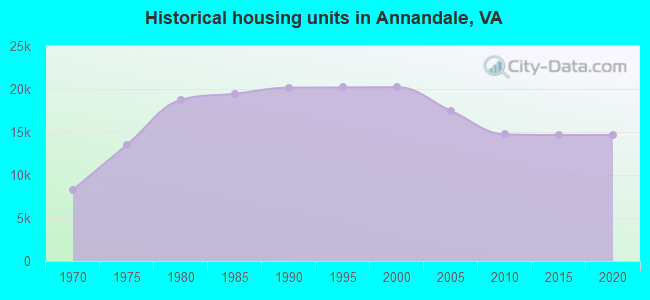
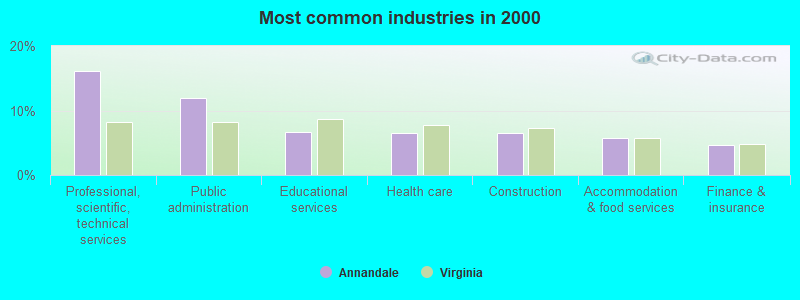
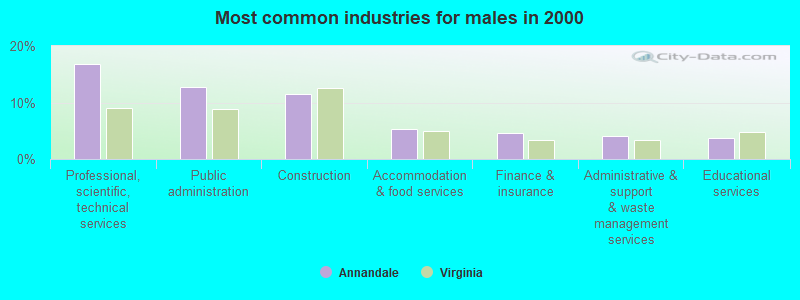
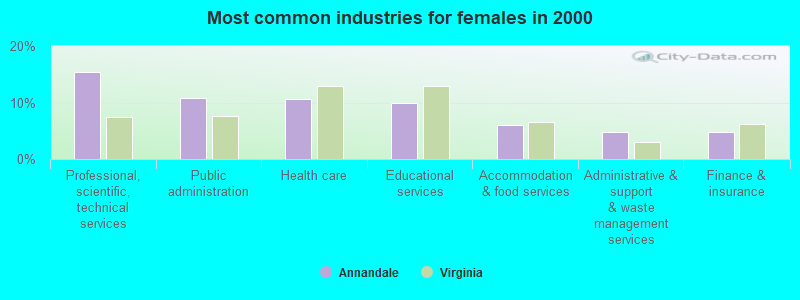
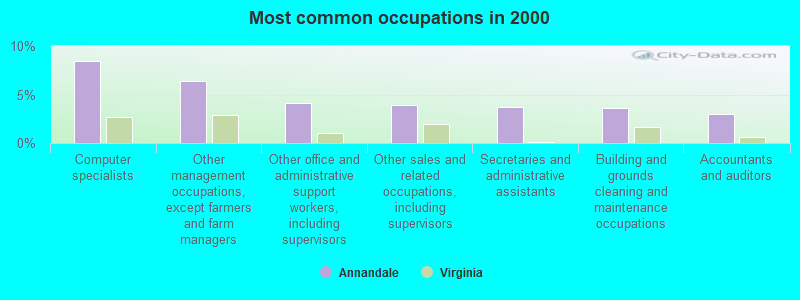
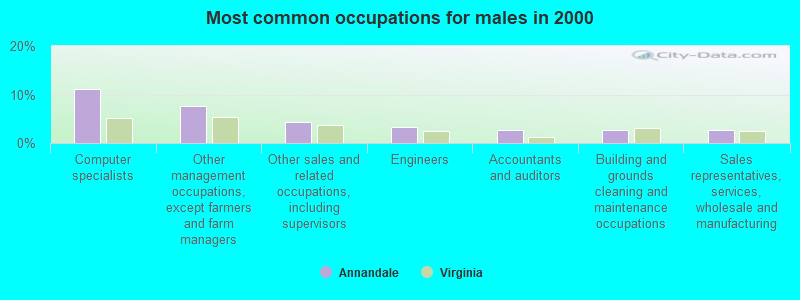

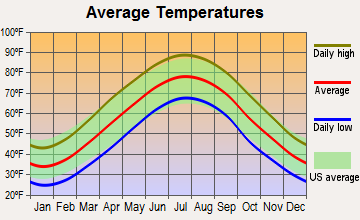
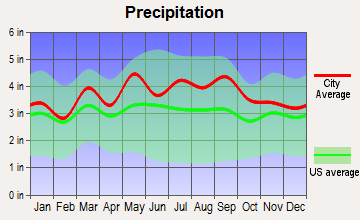
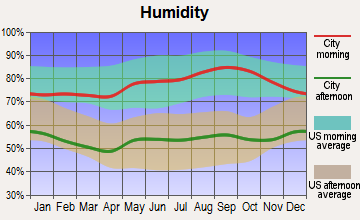
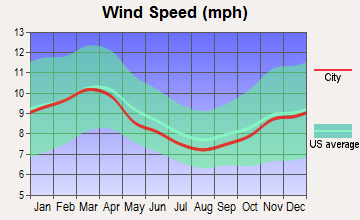
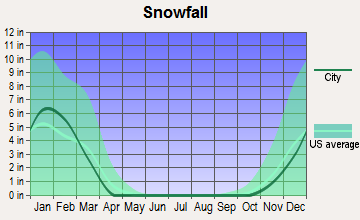
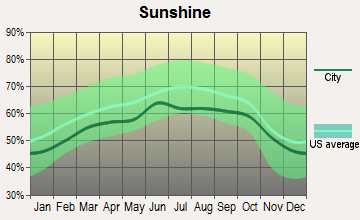
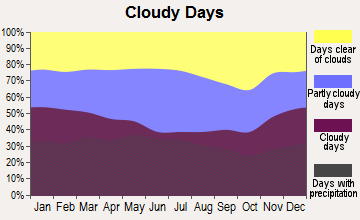
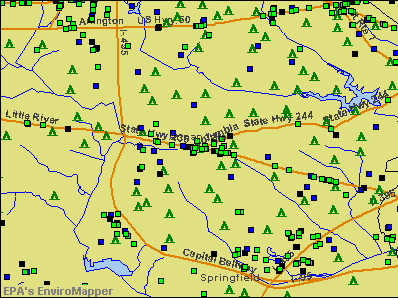

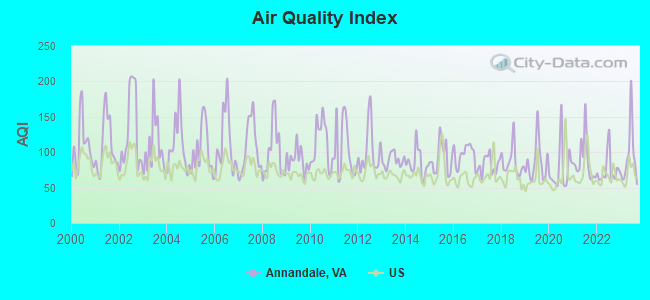
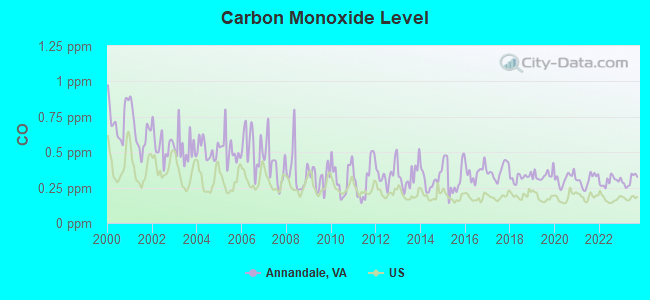

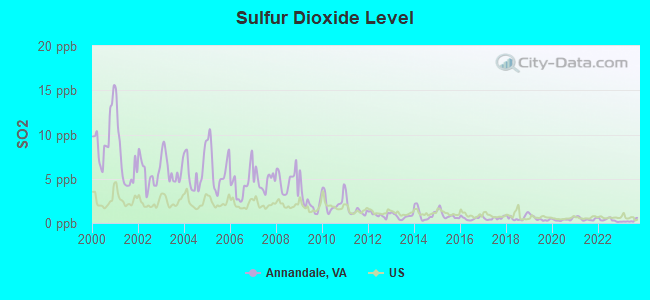
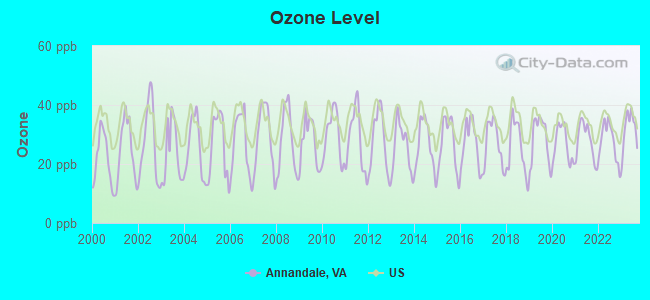
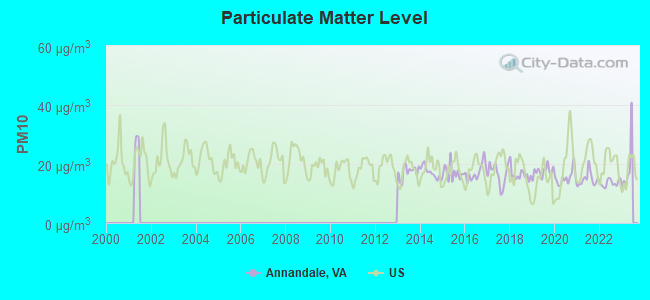
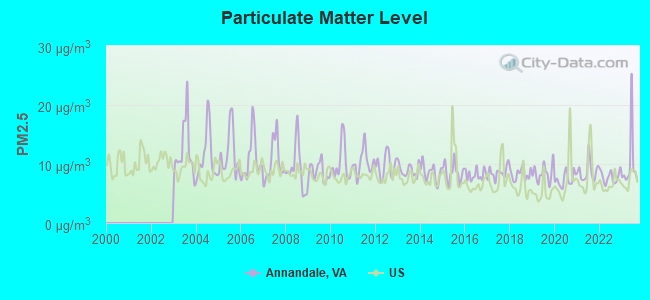
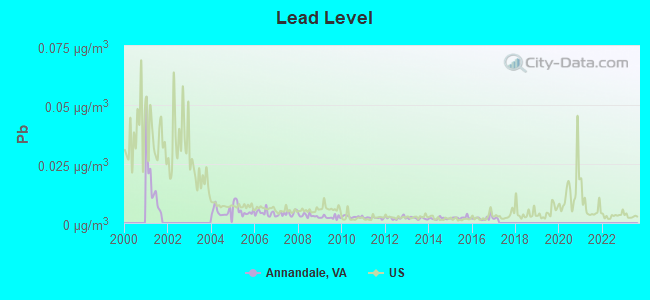
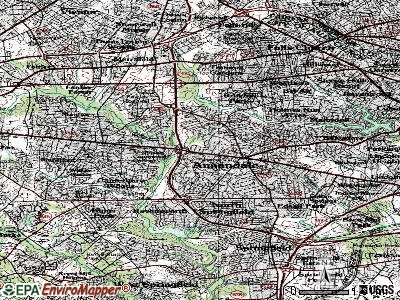
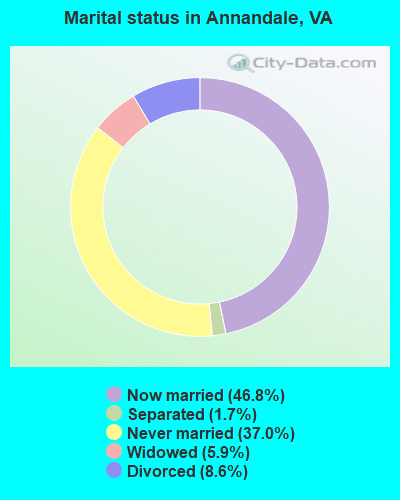
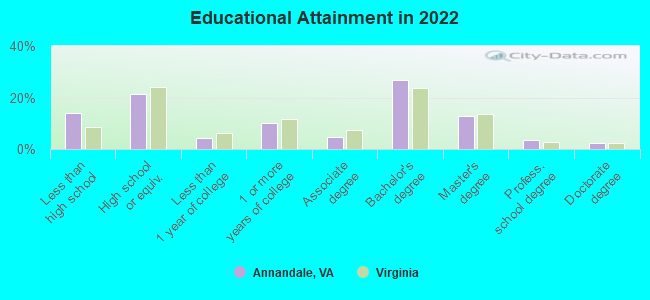
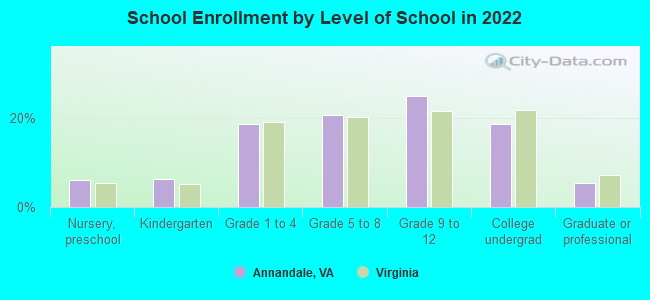
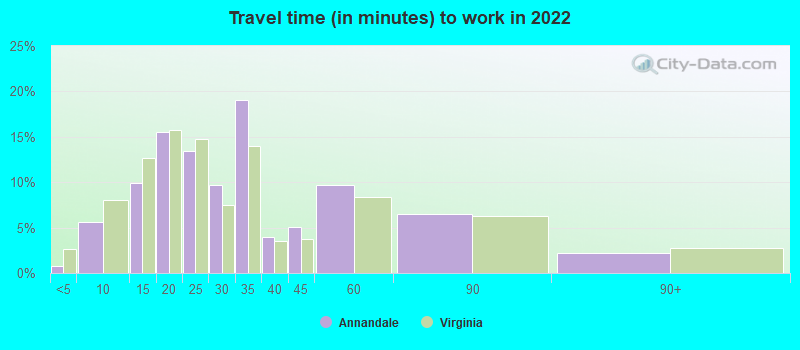
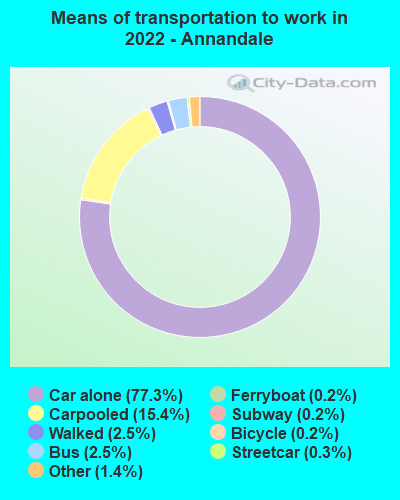
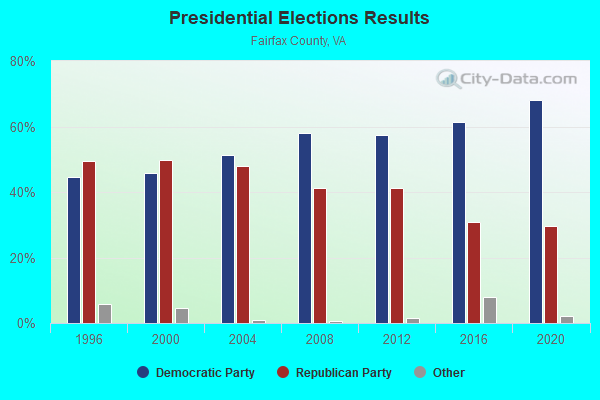
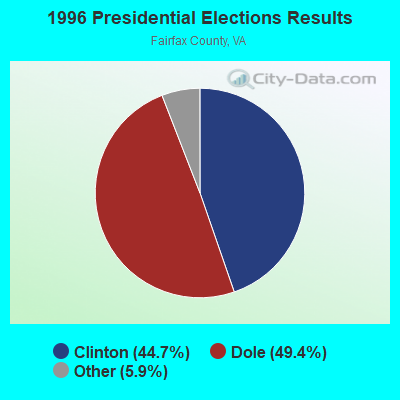
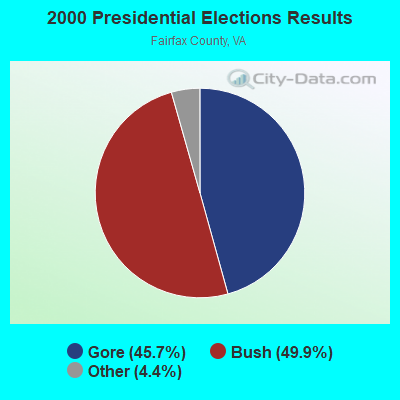
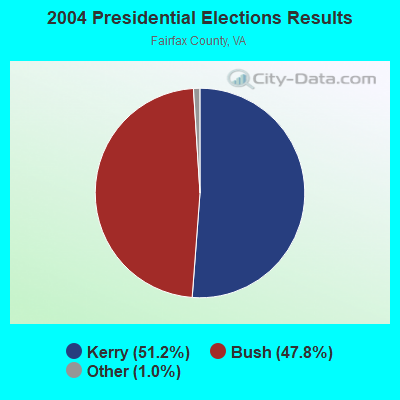
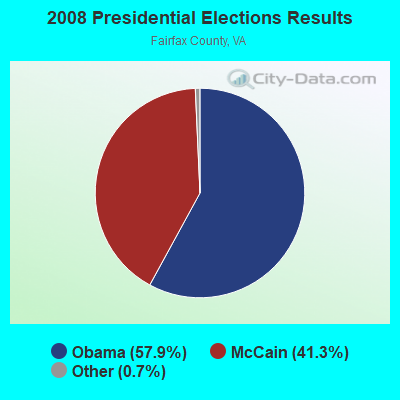
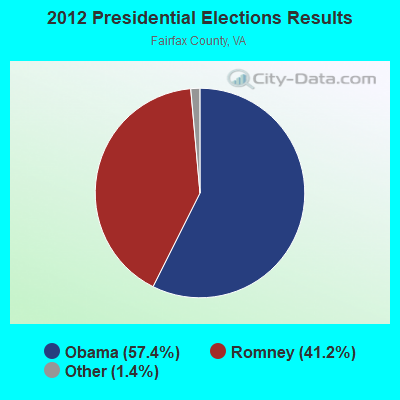
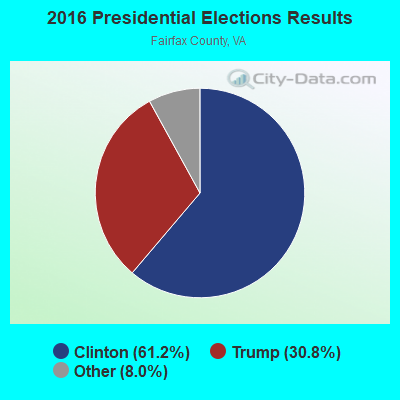
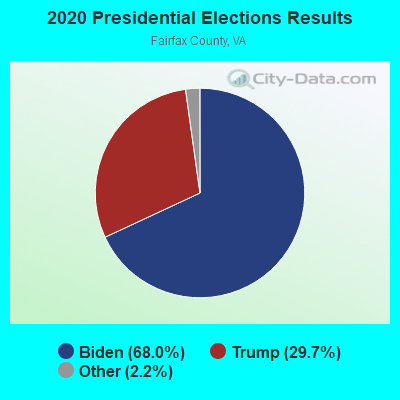
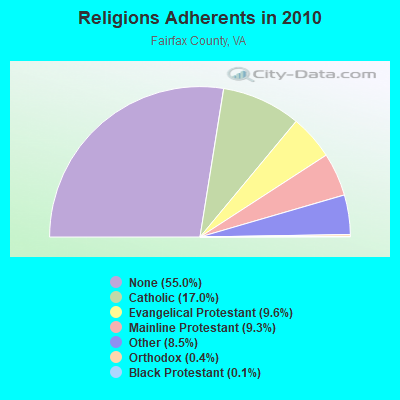
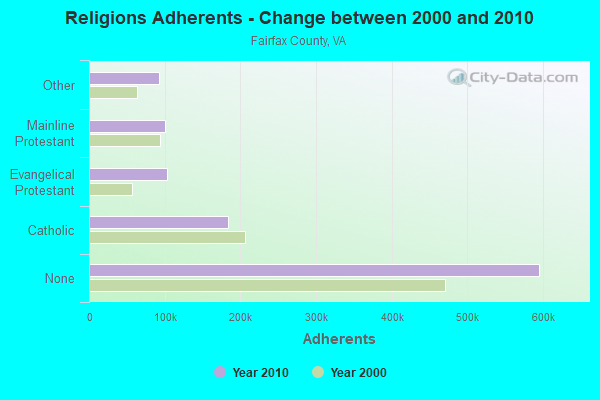
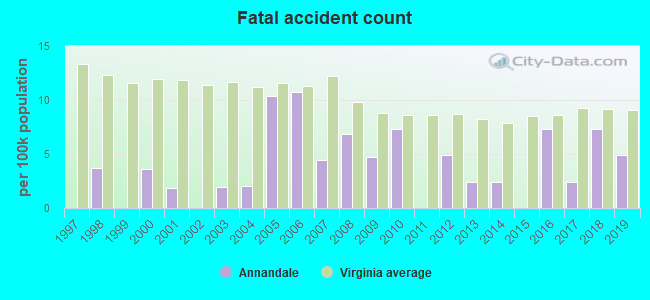
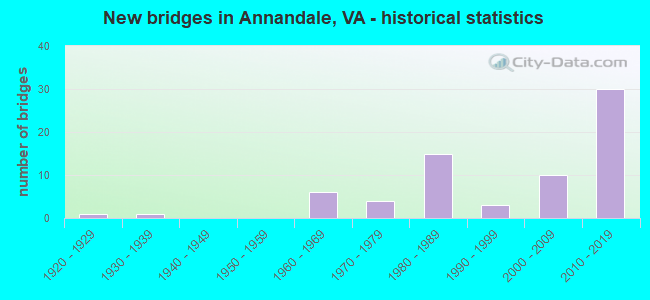
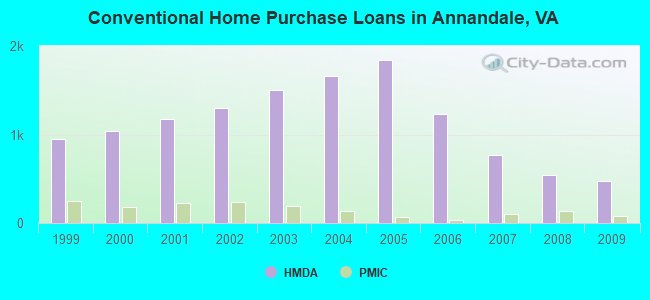
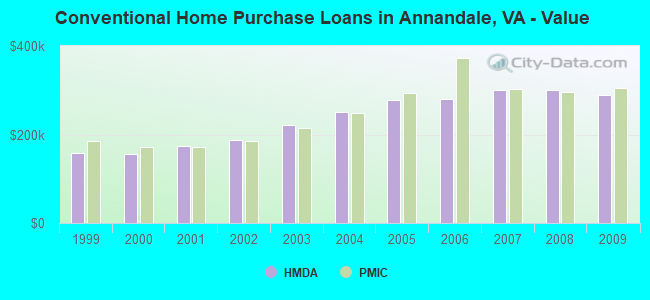
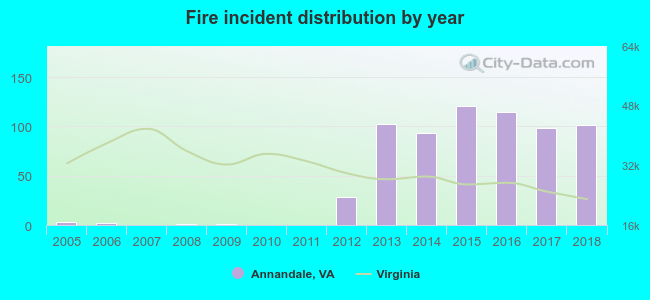 According to the data from the years 2005 - 2018 the average number of fire incidents per year is 48. The highest number of fires - 121 took place in 2015, and the least - 0 in 2007. The data has a rising trend.
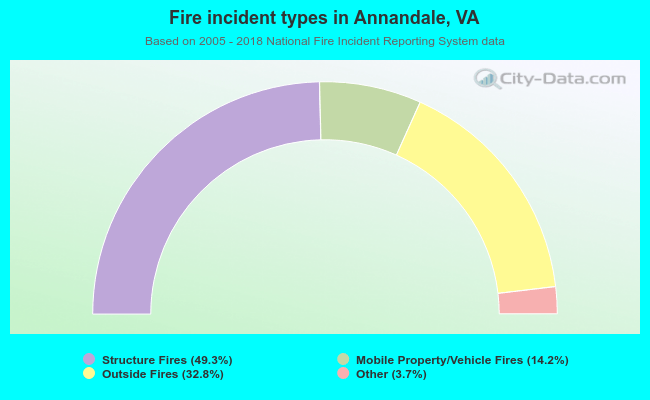 When looking into fire subcategories, the most incidents belonged to: Structure Fires (49.3%), and Outside Fires (32.8%).