Annandale, VA (Virginia) Houses and Residents
Estimated median house or condo value in 2022: $641,839 (it was $221,500 in 2000 )
Annandale:
$641,839Virginia:
$365,700
Lower value quartile - upper value quartile: $491,204 - $777,520Mean price in 2022: Detached houses: $788,914 Here:
$788,914State:
$472,865
Townhouses or other attached units: $578,088 Here:
$578,088State:
$457,437
In 2-unit structures: $261,363 Here:
$261,363State:
$396,289
In 3-to-4-unit structures: $397,108 Here:
$397,108State:
$252,346
In 5-or-more-unit structures: $276,489 Here:
$276,489State:
$382,551
Mobile homes: $318,666 Here:
$318,666State:
$100,736
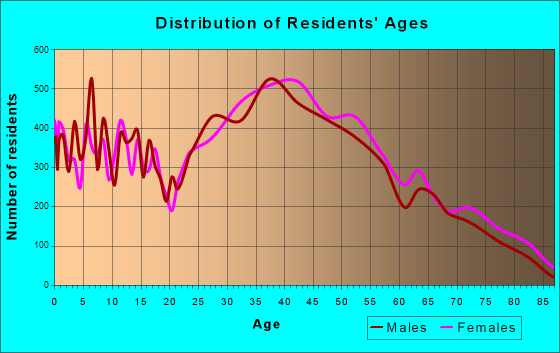
Total population: 41,008 (All urban)
Houses: 14,564 (13,991 occupied: 9,109 owner occupied, 4,958 renter occupied )
% of renters here:
35%State:
33%
Housing density: 1,055 houses/condos per square mile
Median price asked for vacant for-sale houses and condos in 2022: $715,584.
Median contract rent in 2022: $1,748 (lower quartile is $1,483, upper quartile is over $2,000)
Median rent asked for vacant for-rent units in 2022: $2,588
Median gross rent in Annandale, VA in 2022: $1,820
Housing units in Annandale with a mortgage: 5,732 (553 second mortgage, 35 home equity loan, 466 both second mortgage and home equity loan )Houses without a mortgage: 92
Median household income for houses/condos with a mortgage: $175,306
Median household income for apartments without a mortgage: $110,811
Median monthly housing costs: $1,844
Data:
Median house or condo value ($)
Median house or condo value ($ change since 2000)
Median house or condo value ($) - White
Median house or condo value ($) - Black or African American
Median house or condo value ($) - Asian
Median house or condo value ($) - Hispanic or Latino
Median house or condo value ($) - American Indian and Alaska Native
Median house or condo value ($) - Multirace
Median house or condo value ($) - Other Race
Median price asked for mobile homes ($)
Household density (households per square mile)
Mean house or condo value by units in structure - 1, detached ($)
Mean house or condo value by units in structure - 1, attached ($)
Mean house or condo value by units in structure - 2 ($)
Mean house or condo value by units in structure by units in structure - 3 or 4 ($)
Mean house or condo value by units in structure - 5 or more ($)
Mean house or condo value by units in structure - Boat, RV, van, etc. ($)
Mean house or condo value by units in structure - Mobile home ($)
Median contract rent ($)
Median contract rent - Lower quartile ($)
Median contract rent - Upper quartile ($)
Median gross rent ($)
Urban houses (%)
Rural houses (%)
Houses occupied (%)
Houses occupied (% change since 2000)
Houses owner occupied (%)
Houses owner occupied (% change since 2000)
Houses renter occupied (%)
Houses renter occupied (% change since 2000)
Vacant housing units - For rent (%)
Vacant housing units - For rent (% change since 2000)
Vacant housing units - For sale only (%)
Vacant housing units - For sale only (% change since 2000)
Vacant housing units - Rented or sold, not occupied (%)
Vacant housing units - Rented or sold, not occupied (% change since 2000)
Vacant housing units - For seasonal, recreational, or occasional use (%)
Vacant housing units - For seasonal, recreational, or occasional use (% change since 2000)
Vacant housing units - For migrant workers (%)
Vacant housing units - For migrant workers (% change since 2000)
Vacant housing units - Other vacant (%)
Vacant housing units - Other vacant (% change since 2000)
Median monthly housing costs ($)
Median household income for houses/condos with a mortgage ($)
Median household income for houses/condos without a mortgage ($)
Median household income ($)
Median household income ($) - White
Median household income ($) - Black or African American
Median household income ($) - Asian
Median household income ($) - Hispanic or Latino
Median household income ($) - American Indian and Alaska Native
Median household income ($) - Multirace
Median household income ($) - Other Race
Mortgage status - with mortgage (%)
Mortgage status - with second mortgage (%)
Mortgage status - with home equity loan (%)
Mortgage status - with both second mortgage and home equity loan (%)
Mortgage status - without a mortgage (%)
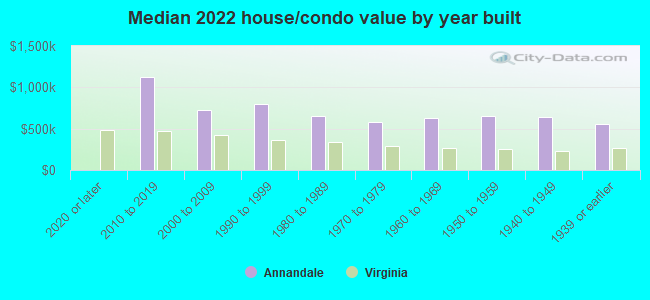
Median year house/condo built
Median year apartment built
Household type by relationship - Male householder living alone (%)
Household type by relationship - Male householder not living alone (%)
Household type by relationship - Female householder living alone (%)
Household type by relationship - Female householder not living alone (%)
Household type by relationship - Opposite-Sex spouse (%)
Household type by relationship - Same-Sex spouse (%)
Household type by relationship - Opposite-Sex unmarried partner (%)
Household type by relationship - Same-Sex unmarried partner (%)
Household type by relationship - In group quarters (%)
Size of family households - 2-person household (%)
Size of family households - 3-person household (%)
Size of family households - 4-person household (%)
Size of family households - 5-person household (%)
Size of family households - 6-person household (%)
Size of family households - 7-or-more-person household (%)
Size of nonfamily households - 1-person household (%)
Size of nonfamily households - 2-person household (%)
Size of nonfamily households - 3-person household (%)
Size of nonfamily households - 4-person household (%)
Size of nonfamily households - 5-person household (%)
Size of nonfamily households - 6-person household (%)
Size of nonfamily households - 7-or-moreperson household (%)
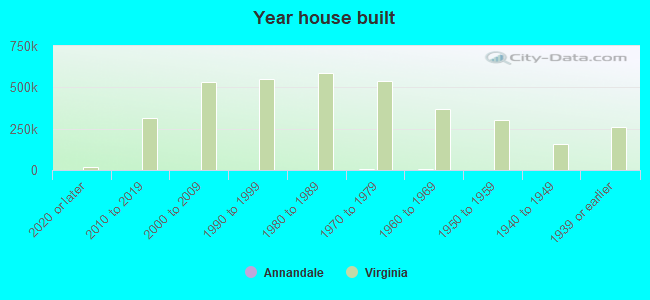
Year house built - Built 2010 or later (%)
Year house built - Built 2000 to 2009 (%)
Year house built - Built 1990 to 1999 (%)
Year house built - Built 1980 to 1989 (%)
Year house built - Built 1970 to 1979 (%)
Year house built - Built 1960 to 1969 (%)
Year house built - Built 1950 to 1959 (%)
Year house built - Built 1940 to 1949 (%)
Year house built - Built 1939 or earlier (%)
Median number of rooms in houses and condos
Median number of rooms in apartments
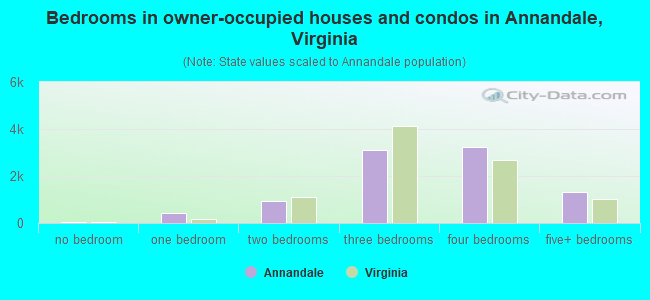
Median number of bedrooms in owner occupied houses
Mean number of bedrooms in owner occupied houses
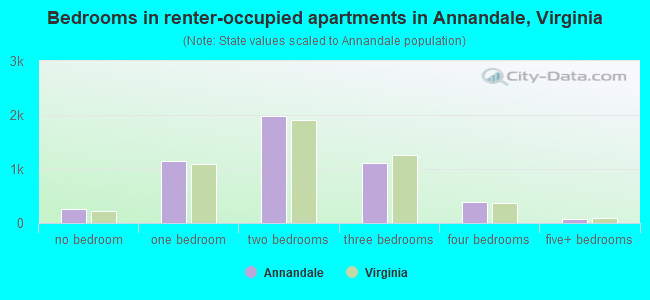
Median number of bedrooms in renter occupied houses
Mean number of bedrooms in renter occupied houses
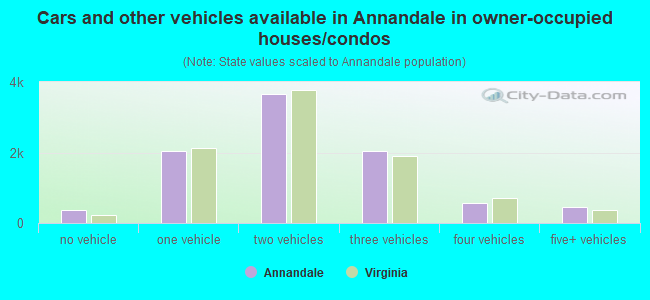
Median number of vehichles in owner occupied houses
Mean number of vehichles in owner occupied houses
Median number of vehichles in renter occupied houses
Mean number of vehichles in renter occupied houses
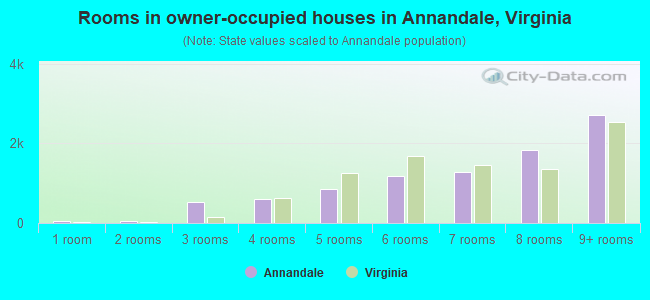
Rooms in owner-occupied houses - 1 room (%)
Rooms in owner-occupied houses - 2 rooms (%)
Rooms in owner-occupied houses - 3 rooms (%)
Rooms in owner-occupied houses - 4 rooms (%)
Rooms in owner-occupied houses - 5 rooms (%)
Rooms in owner-occupied houses - 6 rooms (%)
Rooms in owner-occupied houses - 7 rooms (%)
Rooms in owner-occupied houses - 8 rooms (%)
Rooms in owner-occupied houses - 9+ rooms (%)
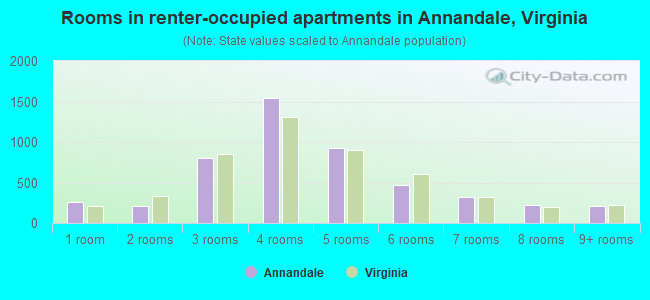
Rooms in renter-occupied houses - 1 room (%)
Rooms in renter-occupied houses - 2 rooms (%)
Rooms in renter-occupied houses - 3 rooms (%)
Rooms in renter-occupied houses - 4 rooms (%)
Rooms in renter-occupied houses - 5 rooms (%)
Rooms in renter-occupied houses - 6 rooms (%)
Rooms in renter-occupied houses - 7 rooms (%)
Rooms in renter-occupied houses - 8 rooms (%)
Rooms in renter-occupied houses - 9+ rooms (%)
Bedrooms in owner-occupied houses - no bedrooms (%)
Bedrooms in owner-occupied houses - 1 bedroom (%)
Bedrooms in owner-occupied houses - 2 bedrooms (%)
Bedrooms in owner-occupied houses - 3 bedrooms (%)
Bedrooms in owner-occupied houses - 4 bedrooms (%)
Bedrooms in owner-occupied houses - 5+ bedrooms (%)
Bedrooms in renter-occupied houses - no bedrooms (%)
Bedrooms in renter-occupied houses - 1 bedroom (%)
Bedrooms in renter-occupied houses - 2 bedrooms (%)
Bedrooms in renter-occupied houses - 3 bedrooms (%)
Bedrooms in renter-occupied houses - 4 bedrooms (%)
Bedrooms in renter-occupied houses - 5+ bedrooms (%)
Vehicles available in owner-occupied houses - no vehicle available (%)
Vehicles available in owner-occupied houses - 1 vehicle available(%)
Vehicles available in owner-occupied houses - 2 Vehicles available (%)
Vehicles available in owner-occupied houses - 3 Vehicles available (%)
Vehicles available in owner-occupied houses - 4 Vehicles available (%)
Vehicles available in owner-occupied houses - 5+ Vehicles available (%)
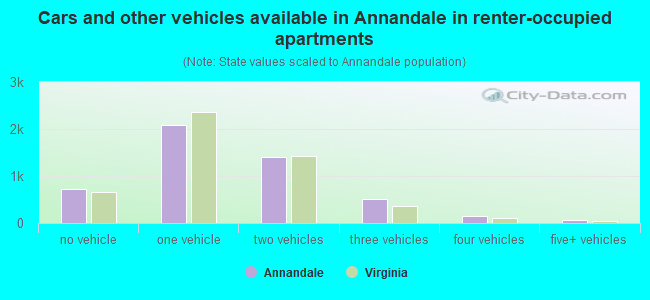
Vehicles available in renter-occupied houses - no vehicle available (%)
Vehicles available in renter-occupied houses - 1 vehicle available (%)
Vehicles available in renter-occupied houses - 2 Vehicles available (%)
Vehicles available in renter-occupied houses - 3 Vehicles available (%)
Vehicles available in renter-occupied houses - 4 Vehicles available (%)
Vehicles available in renter-occupied houses - 5+ Vehicles available (%)
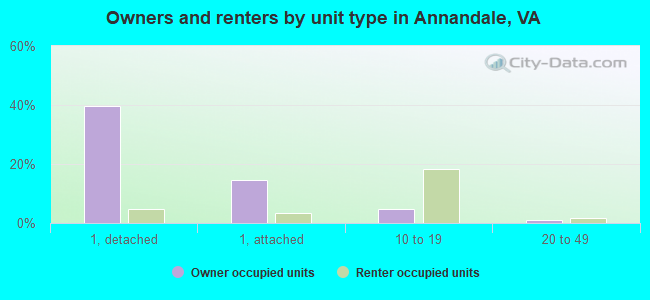
Housing units in structures - 1, detached (%)
Housing units in structures - 1, attached (%)
Housing units in structures - 2 (%)
Housing units in structures - 3 or 4 (%)
Housing units in structures - 5 to 9 (%)
Housing units in structures - 10 to 19 (%)
Housing units in structures - 20 to 49 (%)
Housing units in structures - 50 or more (%)
Housing units in structures - Mobile home (%)
Housing units in structures - Boat, RV, van, etc. (%)
Housing units in structures - Owners - 1, detached (%)
Housing units in structures - Owners - 1, attached (%)
Housing units in structures - Owners - 2 (%)
Housing units in structures - Owners - 3 or 4 (%)
Housing units in structures - Owners - 5 to 9 (%)
Housing units in structures - Owners - 10 to 19 (%)
Housing units in structures - Owners - 20 to 49 (%)
Housing units in structures - Owners - 50 or more (%)
Housing units in structures - Owners - Mobile home (%)
Housing units in structures - Owners - Boat, RV, van, etc. (%)
Housing units in structures - Renters - 1, detached (%)
Housing units in structures - Renters - 1, attached (%)
Housing units in structures - Renters - 2 (%)
Housing units in structures - Renters - 3 or 4 (%)
Housing units in structures - Renters - 5 to 9 (%)
Housing units in structures - Renters - 10 to 19 (%)
Housing units in structures - Renters - 20 to 49 (%)
Housing units in structures - Renters - 50 or more (%)
Housing units in structures - Renters - Mobile home (%)
Housing units in structures - Renters - Boat, RV, van, etc. (%)
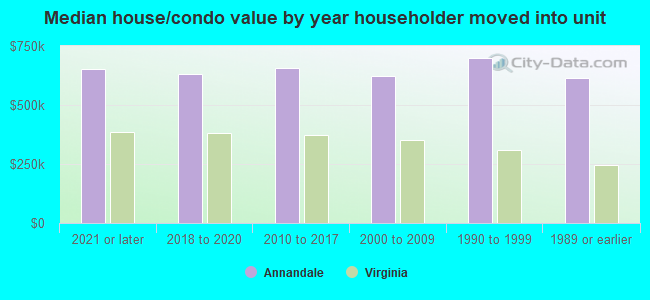
House/condo owner moved in on average (years ago)
Renter moved in on average (years ago)
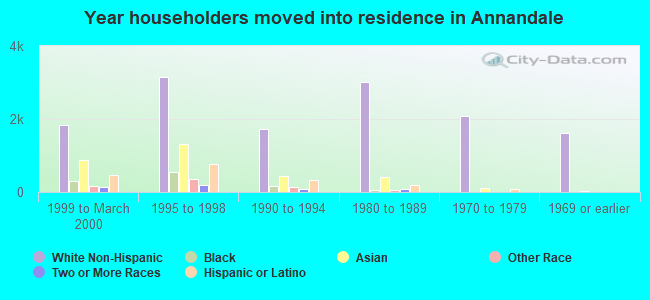
Year householder moved into unit - Moved in 1999 to March 2000 (%)
Year householder moved into unit - Moved in 1999 to March 2000 (%) - White
Year householder moved into unit - Moved in 1999 to March 2000 (%) - Black or African American
Year householder moved into unit - Moved in 1999 to March 2000 (%) - Asian
Year householder moved into unit - Moved in 1999 to March 2000 (%) - Hispanic or Latino
Year householder moved into unit - Moved in 1999 to March 2000 (%) - American Indian and Alaska Native
Year householder moved into unit - Moved in 1999 to March 2000 (%) - Multirace
Year householder moved into unit - Moved in 1999 to March 2000 (%) - Other Race
Year householder moved into unit - Moved in 1995 to 1998 (%)
Year householder moved into unit - Moved in 1995 to 1998 (%) - White
Year householder moved into unit - Moved in 1995 to 1998 (%) - Black or African American
Year householder moved into unit - Moved in 1995 to 1998 (%) - Asian
Year householder moved into unit - Moved in 1995 to 1998 (%) - Hispanic or Latino
Year householder moved into unit - Moved in 1995 to 1998 (%) - American Indian and Alaska Native
Year householder moved into unit - Moved in 1995 to 1998 (%) - Multirace
Year householder moved into unit - Moved in 1995 to 1998 (%) - Other Race
Year householder moved into unit - Moved in 1990 to 1994 (%)
Year householder moved into unit - Moved in 1990 to 1994 (%) - White
Year householder moved into unit - Moved in 1990 to 1994 (%) - Black or African American
Year householder moved into unit - Moved in 1990 to 1994 (%) - Asian
Year householder moved into unit - Moved in 1990 to 1994 (%) - Hispanic or Latino
Year householder moved into unit - Moved in 1990 to 1994 (%) - American Indian and Alaska Native
Year householder moved into unit - Moved in 1990 to 1994 (%) - Multirace
Year householder moved into unit - Moved in 1990 to 1994 (%) - Other Race
Year householder moved into unit - Moved in 1980 to 1989 (%)
Year householder moved into unit - Moved in 1980 to 1989 (%) - White
Year householder moved into unit - Moved in 1980 to 1989 (%) - Black or African American
Year householder moved into unit - Moved in 1980 to 1989 (%) - Asian
Year householder moved into unit - Moved in 1980 to 1989 (%) - Hispanic or Latino
Year householder moved into unit - Moved in 1980 to 1989 (%) - American Indian and Alaska Native
Year householder moved into unit - Moved in 1980 to 1989 (%) - Multirace
Year householder moved into unit - Moved in 1980 to 1989 (%) - Other Race
Year householder moved into unit - Moved in 1970 to 1979 (%)
Year householder moved into unit - Moved in 1970 to 1979 (%) - White
Year householder moved into unit - Moved in 1970 to 1979 (%) - Black or African American
Year householder moved into unit - Moved in 1970 to 1979 (%) - Asian
Year householder moved into unit - Moved in 1970 to 1979 (%) - Hispanic or Latino
Year householder moved into unit - Moved in 1970 to 1979 (%) - American Indian and Alaska Native
Year householder moved into unit - Moved in 1970 to 1979 (%) - Multirace
Year householder moved into unit - Moved in 1970 to 1979 (%) - Other Race
Year householder moved into unit - Moved in 1969 or earlier (%)
Year householder moved into unit - Moved in 1969 or earlier (%) - White
Year householder moved into unit - Moved in 1969 or earlier (%) - Black or African American
Year householder moved into unit - Moved in 1969 or earlier (%) - Asian
Year householder moved into unit - Moved in 1969 or earlier (%) - Hispanic or Latino
Year householder moved into unit - Moved in 1969 or earlier (%) - American Indian and Alaska Native
Year householder moved into unit - Moved in 1969 or earlier (%) - Multirace
Year householder moved into unit - Moved in 1969 or earlier (%) - Other Race
Housing units lacking complete plumbing facilities (%)
Housing units lacking complete kitchen facilities (%)
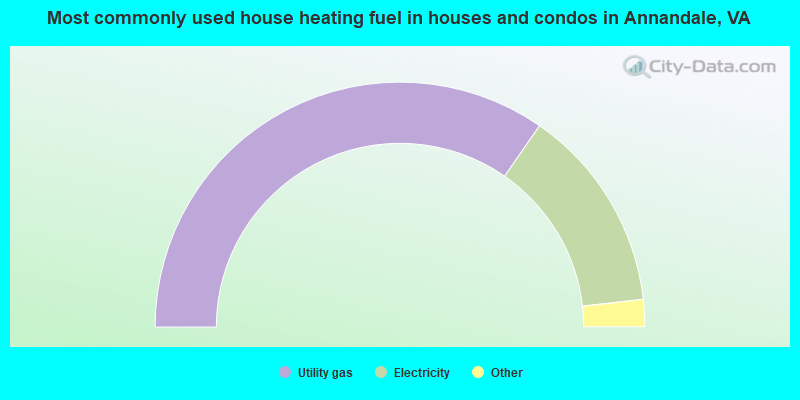
House heating fuel used in houses and condos - Utility gas (%)
House heating fuel used in houses and condos - Bottled, tank, or LP gas (%)
House heating fuel used in houses and condos - Electricity (%)
House heating fuel used in houses and condos - Fuel oil, kerosene, etc. (%)
House heating fuel used in houses and condos - Coal or coke (%)
House heating fuel used in houses and condos - Wood (%)
House heating fuel used in houses and condos - Solar energy (%)
House heating fuel used in houses and condos - Other fuel (%)
House heating fuel used in houses and condos - No fuel used (%)
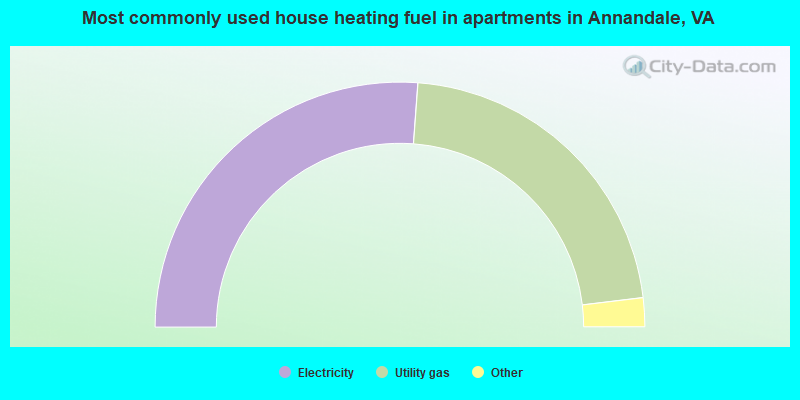
House heating fuel used in apartments - Utility gas (%)
House heating fuel used in apartments - Bottled, tank, or LP gas (%)
House heating fuel used in apartments - Electricity (%)
House heating fuel used in apartments - Fuel oil, kerosene, etc. (%)
House heating fuel used in apartments - Coal or coke (%)
House heating fuel used in apartments - Wood (%)
House heating fuel used in apartments - Solar energy (%)
House heating fuel used in apartments - Other fuel (%)
House heating fuel used in apartments - No fuel used (%)
Latest news about housing in Annandale, VA collected exclusively by city-data.com from local newspapers, TV, and radio stations
Median year house/condo built: 1967Median year apartment built: 1969Household type by relationship:
Households: 42,070
Male householders: 7,220 (1,494 living alone ), Female householders: 6,593 (1,653 living alone )6,499 spouses (6,437 opposite-sex spouses ), 837 unmarried partners , (772 opposite-sex unmarried partners ), 13,074 children (12,596 natural , 183 adopted , 294 stepchildren ), 581 grandchildren , 858 brothers or sisters , 1,626 parents , 0 foster children , 1,726 other relatives , 2,413 non-relatives In group quarters: 638
Size of family households: 3,583 2-persons , 2,283 3-persons , 1,940 4-persons , 993 5-persons , 602 6-persons , 399 7-or-more-persons .
Size of nonfamily households: 3,247 1-person , 749 2-persons , 119 3-persons , 56 4-persons , 79 5-persons .
4,923 married couples with children. single-parent households (685 men , 2,370 women ).
42.8% of residents of Annandale speak English at home. of residents speak Spanish at home (44% speak English very well , 16% speak English well , 25% speak English not well , 15% don't speak English at all ).of residents speak other Indo-European language at home (66% speak English very well , 26% speak English well , 6% speak English not well , 2% don't speak English at all ).of residents speak Asian or Pacific Island language at home (49% speak English very well , 28% speak English well , 19% speak English not well , 3% don't speak English at all ).of residents speak other language at home (71% speak English very well , 21% speak English well , 5% speak English not well , 2% don't speak English at all ).
Foreign born population: 18,453 (43.9%)of them are naturalized citizens )
Median number of rooms in houses and condos:
Median number of rooms in apartments
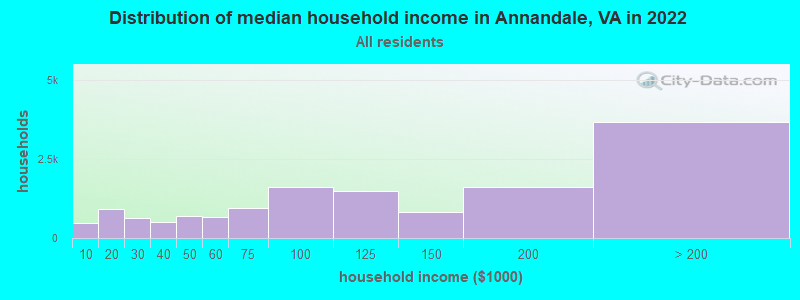
Annandale, VA household income distribution 478 Less than $10,000932 $10,000 to $19,999626 $20,000 to $29,999520 $30,000 to $39,999685 $40,000 to $49,999663 $50,000 to $59,999952 $60,000 to $74,9991,631 $75,000 to $99,9991,487 $100,000 to $124,999815 $125,000 to $149,9991,621 $150,000 to $199,9993,679 $200,000 or more
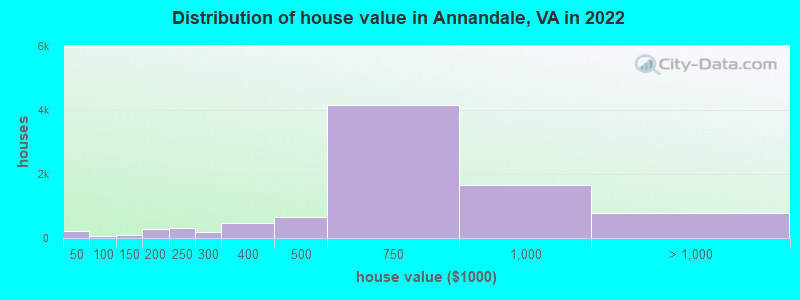
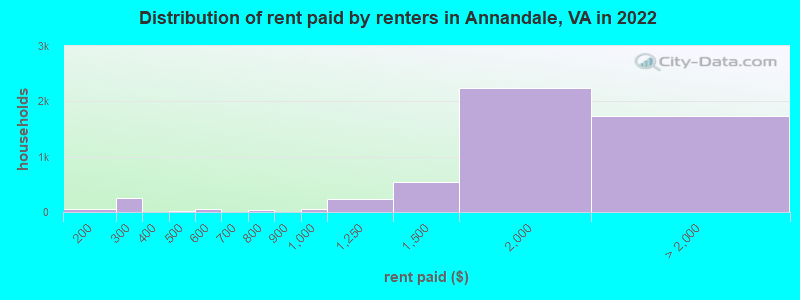
Home value of owner - occupied houses in 2022 in Annandale, VA 152 Less than $10,00035 $10,000 to $14,99919 $30,000 to $34,9992 $40,000 to $49,99942 $50,000 to $59,99931 $70,000 to $79,99970 $100,000 to $124,99916 $125,000 to $149,999103 $150,000 to $174,999181 $175,000 to $199,999315 $200,000 to $249,999184 $250,000 to $299,999468 $300,000 to $399,999643 $400,000 to $499,9994,171 $500,000 to $749,9991,642 $750,000 to $999,999500 $1,000,000 to $1,499,999178 $1,500,000 to $1,999,999101 $2,000,000 or moreRent paid by renters in 2022 in Annandale, VA 9 Less than $10010 $100 to $14945 $150 to $199242 $200 to $2496 $250 to $2994 $400 to $44922 $450 to $49940 $500 to $54919 $550 to $59914 $700 to $74917 $750 to $79945 $900 to $999239 $1,000 to $1,249542 $1,250 to $1,4992,242 $1,500 to $1,999696 $2,000 to $2,499524 $2,500 to $2,99968 $3,000 to $3,49991 $3,500 or more348 No cash rent
Percentage of workers working in this county: 69.5%Number of people working at home: 3,960 (17.3% of all workers )
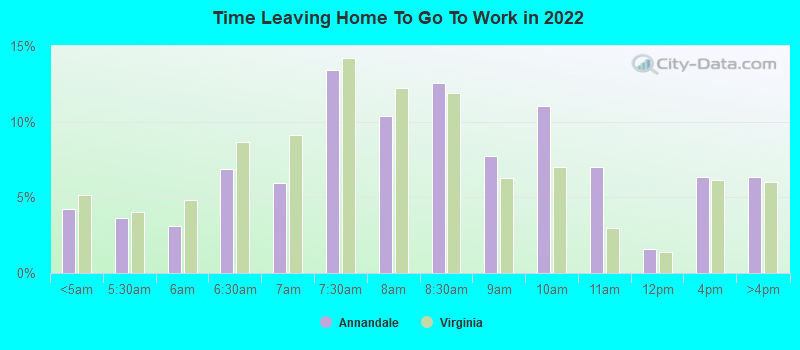
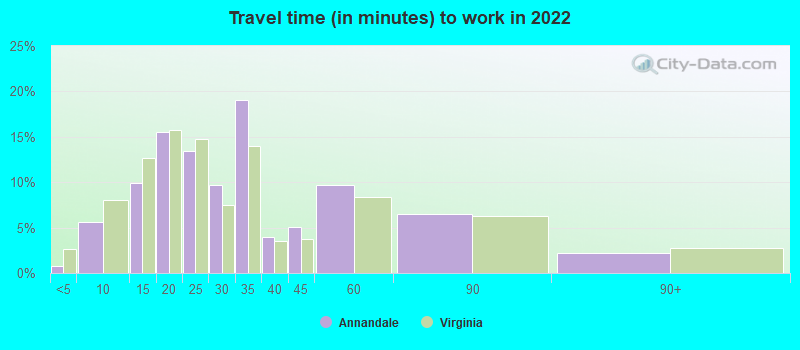
Travel time to work (commute)
Less than 5 minutes: 2745 to 9 minutes: 90710 to 14 minutes: 1,44915 to 19 minutes: 2,95220 to 24 minutes: 3,07925 to 29 minutes: 1,70230 to 34 minutes: 4,13035 to 39 minutes: 75140 to 44 minutes: 93945 to 59 minutes: 1,26660 to 89 minutes: 81090 or more minutes: 217
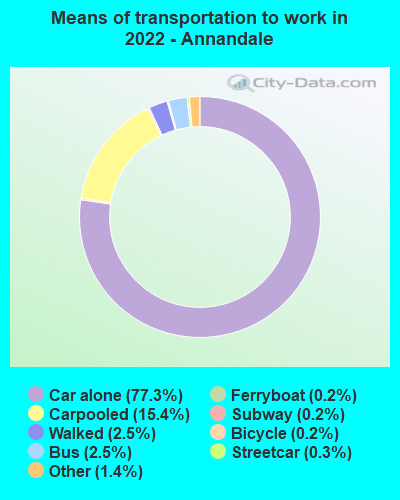
Means of transportation to work:
Drove a car alone: 9,834 (58.5%)Carpooled: 2,012 (12.0%)Bus : 213 (1.3%)Subway or elevated rail : 29 (0.2%)Long-distance train or commuter rail : 17 (0.1%)Ferryboat: 24 (0.1%)Taxi: 244 (1.5%)Bicycle: 22 (0.1%)Walked: 361 (2.1%)Worked at home: 3,960 (23.5%)
Unemployment by race in 2022
Unemployment rate for White non-Hispanic residents 0.9% Males2.8% FemalesUnemployment rate for Black residents 7.5% Males1.4% FemalesUnemployment rate for American Indian and Alaska Native residents 9.2% MalesUnemployment rate for Asian residents 1.4% Males1.2% FemalesUnemployment rate for other race residents 3.2% Males2.4% FemalesUnemployment rate for two or more race residents 1.7% MalesUnemployment rate for Hispanic or Latino residents 3.1% Males4.0% Females
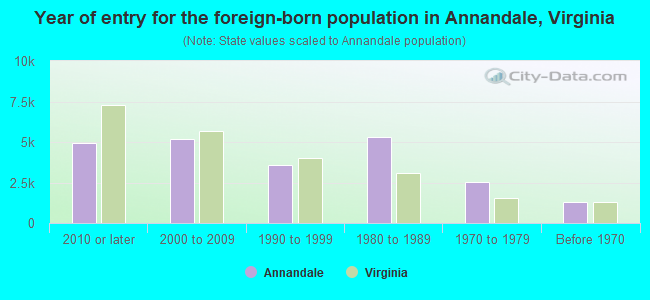
Year of entry for the foreign-born population in Annandale, Virginia
4,969 2010 or later 5,163 2000 to 2009 3,573 1990 to 1999 5,339 1980 to 1989 2,559 1970 to 1979 1,277 Before 1970
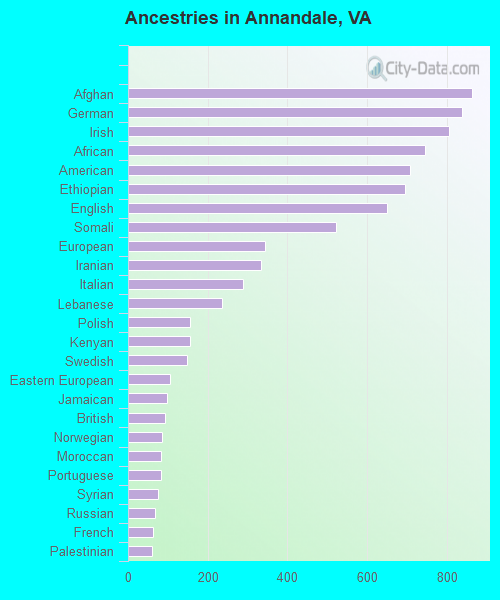
First ancestries reported:
Afghan: 863 (3.2%)
German: 839 (3.1%)
Irish: 806 (3.0%)
African: 745 (2.8%)
American: 707 (2.6%)
Ethiopian: 695 (2.6%)
English: 651 (2.4%)
Somali: 523 (1.9%)
European: 343 (1.3%)
Iranian: 335 (1.2%)
Italian: 288 (1.1%)
Lebanese: 236 (0.9%)
Polish: 156 (0.6%)
Kenyan: 155 (0.6%)
Swedish: 147 (0.5%)
Eastern European: 106 (0.4%)
Jamaican: 99 (0.4%)
British: 94 (0.3%)
Norwegian: 85 (0.3%)
Moroccan: 84 (0.3%)
Portuguese: 84 (0.3%)
Syrian: 76 (0.3%)
Russian: 67 (0.2%)
French: 64 (0.2%)
Palestinian: 60 (0.2%)
Scotch-Irish: 59 (0.2%)
Northern European: 50 (0.2%)
Dutch: 50 (0.2%)
Austrian: 47 (0.2%)
French Canadian: 32 (0.1%)
Scottish: 29 (0.1%)
Ghanaian: 28 (0.1%)
Hungarian: 24 (0.09%)
Sierra Leonean: 22 (0.08%)
Cajun: 21 (0.08%)
Greek: 16 (0.06%)
Welsh: 16 (0.06%)
Barbadian: 16 (0.06%)
Danish: 14 (0.05%)
Czech: 13 (0.05%)
Arab: 12 (0.04%)
Lithuanian: 12 (0.04%)
Canadian: 12 (0.04%)
Croatian: 11 (0.04%)
Belgian: 10 (0.04%)
Slovak: 10 (0.04%)
Ukrainian: 10 (0.04%)
Brazilian: 8 (0.03%)
Finnish: 8 (0.03%)
Armenian: 7 (0.03%)
Israeli: 7 (0.03%)
Egyptian: 7 (0.03%)
Latvian: 6 (0.02%)
Australian: 4 (0.01%)
Bulgarian: 3 (0.01%)
Most common places of birth for foreign-born residents (%): Vietnam Annandale:
13.6% (2,504)Virginia:
4.2% (45,750)
El Salvador Annandale:
9.9% (1,825)Virginia:
9.9% (107,534)
Korea Annandale:
7.8% (1,435)Virginia:
4.9% (52,857)
Bolivia Annandale:
6.9% (1,269)Virginia:
2.4% (25,722)
Guatemala Annandale:
5.8% (1,072)Virginia:
3.3% (35,938)
Honduras Annandale:
4.8% (881)Virginia:
3.0% (32,892)
Afghanistan Annandale:
4.1% (761)Virginia:
1.8% (19,426)
Peru Annandale:
3.8% (700)Virginia:
2.4% (26,366)
India Annandale:
3.4% (627)Virginia:
9.0% (97,830)
Somalia Annandale:
3.2% (599)Virginia:
0.2% (2,288)
Philippines Annandale:
3.2% (592)Virginia:
4.8% (52,629)
Mexico Annandale:
3.2% (591)Virginia:
5.3% (57,498)
Ethiopia Annandale:
2.8% (516)Virginia:
2.9% (32,082)
Nicaragua Annandale:
2.8% (512)Virginia:
0.6% (6,916)
Africa, n.e.c. Annandale:
2.2% (410)Virginia:
0.3% (3,275)
Argentina Annandale:
1.6% (287)Virginia:
0.5% (4,997)
Place of birth for U.S.-born residents:
This state: 12,230Other state: 10,093Northeast: 2,925Midwest: 1,824South: 3,965West: 1,347 86.9% of Annandale residents lived in the same house 1 years ago.
Out of people who lived in different houses, 34.2% lived in this county.
Out of people who lived in different counties, 66.0% lived in Virginia.
Annandale:
86.9%State average:
86.6%
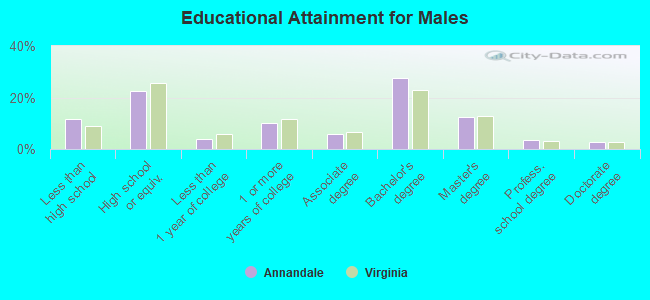
Education attainment for males 25 years and older:
No schooling: 520Nursery to 4th grade: 3245th and 6th grade: 1267th and 8th grade: 419th grade: 19310th grade: 7711th grade: 5212th grade, no diploma: 333High school graduate (or equivalency): 3,207Less than 1 year of college: 564Some college more than 1 year, no degree: 1,450Associate degree: 805Bachelor's degree: 3,922Master's degree: 1,757Professional school degree: 509Doctorate degree: 391
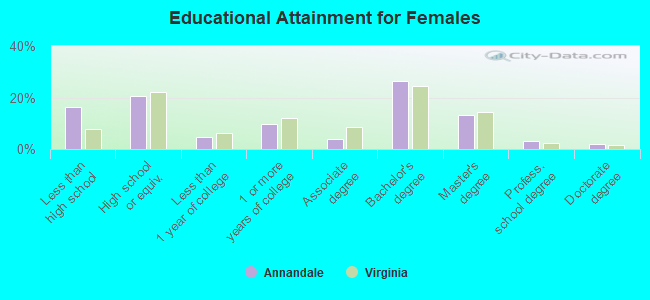
Education attainment for females 25 years and older:
No schooling: 682Nursery to 4th grade: 1735th and 6th grade: 3317th and 8th grade: 2269th grade: 26710th grade: 4511th grade: 28612th grade, no diploma: 439High school graduate (or equivalency): 3,061Less than 1 year of college: 681Some college more than 1 year, no degree: 1,460Associate degree: 602Bachelor's degree: 3,919Master's degree: 1,979Professional school degree: 475Doctorate degree: 279
Housing units in structures:
One, detached: 6,749One, attached: 2,556Two: 2183 or 4: 1105 to 9: 79610 to 19: 2,76020 to 49: 56450 or more: 775Mobile homes: 33Housing units lacking complete plumbing facilities in 2022: 0.2%Housing units lacking complete kitchen facilities in 2022: 1.0%House/condo owner moved in on average 15 years ago
Renter moved in on average 5 years ago
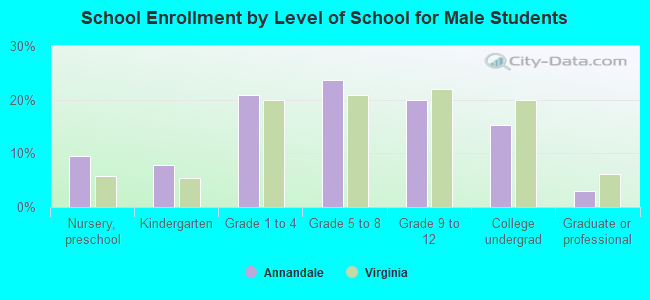
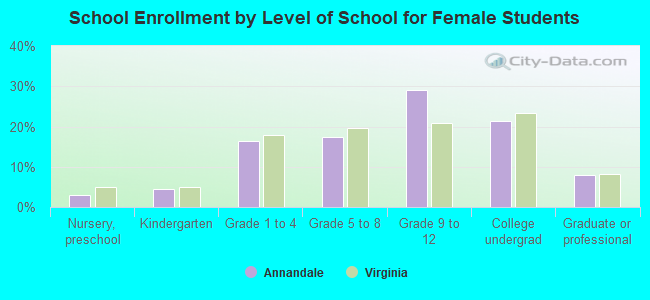
Private vs. public school enrollment:
Students in private schools in grades 1 to 8 (elementary and middle school): 388 Students in private schools in grades 9 to 12 (high school): 206 Students in private undergraduate colleges: 374