Rio Grande City: Fire Incidents, Texas (TX)
Where are fire incidents reported in Rio Grande City, TX
Something went wrong! Please refresh the page.
| Fire incidents reported | |
|---|---|
| Sreet name | Count |
| US 83 HWY | 620 |
| FM 1430 RD | 228 |
| FM 649 RD | 178 |
| FM 2360 RD | 162 |
| ALVAREZ RD | 104 |
| FM 755 RD | 104 |
| MAIN ST | 80 |
| CHARCO BLANCO RD | 78 |
| MIDWAY RD | 72 |
| OLD CASITA RD | 72 |
| OLD EL SAUZ RD | 70 |
| U.S. 83 HWY | 70 |
| FM 3167 RD | 68 |
| OLD 83 HWY | 62 |
| SAUZ RD | 62 |
| FAIRGROUND RD | 60 |
| LOS BARRERAS RD | 60 |
| SUNTEX RD | 58 |
| DORIA ST | 56 |
| OLD MILITARY RD | 56 |
| EISENHOWER RD | 54 |
| SAN BENITO ST | 52 |
| CONQUISTADOR RD | 50 |
| DUMP RD | 46 |
| ELIAS LOPEZ ST | 46 |
| CANALES ST | 42 |
| EMBASSY RD | 42 |
| GUERRA GARZA RD | 42 |
| LA PRIETA RD | 42 |
| CHURCH LN | 40 |
| Other | 1,637 |
2002 - 2018 National Fire Incident Reporting System (NFIRS) incidents
- Incident types reported to NFIRS in Rio Grande City, TX
- 4,41342.6%Fire
- 1,78317.2%Hazardous Condition
- 1,40013.5%Rescue & EMS
- 1,36113.1%Service Call
- 6176.0%Good Intent Call
- 4324.2%False Alarm
- 3253.1%Special Incident
- 130.1%Overpressure Rupture
- Fire incident types reported to NFIRS in Rio Grande City, TX
- 3,33175.5%Outside Fires
- 55912.7%Structure Fires
- 3959.0%Mobile Property/Vehicle Fires
- 1282.9%Other
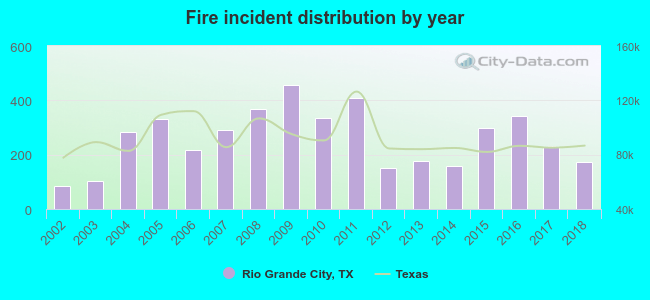 Based on the data from the years 2002 - 2018 the average number of fires per year is 260. The highest number of fire incidents - 457 took place in 2009, and the least - 86 in 2002. The data has a growing trend.
The average number of yearly fire incidents per 10k residents in Rio Grande City, TX compared to nearest cities:
(Note: Based on data for the last 3 years, including only cities with population 5,000 and above)
| Rio Grande City: | 175.5 |
| Roma: | 69.7 |
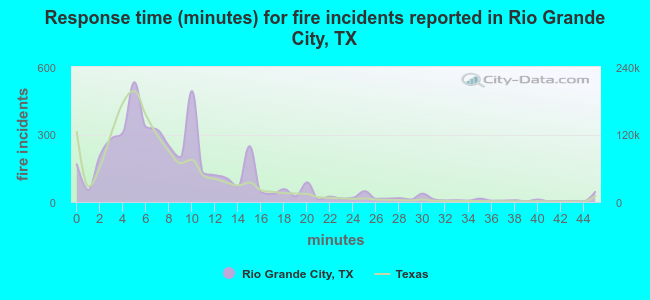 The median response time based on all reported fire incidents is 8 minutes. This is higher than the Texas median value.
The median response time in Rio Grande City, TX compared to nearest cities:
(Note: Based on data for all years, including only cities with at least 500 fire incidents)
| Rio Grande City: | 8 minutes |
| Roma: | 7 minutes |
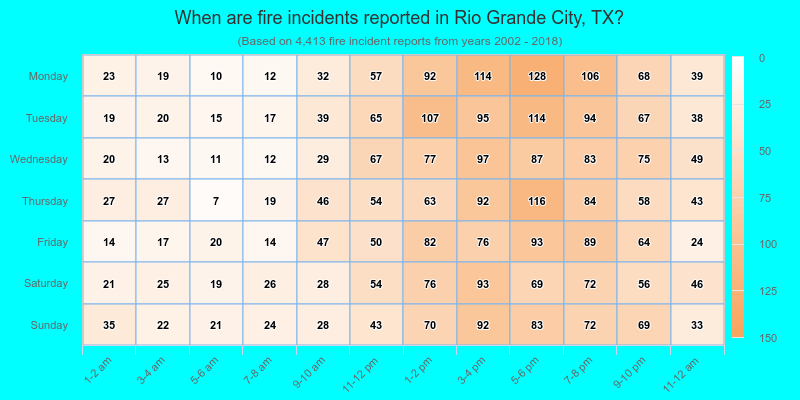
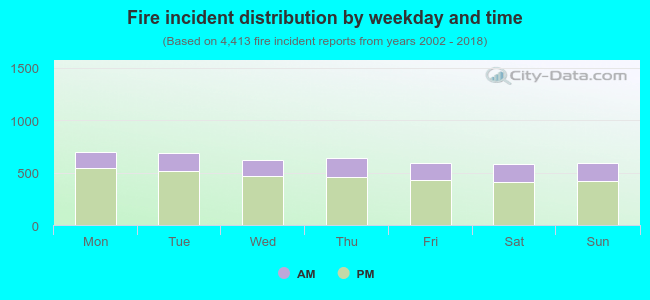 26.5% incidents where reported in the morning and 73.5% in the evening. The most fires (15.9%) took place on Monday, and the least (13.3%) on Saturday.
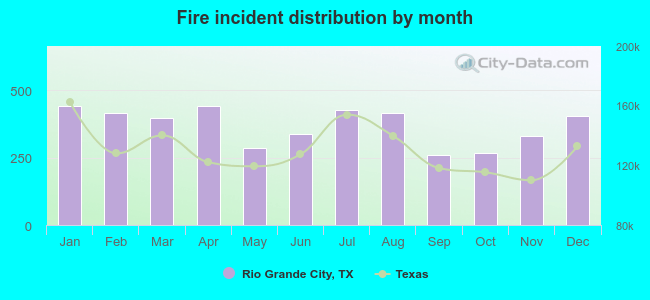 According to the 4,413 fires from years 2002 - 2018 most fires (10.0%) took place during January, and the least (5.9%) in September.
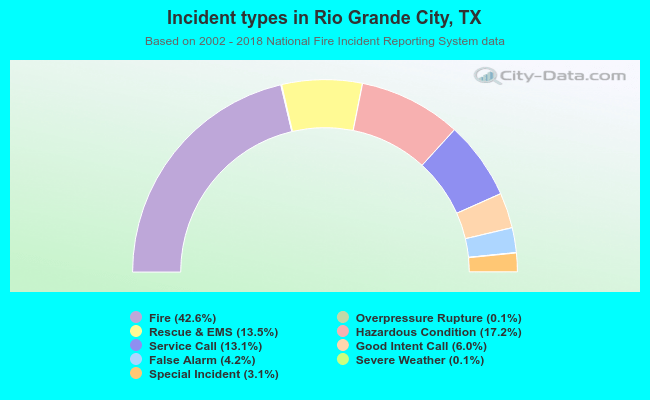 Out of all 10,352 cases reported during the years 2002 - 2018, the most belonged to the categories: Fire (42.6%), Hazardous Condition (17.2%), and Rescue & EMS (13.5%).
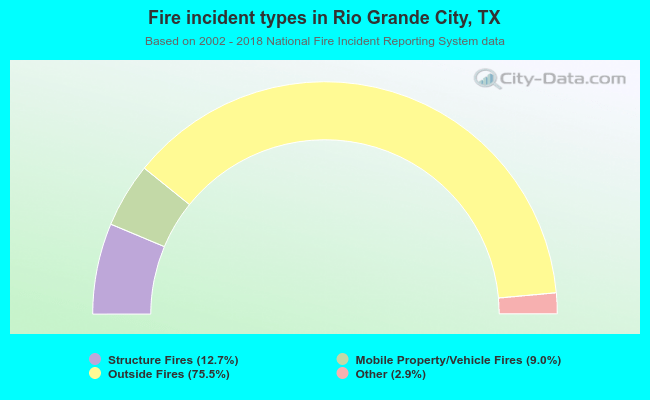 When looking into fire subcategories, the most incidents belonged to: Outside Fires (75.5%), and Structure Fires (12.7%).